
UNITED STATES
SECURITIES AND EXCHANGE COMMISSION
Washington, D.C. 20549
______________
FORM 8-K
CURRENT REPORT
Pursuant to Section 13 or 15(d) of the
Securities Exchange Act of 1934
Date of Report (Date of earliest event reported): August 10, 2026
(Exact name of registrant as specified in its charter)
(State or other jurisdiction of incorporation or organization) | (Commission File Number) | (I.R.S. Employer Identification No.) | ||||||
(Address of principal executive office, including zip code)(1) | ||
( | ||
| (Registrant’s telephone number, including area code) | ||
| Not applicable. | ||
| (Former name or former address, if changed since last report) | ||
______________
Check the appropriate box below if the Form 8-K filing is intended to simultaneously satisfy the filing obligation of the registrant under any of the following provisions:
| Written communications pursuant to Rule 425 under the Securities Act (17 CFR 230.425) | |||||
| Soliciting material pursuant to Rule 14a-12 under the Exchange Act (17 CFR 240.14a-12) | |||||
| Pre-commencement communications pursuant to Rule 14d-2(b) under the Exchange Act (17 CFR 240.14d-2(b)) | |||||
| Pre-commencement communications pursuant to Rule 13e-4(c) under the Exchange Act (17 CFR 240.13e-4(c)) | |||||
| Title of each class | Trading Symbol(s) | Name of each exchange on which registered | ||||||
Common Stock, $0.001 par value per share | LIF | The Nasdaq Stock Market LLC | ||||||
Indicate by check mark whether the registrant is an emerging growth company as defined in Rule 405 of the Securities Act of 1933 (§230.405 of this chapter) or Rule 12b-2 of the Securities Exchange Act of 1934 (§240.12b-2 of this chapter).
Emerging growth company | ||
If an emerging growth company, indicate by check mark if the registrant has elected not to use the extended transition period for complying with any new or revised financial accounting standards provided pursuant to Section 13(a) of the Exchange Act. ☐ | ||
____________________
(1)We are a Delaware corporation with a globally distributed workforce and no corporate headquarters. Under the Securities and Exchange Commission's rules, we are required to designate a “principal executive office.” For purposes of this report, we have designated our office in San Mateo, California as our principal executive office.
Item 2.02 Results of Operations and Financial Condition.
Life360, Inc., a Delaware corporation (“the Company”) is furnishing this Current Report on Form 8-K in connection with the disclosure of information, in the form of a media release and shareholder letter issued on August 10, 2026 . A copy of the media release and shareholder letter are furnished as Exhibits 99.1 and 99.2, respectively to this Current Report on Form 8-K. A conference call to discuss the Company’s financial results will be held on August 10, 2026 at 6:00 p.m. Eastern Time.
Item 7.01 Regulation FD Disclosure.
The Company is furnishing this Item 7.01 of this Current Report on Form 8-K in connection with the disclosure of information, in the form of an investor presentation issued on August 10, 2026 . A copy of the investor presentation is furnished herewith as Exhibit 99.3 to this Current Report on Form 8-K.
The information in Item 2.02 (including Exhibits 99.1 and 99.2) and Item 7.01 (including Exhibit 99.3) of this Current Report on Form 8-K is furnished and shall not be deemed to be “filed” for the purpose of Section 18 of the Securities Exchange Act of 1934, as amended (the “Exchange Act”) or otherwise subject to the liabilities of that section, nor shall it be deemed incorporated by reference into any filing under the Securities Act of 1933, as amended, or the Exchange Act, except as shall be expressly set forth by specific reference in such a filing.
The replay of the conference call and webcast will be available on the Company’s website located at www.investors.life360.com, although the Company reserves the right to discontinue that availability at any time.
Item 9.01 Financial Statements and Exhibits.
(d) Exhibits
| Exhibit No. | Description | ||||
| 99.1 | |||||
| 99.2 | |||||
| 99.3 | |||||
| 104 | Cover Page Interactive Data File - the cover page XBRL tags are embedded within the Inline XBRL document | ||||
SIGNATURES
Pursuant to the requirements of the Securities Exchange Act of 1934, the registrant has duly caused this report to be signed on its behalf by the undersigned hereunto duly authorized.
| LIFE360, INC. | |||||||||||
| Dated: | By: | /s/ Russell Burke | |||||||||
| Russell Burke | |||||||||||
| Chief Financial Officer | |||||||||||
(Principal Financial and Accounting Officer) | |||||||||||
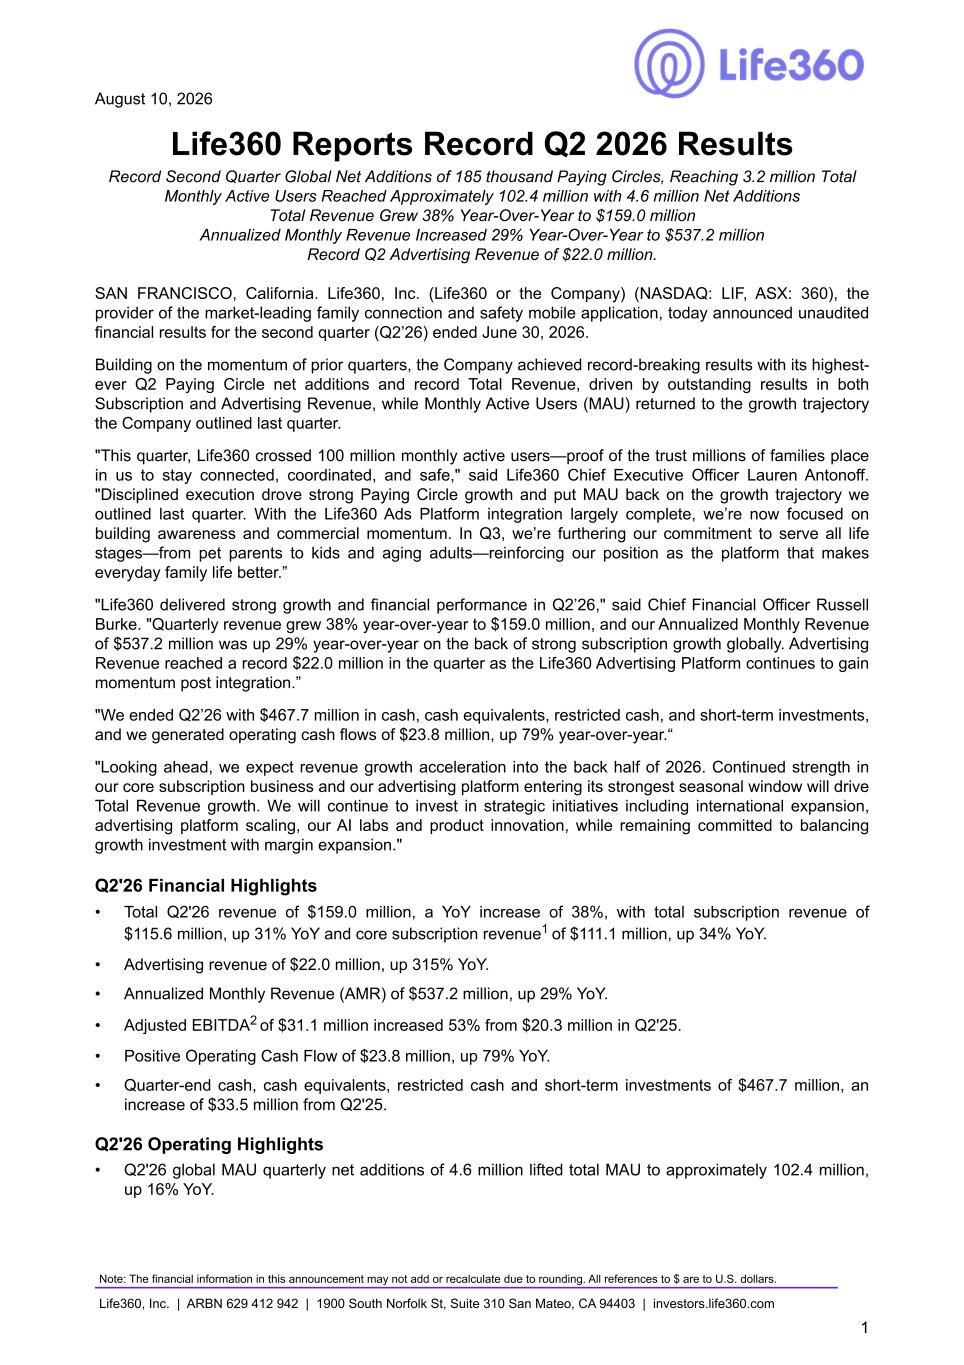
August 10, 2026 Life360 Reports Record Q2 2026 Results Record Second Quarter Global Net Additions of 185 thousand Paying Circles, Reaching 3.2 million Total Monthly Active Users Reached Approximately 102.4 million with 4.6 million Net Additions Total Revenue Grew 38% Year-Over-Year to $159.0 million Annualized Monthly Revenue Increased 29% Year-Over-Year to $537.2 million Record Q2 Advertising Revenue of $22.0 million. SAN FRANCISCO, California. Life360, Inc. (Life360 or the Company) (NASDAQ: LIF, ASX: 360), the provider of the market-leading family connection and safety mobile application, today announced unaudited financial results for the second quarter (Q2’26) ended June 30, 2026. Building on the momentum of prior quarters, the Company achieved record-breaking results with its highest- ever Q2 Paying Circle net additions and record Total Revenue, driven by outstanding results in both Subscription and Advertising Revenue, while Monthly Active Users (MAU) returned to the growth trajectory the Company outlined last quarter. "This quarter, Life360 crossed 100 million monthly active users—proof of the trust millions of families place in us to stay connected, coordinated, and safe," said Life360 Chief Executive Officer Lauren Antonoff. "Disciplined execution drove strong Paying Circle growth and put MAU back on the growth trajectory we outlined last quarter. With the Life360 Ads Platform integration largely complete, we’re now focused on building awareness and commercial momentum. In Q3, we’re furthering our commitment to serve all life stages—from pet parents to kids and aging adults—reinforcing our position as the platform that makes everyday family life better.” "Life360 delivered strong growth and financial performance in Q2’26," said Chief Financial Officer Russell Burke. "Quarterly revenue grew 38% year-over-year to $159.0 million, and our Annualized Monthly Revenue of $537.2 million was up 29% year-over-year on the back of strong subscription growth globally. Advertising Revenue reached a record $22.0 million in the quarter as the Life360 Advertising Platform continues to gain momentum post integration.” "We ended Q2’26 with $467.7 million in cash, cash equivalents, restricted cash, and short-term investments, and we generated operating cash flows of $23.8 million, up 79% year-over-year.“ "Looking ahead, we expect revenue growth acceleration into the back half of 2026. Continued strength in our core subscription business and our advertising platform entering its strongest seasonal window will drive Total Revenue growth. We will continue to invest in strategic initiatives including international expansion, advertising platform scaling, our AI labs and product innovation, while remaining committed to balancing growth investment with margin expansion." Q2'26 Financial Highlights • Total Q2'26 revenue of $159.0 million, a YoY increase of 38%, with total subscription revenue of $115.6 million, up 31% YoY and core subscription revenue1 of $111.1 million, up 34% YoY. • Advertising revenue of $22.0 million, up 315% YoY. • Annualized Monthly Revenue (AMR) of $537.2 million, up 29% YoY. • Adjusted EBITDA2 of $31.1 million increased 53% from $20.3 million in Q2'25. • Positive Operating Cash Flow of $23.8 million, up 79% YoY. • Quarter-end cash, cash equivalents, restricted cash and short-term investments of $467.7 million, an increase of $33.5 million from Q2'25. Q2'26 Operating Highlights • Q2'26 global MAU quarterly net additions of 4.6 million lifted total MAU to approximately 102.4 million, up 16% YoY. Note: The financial information in this announcement may not add or recalculate due to rounding. All references to $ are to U.S. dollars. Life360, Inc. | ARBN 629 412 942 | 1900 South Norfolk St, Suite 310 San Mateo, CA 94403 | investors.life360.com 1
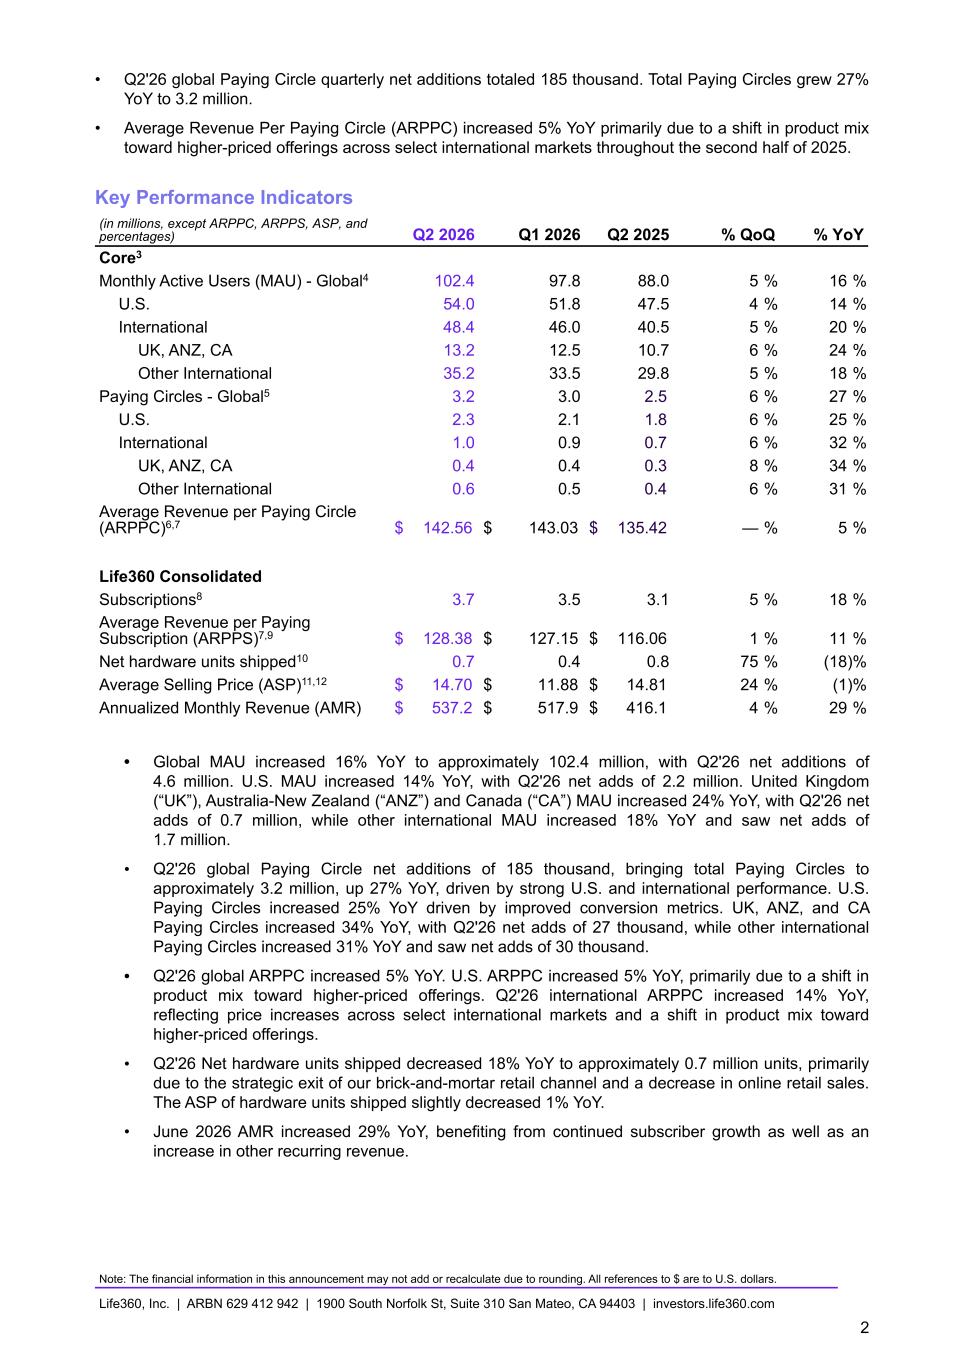
• Q2'26 global Paying Circle quarterly net additions totaled 185 thousand. Total Paying Circles grew 27% YoY to 3.2 million. • Average Revenue Per Paying Circle (ARPPC) increased 5% YoY primarily due to a shift in product mix toward higher-priced offerings across select international markets throughout the second half of 2025. Key Performance Indicators (in millions, except ARPPC, ARPPS, ASP, and percentages) Q2 2026 Q1 2026 Q2 2025 % QoQ % YoY Core3 Monthly Active Users (MAU) - Global4 102.4 97.8 88.0 5 % 16 % U.S. 54.0 51.8 47.5 4 % 14 % International 48.4 46.0 40.5 5 % 20 % UK, ANZ, CA 13.2 12.5 10.7 6 % 24 % Other International 35.2 33.5 29.8 5 % 18 % Paying Circles - Global5 3.2 3.0 2.5 6 % 27 % U.S. 2.3 2.1 1.8 6 % 25 % International 1.0 0.9 0.7 6 % 32 % UK, ANZ, CA 0.4 0.4 0.3 8 % 34 % Other International 0.6 0.5 0.4 6 % 31 % Average Revenue per Paying Circle (ARPPC)6,7 $ 142.56 $ 143.03 $ 135.42 — % 5 % Life360 Consolidated Subscriptions8 3.7 3.5 3.1 5 % 18 % Average Revenue per Paying Subscription (ARPPS)7,9 $ 128.38 $ 127.15 $ 116.06 1 % 11 % Net hardware units shipped10 0.7 0.4 0.8 75 % (18) % Average Selling Price (ASP)11,12 $ 14.70 $ 11.88 $ 14.81 24 % (1) % Annualized Monthly Revenue (AMR) $ 537.2 $ 517.9 $ 416.1 4 % 29 % • Global MAU increased 16% YoY to approximately 102.4 million, with Q2'26 net additions of 4.6 million. U.S. MAU increased 14% YoY, with Q2'26 net adds of 2.2 million. United Kingdom (“UK”), Australia-New Zealand (“ANZ”) and Canada (“CA”) MAU increased 24% YoY, with Q2'26 net adds of 0.7 million, while other international MAU increased 18% YoY and saw net adds of 1.7 million. • Q2'26 global Paying Circle net additions of 185 thousand, bringing total Paying Circles to approximately 3.2 million, up 27% YoY, driven by strong U.S. and international performance. U.S. Paying Circles increased 25% YoY driven by improved conversion metrics. UK, ANZ, and CA Paying Circles increased 34% YoY, with Q2'26 net adds of 27 thousand, while other international Paying Circles increased 31% YoY and saw net adds of 30 thousand. • Q2'26 global ARPPC increased 5% YoY. U.S. ARPPC increased 5% YoY, primarily due to a shift in product mix toward higher-priced offerings. Q2'26 international ARPPC increased 14% YoY, reflecting price increases across select international markets and a shift in product mix toward higher-priced offerings. • Q2'26 Net hardware units shipped decreased 18% YoY to approximately 0.7 million units, primarily due to the strategic exit of our brick-and-mortar retail channel and a decrease in online retail sales. The ASP of hardware units shipped slightly decreased 1% YoY. • June 2026 AMR increased 29% YoY, benefiting from continued subscriber growth as well as an increase in other recurring revenue. Note: The financial information in this announcement may not add or recalculate due to rounding. All references to $ are to U.S. dollars. Life360, Inc. | ARBN 629 412 942 | 1900 South Norfolk St, Suite 310 San Mateo, CA 94403 | investors.life360.com 2
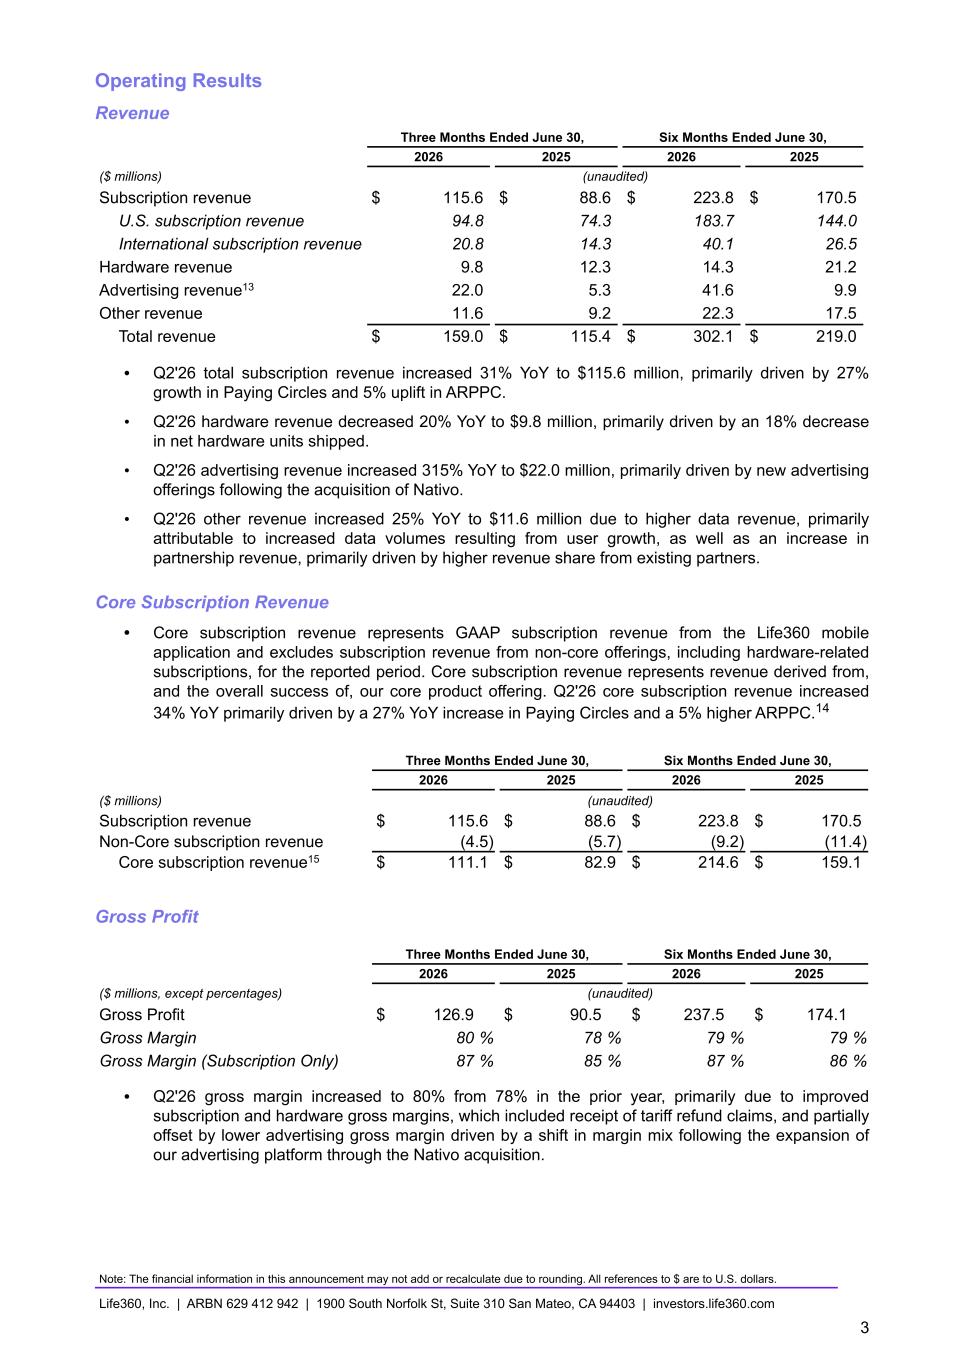
Operating Results Revenue Three Months Ended June 30, Six Months Ended June 30, 2026 2025 2026 2025 ($ millions) (unaudited) Subscription revenue $ 115.6 $ 88.6 $ 223.8 $ 170.5 U.S. subscription revenue 94.8 74.3 183.7 144.0 International subscription revenue 20.8 14.3 40.1 26.5 Hardware revenue 9.8 12.3 14.3 21.2 Advertising revenue13 22.0 5.3 41.6 9.9 Other revenue 11.6 9.2 22.3 17.5 Total revenue $ 159.0 $ 115.4 $ 302.1 $ 219.0 • Q2'26 total subscription revenue increased 31% YoY to $115.6 million, primarily driven by 27% growth in Paying Circles and 5% uplift in ARPPC. • Q2'26 hardware revenue decreased 20% YoY to $9.8 million, primarily driven by an 18% decrease in net hardware units shipped. • Q2'26 advertising revenue increased 315% YoY to $22.0 million, primarily driven by new advertising offerings following the acquisition of Nativo. • Q2'26 other revenue increased 25% YoY to $11.6 million due to higher data revenue, primarily attributable to increased data volumes resulting from user growth, as well as an increase in partnership revenue, primarily driven by higher revenue share from existing partners. Core Subscription Revenue • Core subscription revenue represents GAAP subscription revenue from the Life360 mobile application and excludes subscription revenue from non-core offerings, including hardware-related subscriptions, for the reported period. Core subscription revenue represents revenue derived from, and the overall success of, our core product offering. Q2'26 core subscription revenue increased 34% YoY primarily driven by a 27% YoY increase in Paying Circles and a 5% higher ARPPC.14 Three Months Ended June 30, Six Months Ended June 30, 2026 2025 2026 2025 ($ millions) (unaudited) Subscription revenue $ 115.6 $ 88.6 $ 223.8 $ 170.5 Non-Core subscription revenue (4.5) (5.7) (9.2) (11.4) Core subscription revenue15 $ 111.1 $ 82.9 $ 214.6 $ 159.1 Gross Profit Three Months Ended June 30, Six Months Ended June 30, 2026 2025 2026 2025 ($ millions, except percentages) (unaudited) Gross Profit $ 126.9 $ 90.5 $ 237.5 $ 174.1 Gross Margin 80 % 78 % 79 % 79 % Gross Margin (Subscription Only) 87 % 85 % 87 % 86 % • Q2'26 gross margin increased to 80% from 78% in the prior year, primarily due to improved subscription and hardware gross margins, which included receipt of tariff refund claims, and partially offset by lower advertising gross margin driven by a shift in margin mix following the expansion of our advertising platform through the Nativo acquisition. Note: The financial information in this announcement may not add or recalculate due to rounding. All references to $ are to U.S. dollars. Life360, Inc. | ARBN 629 412 942 | 1900 South Norfolk St, Suite 310 San Mateo, CA 94403 | investors.life360.com 3
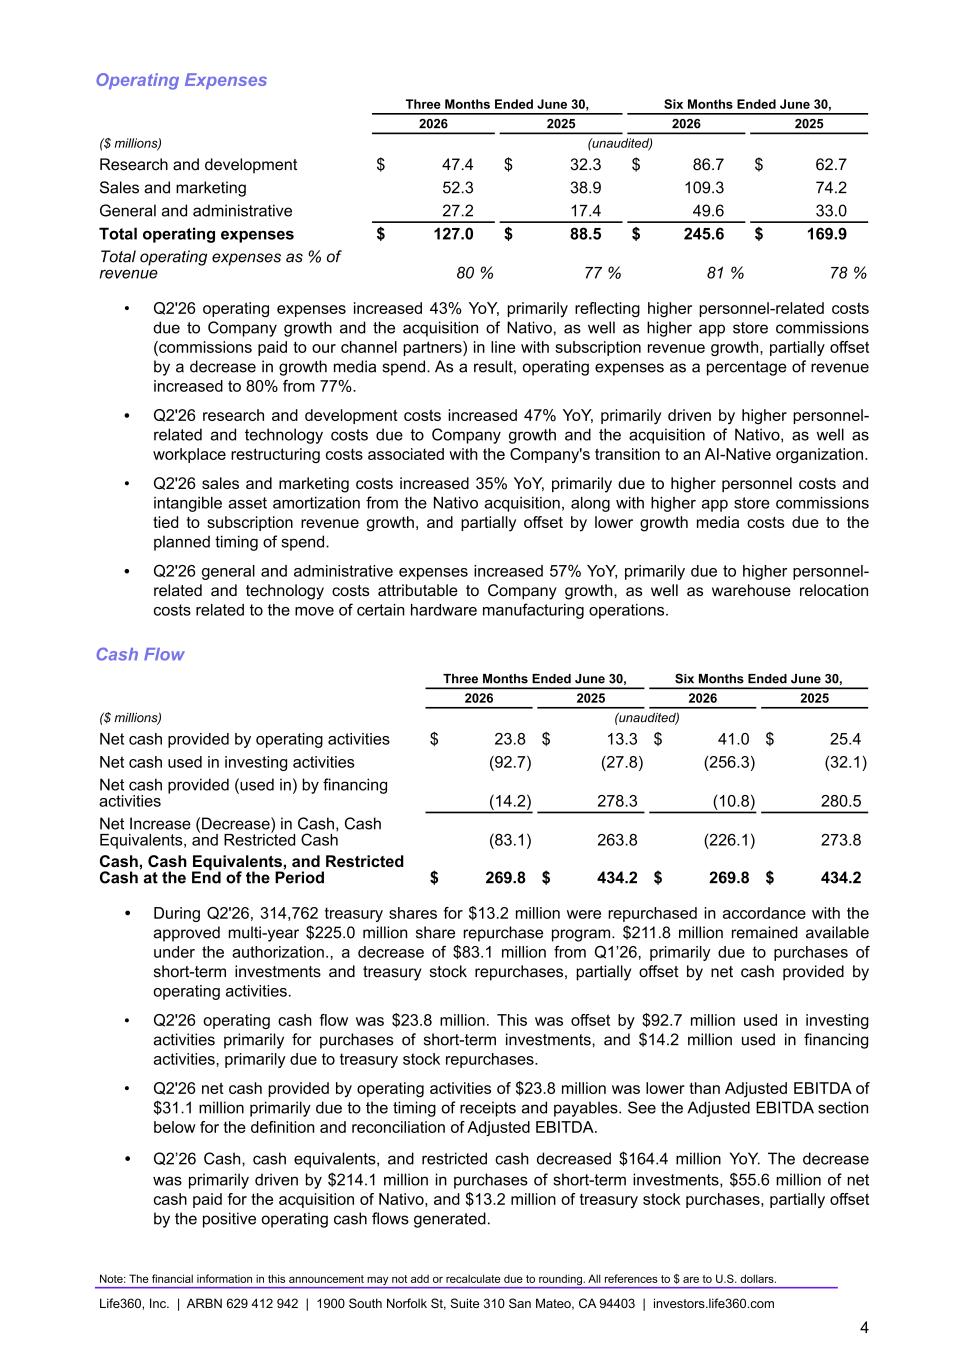
Operating Expenses Three Months Ended June 30, Six Months Ended June 30, 2026 2025 2026 2025 ($ millions) (unaudited) Research and development $ 47.4 $ 32.3 $ 86.7 $ 62.7 Sales and marketing 52.3 38.9 109.3 74.2 General and administrative 27.2 17.4 49.6 33.0 Total operating expenses $ 127.0 $ 88.5 $ 245.6 $ 169.9 Total operating expenses as % of revenue 80 % 77 % 81 % 78 % • Q2'26 operating expenses increased 43% YoY, primarily reflecting higher personnel-related costs due to Company growth and the acquisition of Nativo, as well as higher app store commissions (commissions paid to our channel partners) in line with subscription revenue growth, partially offset by a decrease in growth media spend. As a result, operating expenses as a percentage of revenue increased to 80% from 77%. • Q2'26 research and development costs increased 47% YoY, primarily driven by higher personnel- related and technology costs due to Company growth and the acquisition of Nativo, as well as workplace restructuring costs associated with the Company's transition to an AI-Native organization. • Q2'26 sales and marketing costs increased 35% YoY, primarily due to higher personnel costs and intangible asset amortization from the Nativo acquisition, along with higher app store commissions tied to subscription revenue growth, and partially offset by lower growth media costs due to the planned timing of spend. • Q2'26 general and administrative expenses increased 57% YoY, primarily due to higher personnel- related and technology costs attributable to Company growth, as well as warehouse relocation costs related to the move of certain hardware manufacturing operations. Cash Flow Three Months Ended June 30, Six Months Ended June 30, 2026 2025 2026 2025 ($ millions) (unaudited) Net cash provided by operating activities $ 23.8 $ 13.3 $ 41.0 $ 25.4 Net cash used in investing activities (92.7) (27.8) (256.3) (32.1) Net cash provided (used in) by financing activities (14.2) 278.3 (10.8) 280.5 Net Increase (Decrease) in Cash, Cash Equivalents, and Restricted Cash (83.1) 263.8 (226.1) 273.8 Cash, Cash Equivalents, and Restricted Cash at the End of the Period $ 269.8 $ 434.2 $ 269.8 $ 434.2 • During Q2'26, 314,762 treasury shares for $13.2 million were repurchased in accordance with the approved multi-year $225.0 million share repurchase program. $211.8 million remained available under the authorization., a decrease of $83.1 million from Q1’26, primarily due to purchases of short-term investments and treasury stock repurchases, partially offset by net cash provided by operating activities. • Q2'26 operating cash flow was $23.8 million. This was offset by $92.7 million used in investing activities primarily for purchases of short-term investments, and $14.2 million used in financing activities, primarily due to treasury stock repurchases. • Q2'26 net cash provided by operating activities of $23.8 million was lower than Adjusted EBITDA of $31.1 million primarily due to the timing of receipts and payables. See the Adjusted EBITDA section below for the definition and reconciliation of Adjusted EBITDA. • Q2’26 Cash, cash equivalents, and restricted cash decreased $164.4 million YoY. The decrease was primarily driven by $214.1 million in purchases of short-term investments, $55.6 million of net cash paid for the acquisition of Nativo, and $13.2 million of treasury stock purchases, partially offset by the positive operating cash flows generated. Note: The financial information in this announcement may not add or recalculate due to rounding. All references to $ are to U.S. dollars. Life360, Inc. | ARBN 629 412 942 | 1900 South Norfolk St, Suite 310 San Mateo, CA 94403 | investors.life360.com 4
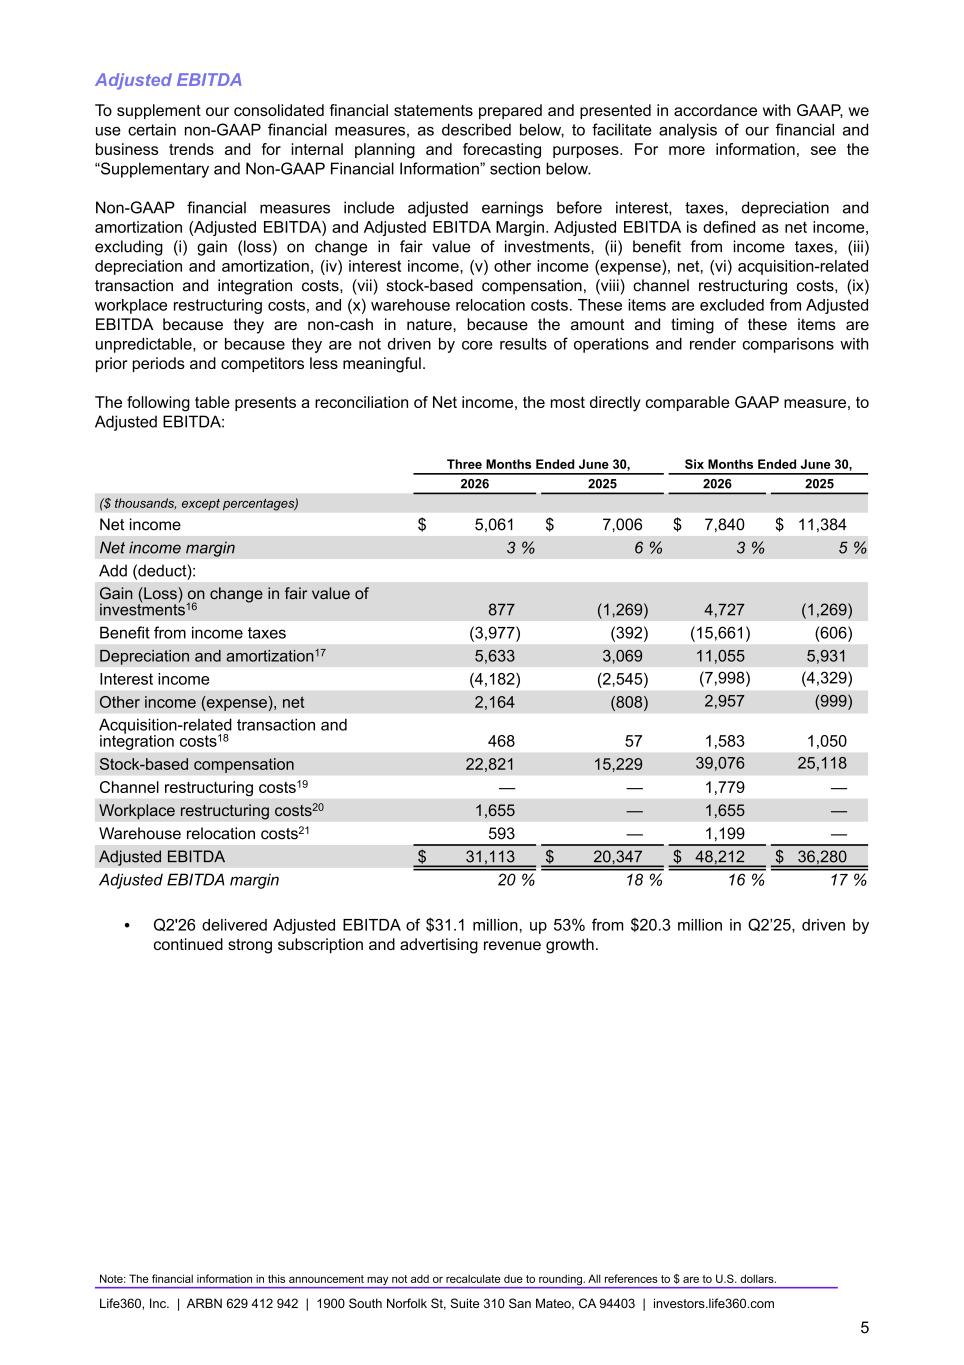
Adjusted EBITDA To supplement our consolidated financial statements prepared and presented in accordance with GAAP, we use certain non-GAAP financial measures, as described below, to facilitate analysis of our financial and business trends and for internal planning and forecasting purposes. For more information, see the “Supplementary and Non-GAAP Financial Information” section below. Non-GAAP financial measures include adjusted earnings before interest, taxes, depreciation and amortization (Adjusted EBITDA) and Adjusted EBITDA Margin. Adjusted EBITDA is defined as net income, excluding (i) gain (loss) on change in fair value of investments, (ii) benefit from income taxes, (iii) depreciation and amortization, (iv) interest income, (v) other income (expense), net, (vi) acquisition-related transaction and integration costs, (vii) stock-based compensation, (viii) channel restructuring costs, (ix) workplace restructuring costs, and (x) warehouse relocation costs. These items are excluded from Adjusted EBITDA because they are non-cash in nature, because the amount and timing of these items are unpredictable, or because they are not driven by core results of operations and render comparisons with prior periods and competitors less meaningful. The following table presents a reconciliation of Net income, the most directly comparable GAAP measure, to Adjusted EBITDA: Three Months Ended June 30, Six Months Ended June 30, 2026 2025 2026 2025 ($ thousands, except percentages) Net income $ 5,061 $ 7,006 $ 7,840 $ 11,384 Net income margin 3 % 6 % 3 % 5 % Add (deduct): Gain (Loss) on change in fair value of investments16 877 (1,269) 4,727 (1,269) Benefit from income taxes (3,977) (392) (15,661) (606) Depreciation and amortization17 5,633 3,069 11,055 5,931 Interest income (4,182) (2,545) (7,998) (4,329) Other income (expense), net 2,164 (808) 2,957 (999) Acquisition-related transaction and integration costs18 468 57 1,583 1,050 Stock-based compensation 22,821 15,229 39,076 25,118 Channel restructuring costs19 — — 1,779 — Workplace restructuring costs20 1,655 — 1,655 — Warehouse relocation costs21 593 — 1,199 — Adjusted EBITDA $ 31,113 $ 20,347 $ 48,212 $ 36,280 Adjusted EBITDA margin 20 % 18 % 16 % 17 % • Q2'26 delivered Adjusted EBITDA of $31.1 million, up 53% from $20.3 million in Q2’25, driven by continued strong subscription and advertising revenue growth. Note: The financial information in this announcement may not add or recalculate due to rounding. All references to $ are to U.S. dollars. Life360, Inc. | ARBN 629 412 942 | 1900 South Norfolk St, Suite 310 San Mateo, CA 94403 | investors.life360.com 5
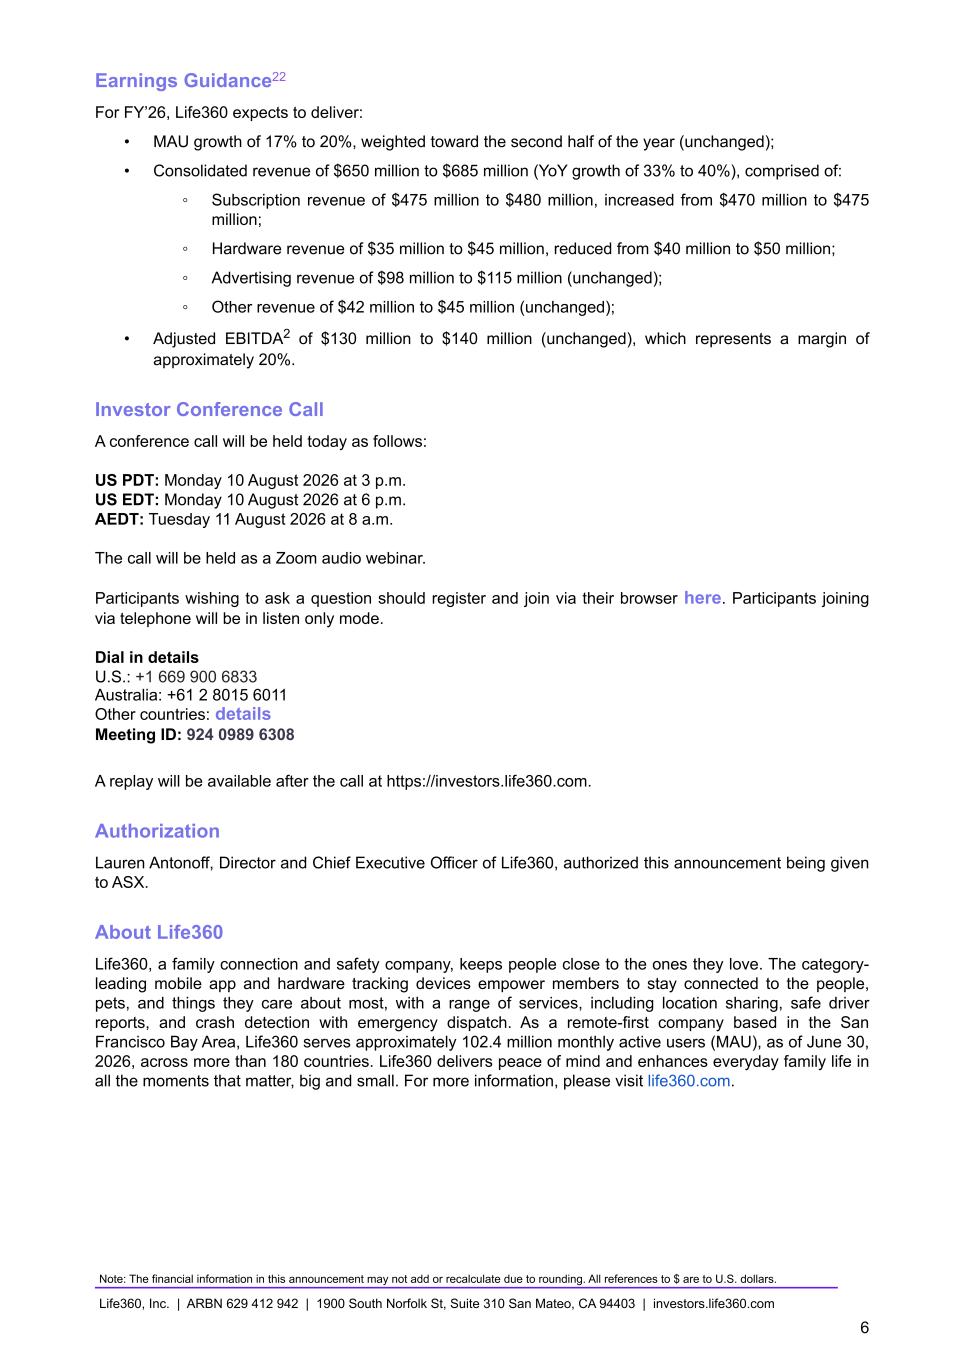
Earnings Guidance22 For FY’26, Life360 expects to deliver: • MAU growth of 17% to 20%, weighted toward the second half of the year (unchanged); • Consolidated revenue of $650 million to $685 million (YoY growth of 33% to 40%), comprised of: ◦ Subscription revenue of $475 million to $480 million, increased from $470 million to $475 million; ◦ Hardware revenue of $35 million to $45 million, reduced from $40 million to $50 million; ◦ Advertising revenue of $98 million to $115 million (unchanged); ◦ Other revenue of $42 million to $45 million (unchanged); • Adjusted EBITDA2 of $130 million to $140 million (unchanged), which represents a margin of approximately 20%. Investor Conference Call A conference call will be held today as follows: US PDT: Monday 10 August 2026 at 3 p.m. US EDT: Monday 10 August 2026 at 6 p.m. AEDT: Tuesday 11 August 2026 at 8 a.m. The call will be held as a Zoom audio webinar. Participants wishing to ask a question should register and join via their browser here. Participants joining via telephone will be in listen only mode. Dial in details U.S.: +1 669 900 6833 Australia: +61 2 8015 6011 Other countries: details Meeting ID: 924 0989 6308 A replay will be available after the call at https://investors.life360.com. Authorization Lauren Antonoff, Director and Chief Executive Officer of Life360, authorized this announcement being given to ASX. About Life360 Life360, a family connection and safety company, keeps people close to the ones they love. The category- leading mobile app and hardware tracking devices empower members to stay connected to the people, pets, and things they care about most, with a range of services, including location sharing, safe driver reports, and crash detection with emergency dispatch. As a remote-first company based in the San Francisco Bay Area, Life360 serves approximately 102.4 million monthly active users (MAU), as of June 30, 2026, across more than 180 countries. Life360 delivers peace of mind and enhances everyday family life in all the moments that matter, big and small. For more information, please visit life360.com. Note: The financial information in this announcement may not add or recalculate due to rounding. All references to $ are to U.S. dollars. Life360, Inc. | ARBN 629 412 942 | 1900 South Norfolk St, Suite 310 San Mateo, CA 94403 | investors.life360.com 6
Contacts For U.S. investor inquiries: For U.S. media inquiries: Raymond (RJ) Jones Lynnette Bruno rjones@life360.com press@life360.com For Australian investor inquiries: For Australian media inquiries: Jolanta Masojada, +61 417 261 367 Giles Rafferty, +61 481 467 903 jmasojada@life360.com grafferty@firstadvisers.com.au Forward-looking statements This announcement and the accompanying presentation and conference call contain forward-looking statements within the meaning of the Private Securities Litigation Reform Act of 1995. Life360 intends such forward-looking statements to be covered by the safe harbor provisions for forward-looking statements contained in Section 21E of the Securities Exchange Act of 1934, as amended. These forward-looking statements regarding Life360’s intentions, objectives, plans, expectations, assumptions and beliefs about future events, including Life360’s expectations with respect to the financial and operating performance of its business, including subscription revenue, hardware revenue, other revenue and consolidated revenue, ability to create new revenue streams, and margin expansion; the resiliency of Life360’s core subscription business; the ability of Life360 to adapt to and mitigate the impact of macroeconomic considerations including tariffs and trade barriers; its ability to deliver contextually relevant advertisements that enhance the user experience by leveraging its extensive first-party location data; Adjusted EBITDA, and operating cash flow; expectations regarding MAU and other member metrics; its capital position; future growth and market opportunities; plans to launch new features and products; the impact of price increases and expansion of product offerings in the UK, Australia, and New Zealand on future results of operations; its expectations of growth in its data business; its expectation of a new enterprise revenue stream and enhanced location capabilities of its hardware devices; its focus on developing a GPS lineup, built on Jiobit technology, the timing of new devices, and the potential for the next generation of hardware to drive a new wave of subscription growth; as well as Life360’s expectations of any changes to the information disclosed herein. The words “anticipate”, “believe”, “expect”, “project”, “predict”, “will”, “forecast”, “estimate”, “likely”, “intend”, “outlook”, “should”, “could”, “may”, “target”, “plan” and other similar expressions can generally be used to identify forward-looking statements. Indications of, and guidance or outlook on, future earnings or financial position or performance are also forward-looking statements. Investors and prospective investors are cautioned not to place undue reliance on these forward-looking statements as they involve inherent risk and uncertainty (both general and specific) and should note that they are provided as a general guide only and should not be relied on as an indication or guarantee of future performance. There is a risk that such predictions, forecasts, projections and other forward-looking statements will not be achieved. Subject to any continuing obligations under applicable law, Life360 does not undertake any obligation to publicly release the result of any revisions to these forward-looking statements to reflect events or circumstances after the date of this announcement, to reflect any change in expectations in relation to any forward- looking statements or any change in events, conditions or circumstances on which any such statements are based. Although Life360 believes that the expectations reflected in the forward-looking statements and the assumptions upon which they are based are reasonable, Life360 can give no assurance that such expectations and assumptions will prove to be correct and, actual results may vary in a materially positive or negative manner. Forward-looking statements are subject to known and unknown risks, uncertainty, assumptions and contingencies, many of which are outside Life360’s control, and are based on estimates and assumptions that are subject to change and may cause actual results, performance or achievements to differ materially from those expressed or implied by such statements. Factors that could cause actual results to differ materially from those in the forward-looking statements include risks related to the preliminary nature of financial results, risks related to Life360’s business, market risks, Life360’s need for additional capital, and the risk that Life360’s products and services may not perform as expected, as described in greater detail under the heading “Risk Factors” in Life360’s ASX and SEC filings, including, but not limited to, its Annual Report on Form 10-K and Quarterly Reports on Form 10-Q. To the maximum extent permitted by law, responsibility for the accuracy or completeness of any forward- looking statements whether as a result of new information, future events or results or otherwise is disclaimed. This announcement should not be relied upon as a recommendation or forecast by Life360. Past performance information in this document is given for illustrative purposes only and is not necessarily a guide to future performance and no representation or warranty is made by any person as to the likelihood of achievement or reasonableness of any forward-looking statements, forecast financial information, future share price performance or any underlying assumptions. Nothing contained in this document nor any information made available to you is, or shall be relied upon as, a promise, representation, warranty or guarantee as to the past, present or the future performance of Life360. Note: The financial information in this announcement may not add or recalculate due to rounding. All references to $ are to U.S. dollars. Life360, Inc. | ARBN 629 412 942 | 1900 South Norfolk St, Suite 310 San Mateo, CA 94403 | investors.life360.com 7
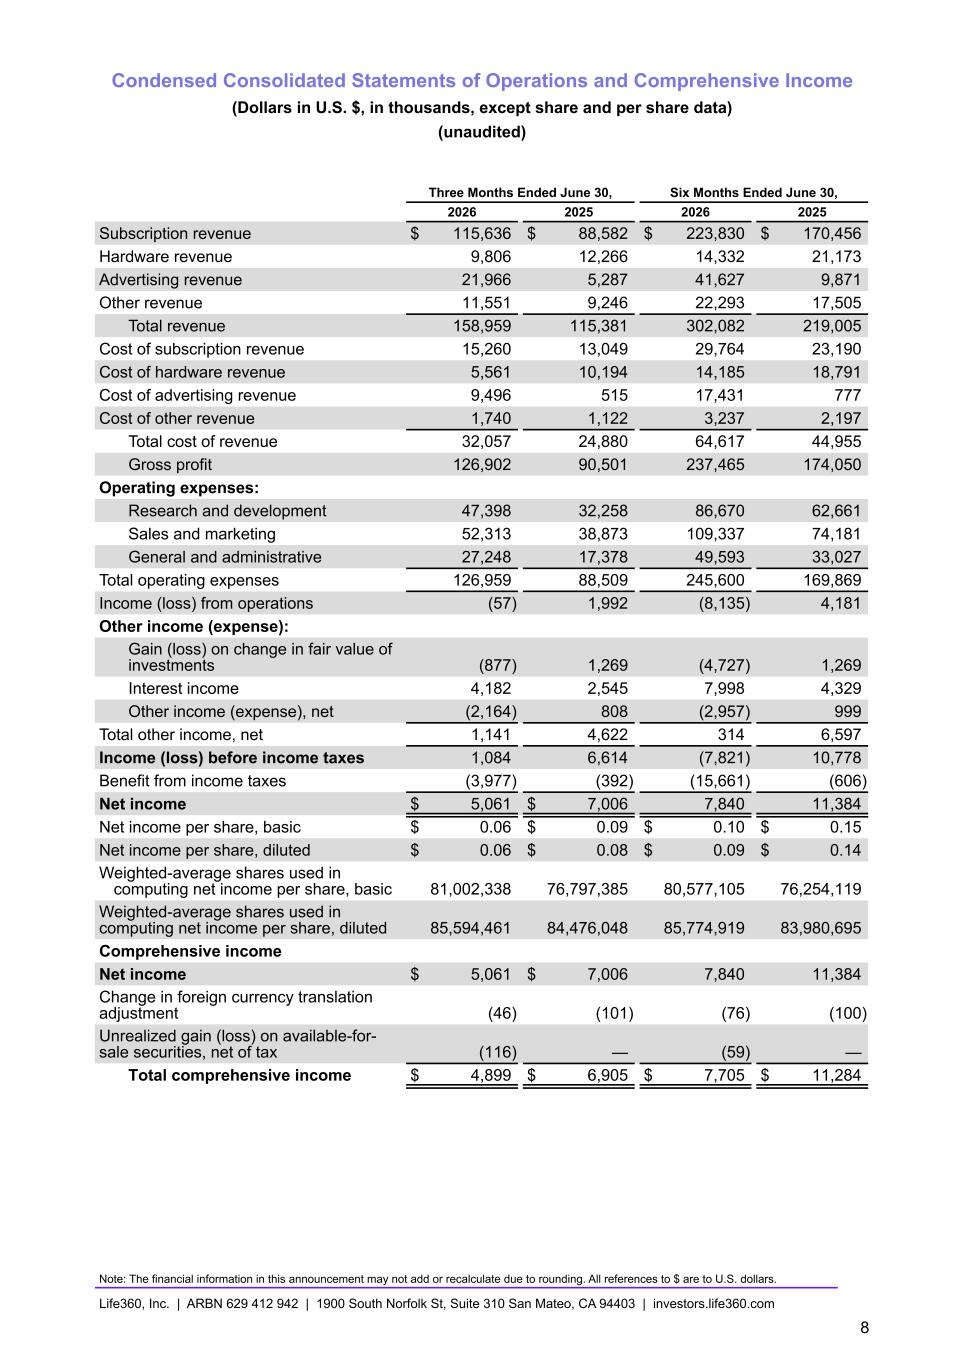
Condensed Consolidated Statements of Operations and Comprehensive Income (Dollars in U.S. $, in thousands, except share and per share data) (unaudited) Three Months Ended June 30, Six Months Ended June 30, 2026 2025 2026 2025 Subscription revenue $ 115,636 $ 88,582 $ 223,830 $ 170,456 Hardware revenue 9,806 12,266 14,332 21,173 Advertising revenue 21,966 5,287 41,627 9,871 Other revenue 11,551 9,246 22,293 17,505 Total revenue 158,959 115,381 302,082 219,005 Cost of subscription revenue 15,260 13,049 29,764 23,190 Cost of hardware revenue 5,561 10,194 14,185 18,791 Cost of advertising revenue 9,496 515 17,431 777 Cost of other revenue 1,740 1,122 3,237 2,197 Total cost of revenue 32,057 24,880 64,617 44,955 Gross profit 126,902 90,501 237,465 174,050 Operating expenses: Research and development 47,398 32,258 86,670 62,661 Sales and marketing 52,313 38,873 109,337 74,181 General and administrative 27,248 17,378 49,593 33,027 Total operating expenses 126,959 88,509 245,600 169,869 Income (loss) from operations (57) 1,992 (8,135) 4,181 Other income (expense): Gain (loss) on change in fair value of investments (877) 1,269 (4,727) 1,269 Interest income 4,182 2,545 7,998 4,329 Other income (expense), net (2,164) 808 (2,957) 999 Total other income, net 1,141 4,622 314 6,597 Income (loss) before income taxes 1,084 6,614 (7,821) 10,778 Benefit from income taxes (3,977) (392) (15,661) (606) Net income $ 5,061 $ 7,006 7,840 11,384 Net income per share, basic $ 0.06 $ 0.09 $ 0.10 $ 0.15 Net income per share, diluted $ 0.06 $ 0.08 $ 0.09 $ 0.14 Weighted-average shares used in computing net income per share, basic 81,002,338 76,797,385 80,577,105 76,254,119 Weighted-average shares used in computing net income per share, diluted 85,594,461 84,476,048 85,774,919 83,980,695 Comprehensive income Net income $ 5,061 $ 7,006 7,840 11,384 Change in foreign currency translation adjustment (46) (101) (76) (100) Unrealized gain (loss) on available-for- sale securities, net of tax (116) — (59) — Total comprehensive income $ 4,899 $ 6,905 $ 7,705 $ 11,284 Note: The financial information in this announcement may not add or recalculate due to rounding. All references to $ are to U.S. dollars. Life360, Inc. | ARBN 629 412 942 | 1900 South Norfolk St, Suite 310 San Mateo, CA 94403 | investors.life360.com 8
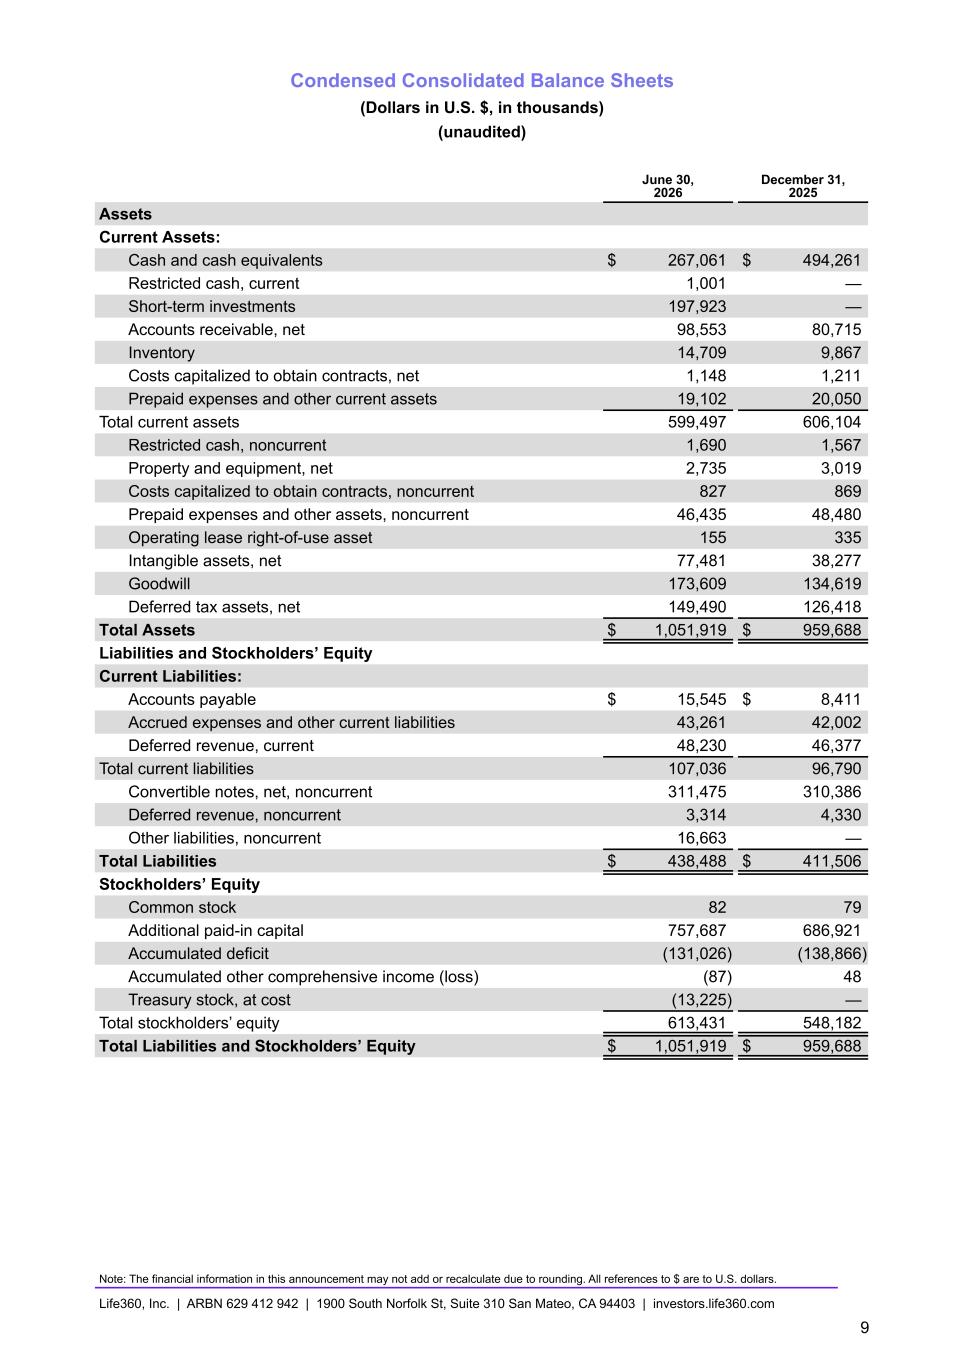
Condensed Consolidated Balance Sheets (Dollars in U.S. $, in thousands) (unaudited) June 30, 2026 December 31, 2025 Assets Current Assets: Cash and cash equivalents $ 267,061 $ 494,261 Restricted cash, current 1,001 — Short-term investments 197,923 — Accounts receivable, net 98,553 80,715 Inventory 14,709 9,867 Costs capitalized to obtain contracts, net 1,148 1,211 Prepaid expenses and other current assets 19,102 20,050 Total current assets 599,497 606,104 Restricted cash, noncurrent 1,690 1,567 Property and equipment, net 2,735 3,019 Costs capitalized to obtain contracts, noncurrent 827 869 Prepaid expenses and other assets, noncurrent 46,435 48,480 Operating lease right-of-use asset 155 335 Intangible assets, net 77,481 38,277 Goodwill 173,609 134,619 Deferred tax assets, net 149,490 126,418 Total Assets $ 1,051,919 $ 959,688 Liabilities and Stockholders’ Equity Current Liabilities: Accounts payable $ 15,545 $ 8,411 Accrued expenses and other current liabilities 43,261 42,002 Deferred revenue, current 48,230 46,377 Total current liabilities 107,036 96,790 Convertible notes, net, noncurrent 311,475 310,386 Deferred revenue, noncurrent 3,314 4,330 Other liabilities, noncurrent 16,663 — Total Liabilities $ 438,488 $ 411,506 Stockholders’ Equity Common stock 82 79 Additional paid-in capital 757,687 686,921 Accumulated deficit (131,026) (138,866) Accumulated other comprehensive income (loss) (87) 48 Treasury stock, at cost (13,225) — Total stockholders’ equity 613,431 548,182 Total Liabilities and Stockholders’ Equity $ 1,051,919 $ 959,688 Note: The financial information in this announcement may not add or recalculate due to rounding. All references to $ are to U.S. dollars. Life360, Inc. | ARBN 629 412 942 | 1900 South Norfolk St, Suite 310 San Mateo, CA 94403 | investors.life360.com 9
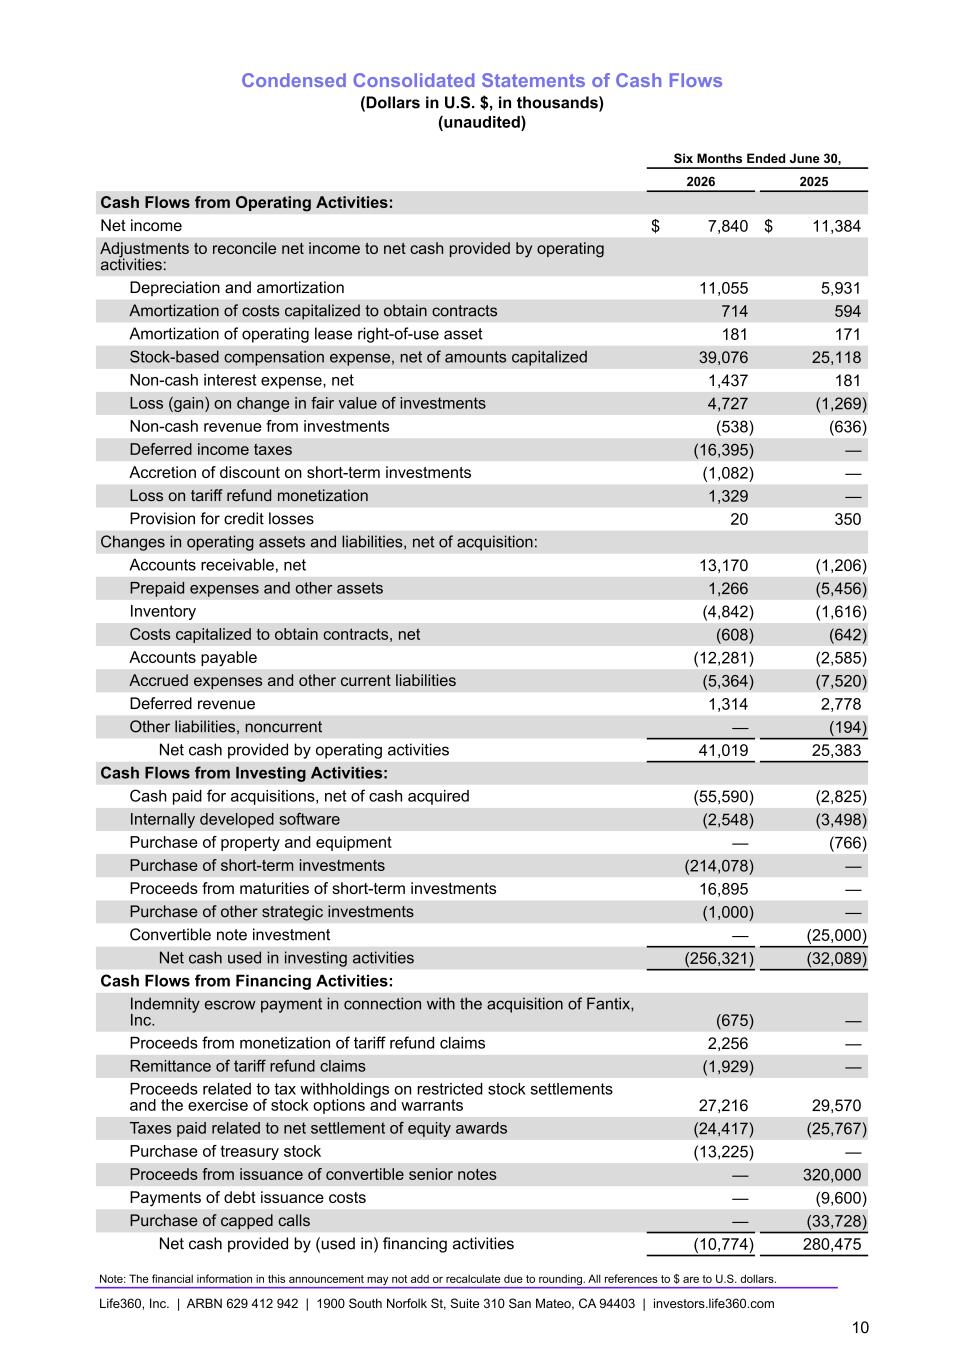
Condensed Consolidated Statements of Cash Flows (Dollars in U.S. $, in thousands) (unaudited) Six Months Ended June 30, 2026 2025 Cash Flows from Operating Activities: Net income $ 7,840 $ 11,384 Adjustments to reconcile net income to net cash provided by operating activities: Depreciation and amortization 11,055 5,931 Amortization of costs capitalized to obtain contracts 714 594 Amortization of operating lease right-of-use asset 181 171 Stock-based compensation expense, net of amounts capitalized 39,076 25,118 Non-cash interest expense, net 1,437 181 Loss (gain) on change in fair value of investments 4,727 (1,269) Non-cash revenue from investments (538) (636) Deferred income taxes (16,395) — Accretion of discount on short-term investments (1,082) — Loss on tariff refund monetization 1,329 — Provision for credit losses 20 350 Changes in operating assets and liabilities, net of acquisition: Accounts receivable, net 13,170 (1,206) Prepaid expenses and other assets 1,266 (5,456) Inventory (4,842) (1,616) Costs capitalized to obtain contracts, net (608) (642) Accounts payable (12,281) (2,585) Accrued expenses and other current liabilities (5,364) (7,520) Deferred revenue 1,314 2,778 Other liabilities, noncurrent — (194) Net cash provided by operating activities 41,019 25,383 Cash Flows from Investing Activities: Cash paid for acquisitions, net of cash acquired (55,590) (2,825) Internally developed software (2,548) (3,498) Purchase of property and equipment — (766) Purchase of short-term investments (214,078) — Proceeds from maturities of short-term investments 16,895 — Purchase of other strategic investments (1,000) — Convertible note investment — (25,000) Net cash used in investing activities (256,321) (32,089) Cash Flows from Financing Activities: Indemnity escrow payment in connection with the acquisition of Fantix, Inc. (675) — Proceeds from monetization of tariff refund claims 2,256 — Remittance of tariff refund claims (1,929) — Proceeds related to tax withholdings on restricted stock settlements and the exercise of stock options and warrants 27,216 29,570 Taxes paid related to net settlement of equity awards (24,417) (25,767) Purchase of treasury stock (13,225) — Proceeds from issuance of convertible senior notes — 320,000 Payments of debt issuance costs — (9,600) Purchase of capped calls — (33,728) Net cash provided by (used in) financing activities (10,774) 280,475 Note: The financial information in this announcement may not add or recalculate due to rounding. All references to $ are to U.S. dollars. Life360, Inc. | ARBN 629 412 942 | 1900 South Norfolk St, Suite 310 San Mateo, CA 94403 | investors.life360.com 10
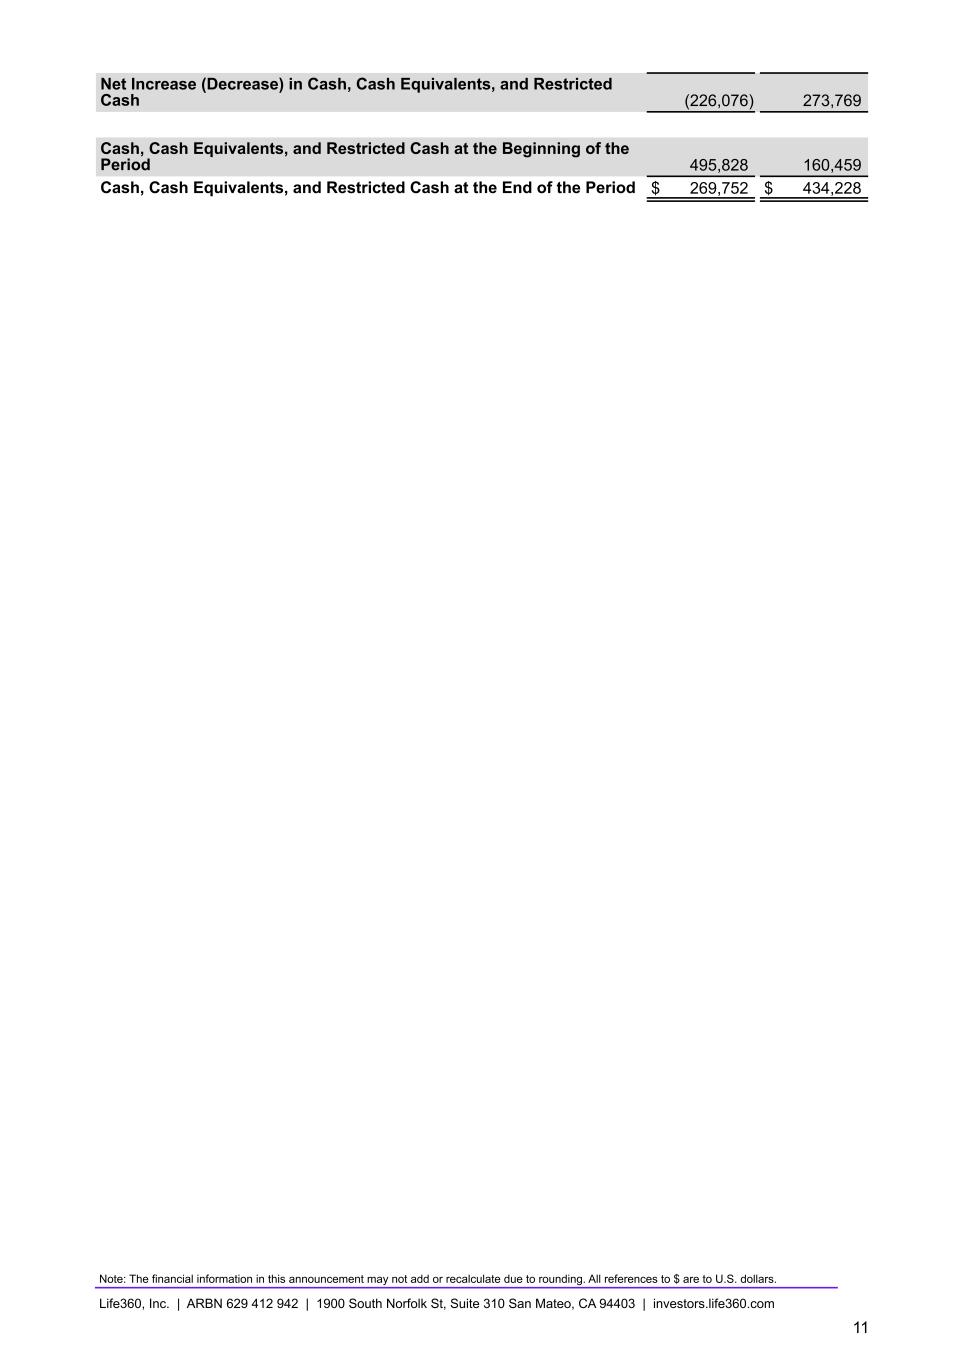
Net Increase (Decrease) in Cash, Cash Equivalents, and Restricted Cash (226,076) 273,769 Cash, Cash Equivalents, and Restricted Cash at the Beginning of the Period 495,828 160,459 Cash, Cash Equivalents, and Restricted Cash at the End of the Period $ 269,752 $ 434,228 Note: The financial information in this announcement may not add or recalculate due to rounding. All references to $ are to U.S. dollars. Life360, Inc. | ARBN 629 412 942 | 1900 South Norfolk St, Suite 310 San Mateo, CA 94403 | investors.life360.com 11
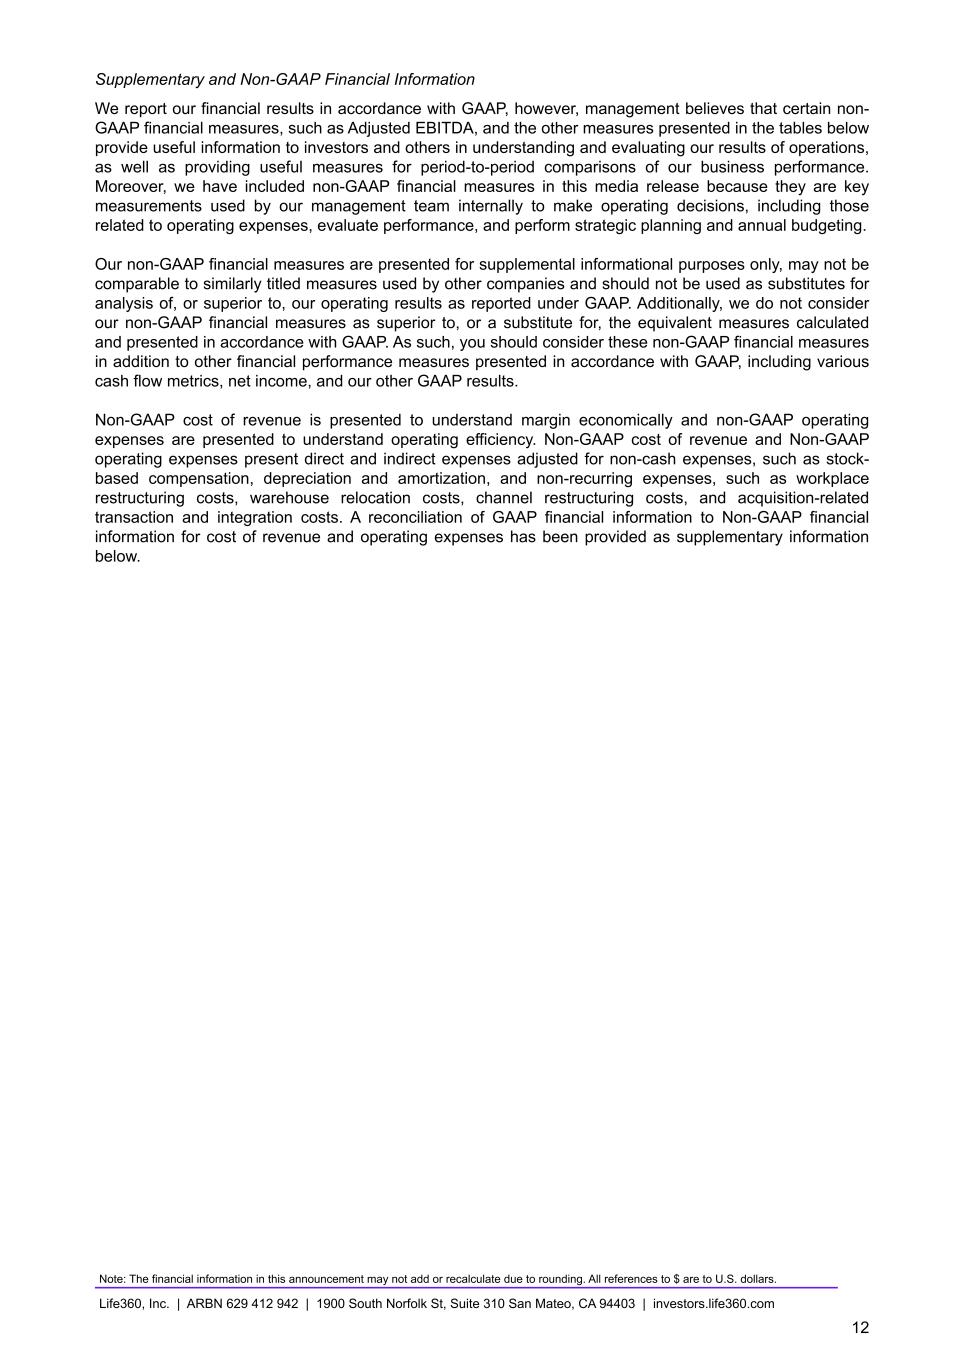
Supplementary and Non-GAAP Financial Information We report our financial results in accordance with GAAP, however, management believes that certain non- GAAP financial measures, such as Adjusted EBITDA, and the other measures presented in the tables below provide useful information to investors and others in understanding and evaluating our results of operations, as well as providing useful measures for period-to-period comparisons of our business performance. Moreover, we have included non-GAAP financial measures in this media release because they are key measurements used by our management team internally to make operating decisions, including those related to operating expenses, evaluate performance, and perform strategic planning and annual budgeting. Our non-GAAP financial measures are presented for supplemental informational purposes only, may not be comparable to similarly titled measures used by other companies and should not be used as substitutes for analysis of, or superior to, our operating results as reported under GAAP. Additionally, we do not consider our non-GAAP financial measures as superior to, or a substitute for, the equivalent measures calculated and presented in accordance with GAAP. As such, you should consider these non-GAAP financial measures in addition to other financial performance measures presented in accordance with GAAP, including various cash flow metrics, net income, and our other GAAP results. Non-GAAP cost of revenue is presented to understand margin economically and non-GAAP operating expenses are presented to understand operating efficiency. Non-GAAP cost of revenue and Non-GAAP operating expenses present direct and indirect expenses adjusted for non-cash expenses, such as stock- based compensation, depreciation and amortization, and non-recurring expenses, such as workplace restructuring costs, warehouse relocation costs, channel restructuring costs, and acquisition-related transaction and integration costs. A reconciliation of GAAP financial information to Non-GAAP financial information for cost of revenue and operating expenses has been provided as supplementary information below. Note: The financial information in this announcement may not add or recalculate due to rounding. All references to $ are to U.S. dollars. Life360, Inc. | ARBN 629 412 942 | 1900 South Norfolk St, Suite 310 San Mateo, CA 94403 | investors.life360.com 12
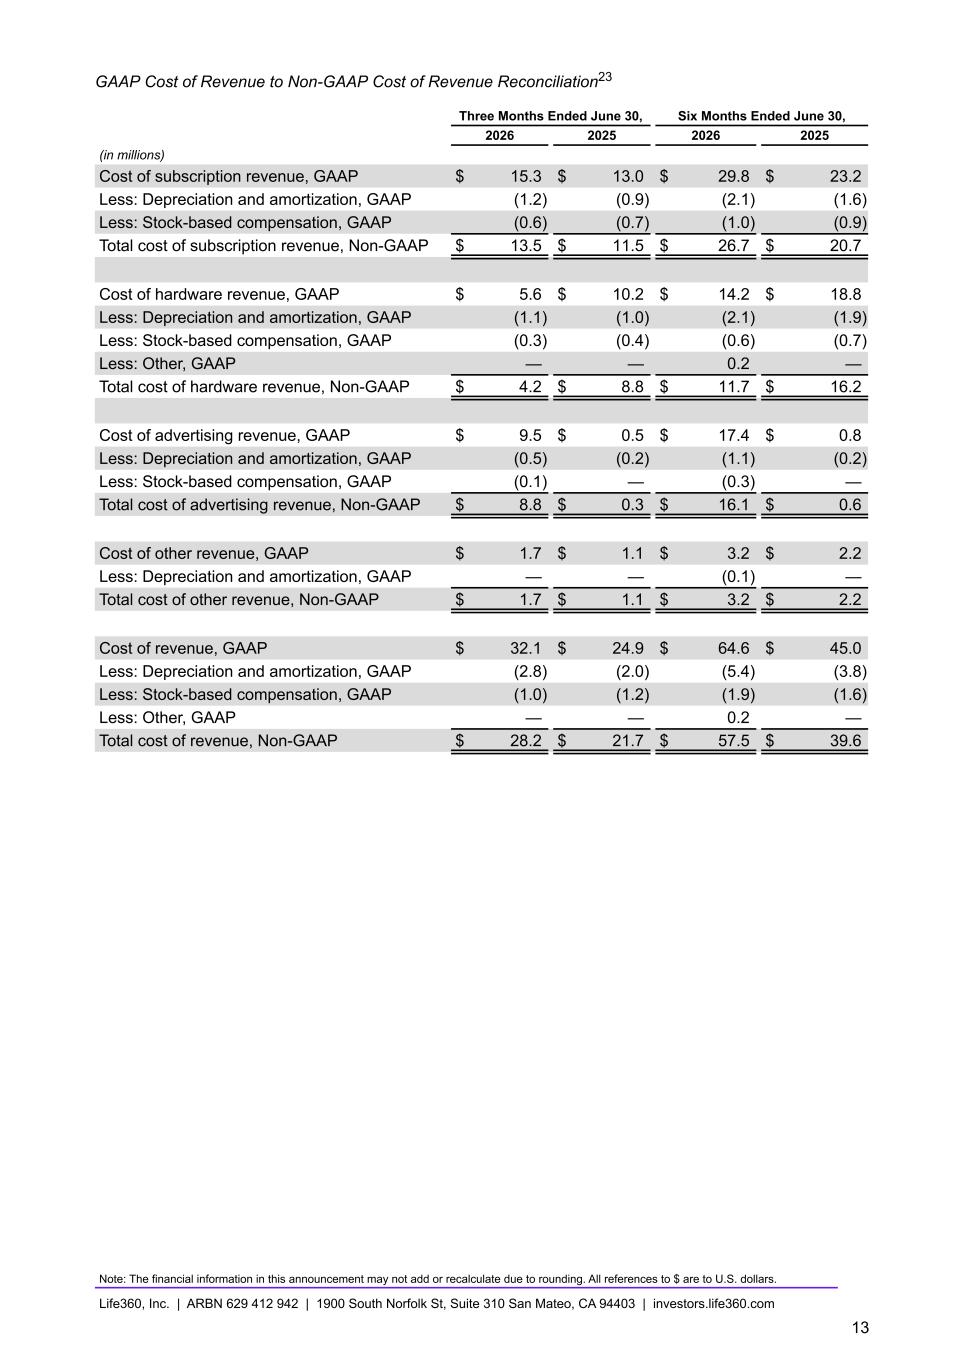
GAAP Cost of Revenue to Non-GAAP Cost of Revenue Reconciliation23 Three Months Ended June 30, Six Months Ended June 30, 2026 2025 2026 2025 (in millions) Cost of subscription revenue, GAAP $ 15.3 $ 13.0 $ 29.8 $ 23.2 Less: Depreciation and amortization, GAAP (1.2) (0.9) (2.1) (1.6) Less: Stock-based compensation, GAAP (0.6) (0.7) (1.0) (0.9) Total cost of subscription revenue, Non-GAAP $ 13.5 $ 11.5 $ 26.7 $ 20.7 Cost of hardware revenue, GAAP $ 5.6 $ 10.2 $ 14.2 $ 18.8 Less: Depreciation and amortization, GAAP (1.1) (1.0) (2.1) (1.9) Less: Stock-based compensation, GAAP (0.3) (0.4) (0.6) (0.7) Less: Other, GAAP — — 0.2 — Total cost of hardware revenue, Non-GAAP $ 4.2 $ 8.8 $ 11.7 $ 16.2 Cost of advertising revenue, GAAP $ 9.5 $ 0.5 $ 17.4 $ 0.8 Less: Depreciation and amortization, GAAP (0.5) (0.2) (1.1) (0.2) Less: Stock-based compensation, GAAP (0.1) — (0.3) — Total cost of advertising revenue, Non-GAAP $ 8.8 $ 0.3 $ 16.1 $ 0.6 Cost of other revenue, GAAP $ 1.7 $ 1.1 $ 3.2 $ 2.2 Less: Depreciation and amortization, GAAP — — (0.1) — Total cost of other revenue, Non-GAAP $ 1.7 $ 1.1 $ 3.2 $ 2.2 Cost of revenue, GAAP $ 32.1 $ 24.9 $ 64.6 $ 45.0 Less: Depreciation and amortization, GAAP (2.8) (2.0) (5.4) (3.8) Less: Stock-based compensation, GAAP (1.0) (1.2) (1.9) (1.6) Less: Other, GAAP — — 0.2 — Total cost of revenue, Non-GAAP $ 28.2 $ 21.7 $ 57.5 $ 39.6 Note: The financial information in this announcement may not add or recalculate due to rounding. All references to $ are to U.S. dollars. Life360, Inc. | ARBN 629 412 942 | 1900 South Norfolk St, Suite 310 San Mateo, CA 94403 | investors.life360.com 13
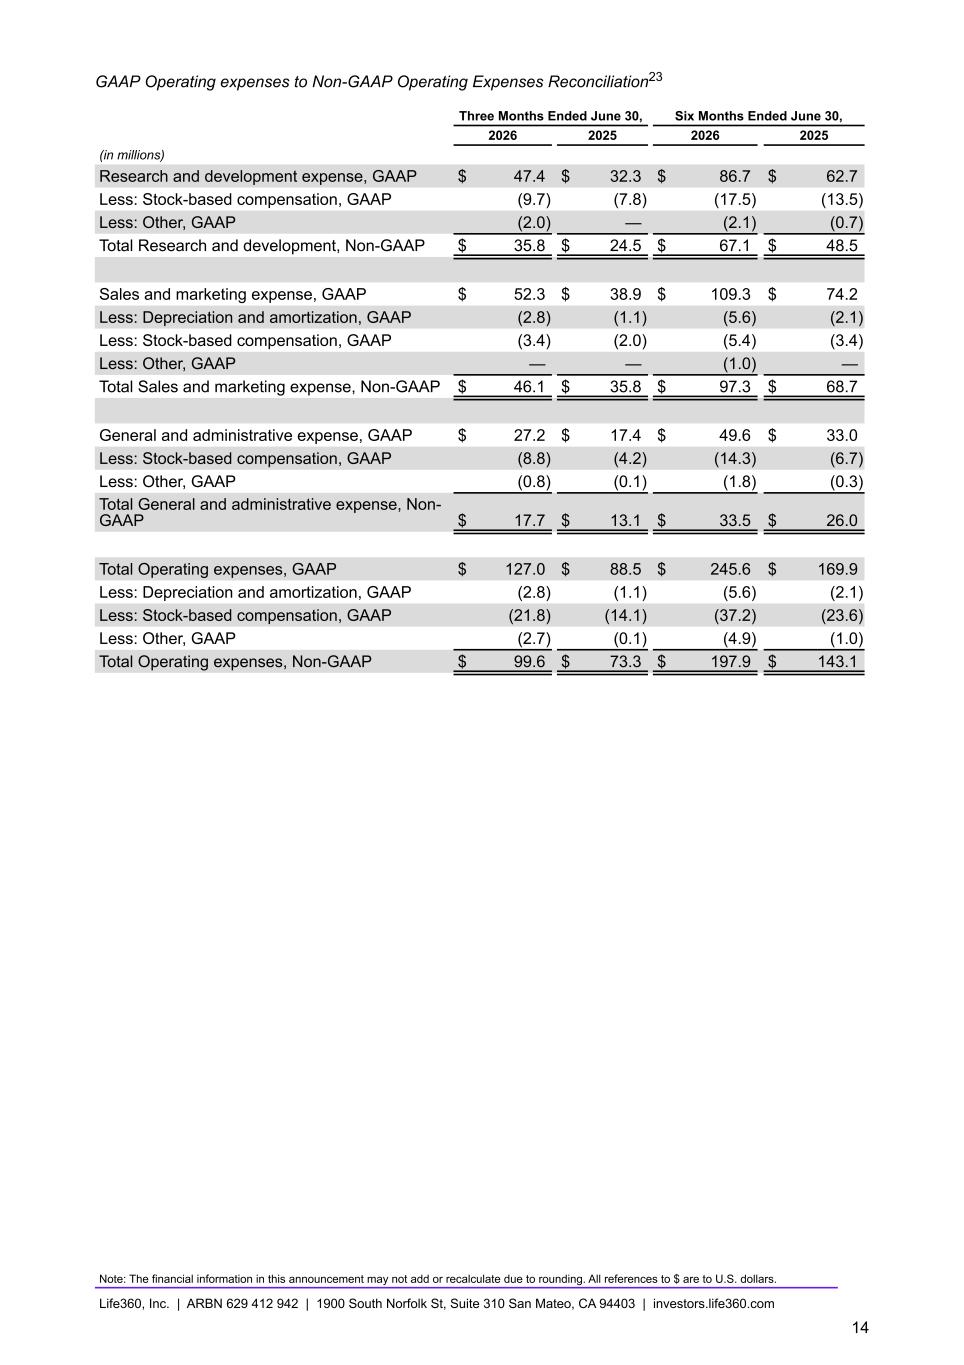
GAAP Operating expenses to Non-GAAP Operating Expenses Reconciliation23 Three Months Ended June 30, Six Months Ended June 30, 2026 2025 2026 2025 (in millions) Research and development expense, GAAP $ 47.4 $ 32.3 $ 86.7 $ 62.7 Less: Stock-based compensation, GAAP (9.7) (7.8) (17.5) (13.5) Less: Other, GAAP (2.0) — (2.1) (0.7) Total Research and development, Non-GAAP $ 35.8 $ 24.5 $ 67.1 $ 48.5 Sales and marketing expense, GAAP $ 52.3 $ 38.9 $ 109.3 $ 74.2 Less: Depreciation and amortization, GAAP (2.8) (1.1) (5.6) (2.1) Less: Stock-based compensation, GAAP (3.4) (2.0) (5.4) (3.4) Less: Other, GAAP — — (1.0) — Total Sales and marketing expense, Non-GAAP $ 46.1 $ 35.8 $ 97.3 $ 68.7 General and administrative expense, GAAP $ 27.2 $ 17.4 $ 49.6 $ 33.0 Less: Stock-based compensation, GAAP (8.8) (4.2) (14.3) (6.7) Less: Other, GAAP (0.8) (0.1) (1.8) (0.3) Total General and administrative expense, Non- GAAP $ 17.7 $ 13.1 $ 33.5 $ 26.0 Total Operating expenses, GAAP $ 127.0 $ 88.5 $ 245.6 $ 169.9 Less: Depreciation and amortization, GAAP (2.8) (1.1) (5.6) (2.1) Less: Stock-based compensation, GAAP (21.8) (14.1) (37.2) (23.6) Less: Other, GAAP (2.7) (0.1) (4.9) (1.0) Total Operating expenses, Non-GAAP $ 99.6 $ 73.3 $ 197.9 $ 143.1 Note: The financial information in this announcement may not add or recalculate due to rounding. All references to $ are to U.S. dollars. Life360, Inc. | ARBN 629 412 942 | 1900 South Norfolk St, Suite 310 San Mateo, CA 94403 | investors.life360.com 14
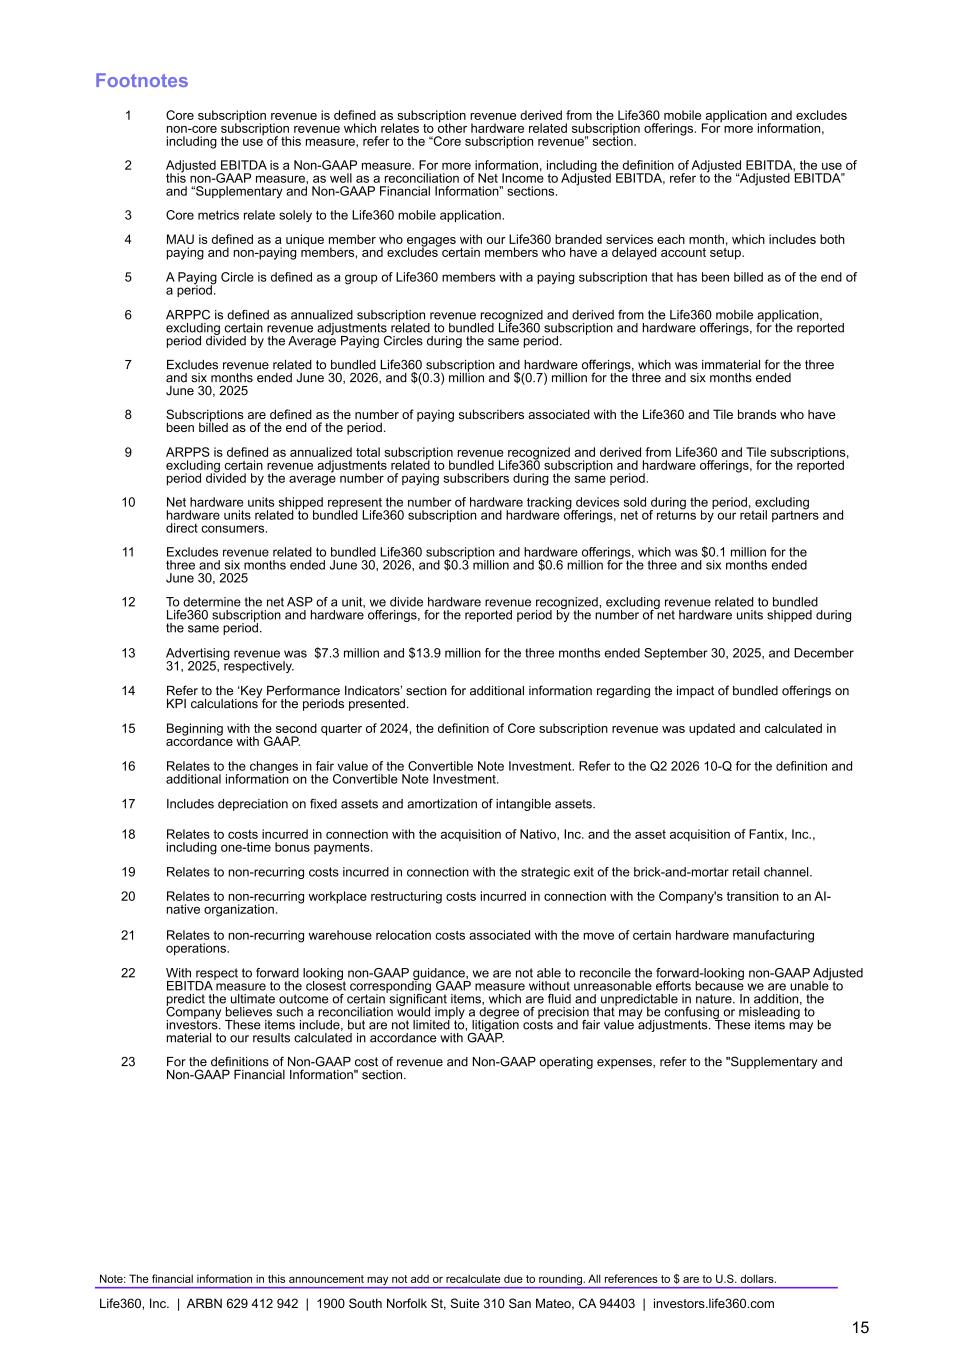
Footnotes 1 Core subscription revenue is defined as subscription revenue derived from the Life360 mobile application and excludes non-core subscription revenue which relates to other hardware related subscription offerings. For more information, including the use of this measure, refer to the “Core subscription revenue” section. 2 Adjusted EBITDA is a Non-GAAP measure. For more information, including the definition of Adjusted EBITDA, the use of this non-GAAP measure, as well as a reconciliation of Net Income to Adjusted EBITDA, refer to the “Adjusted EBITDA” and “Supplementary and Non-GAAP Financial Information” sections. 3 Core metrics relate solely to the Life360 mobile application. 4 MAU is defined as a unique member who engages with our Life360 branded services each month, which includes both paying and non-paying members, and excludes certain members who have a delayed account setup. 5 A Paying Circle is defined as a group of Life360 members with a paying subscription that has been billed as of the end of a period. 6 ARPPC is defined as annualized subscription revenue recognized and derived from the Life360 mobile application, excluding certain revenue adjustments related to bundled Life360 subscription and hardware offerings, for the reported period divided by the Average Paying Circles during the same period. 7 Excludes revenue related to bundled Life360 subscription and hardware offerings, which was immaterial for the three and six months ended June 30, 2026, and $(0.3) million and $(0.7) million for the three and six months ended June 30, 2025 8 Subscriptions are defined as the number of paying subscribers associated with the Life360 and Tile brands who have been billed as of the end of the period. 9 ARPPS is defined as annualized total subscription revenue recognized and derived from Life360 and Tile subscriptions, excluding certain revenue adjustments related to bundled Life360 subscription and hardware offerings, for the reported period divided by the average number of paying subscribers during the same period. 10 Net hardware units shipped represent the number of hardware tracking devices sold during the period, excluding hardware units related to bundled Life360 subscription and hardware offerings, net of returns by our retail partners and direct consumers. 11 Excludes revenue related to bundled Life360 subscription and hardware offerings, which was $0.1 million for the three and six months ended June 30, 2026, and $0.3 million and $0.6 million for the three and six months ended June 30, 2025 12 To determine the net ASP of a unit, we divide hardware revenue recognized, excluding revenue related to bundled Life360 subscription and hardware offerings, for the reported period by the number of net hardware units shipped during the same period. 13 Advertising revenue was $7.3 million and $13.9 million for the three months ended September 30, 2025, and December 31, 2025, respectively. 14 Refer to the ‘Key Performance Indicators’ section for additional information regarding the impact of bundled offerings on KPI calculations for the periods presented. 15 Beginning with the second quarter of 2024, the definition of Core subscription revenue was updated and calculated in accordance with GAAP. 16 Relates to the changes in fair value of the Convertible Note Investment. Refer to the Q2 2026 10-Q for the definition and additional information on the Convertible Note Investment. 17 Includes depreciation on fixed assets and amortization of intangible assets. 18 Relates to costs incurred in connection with the acquisition of Nativo, Inc. and the asset acquisition of Fantix, Inc., including one-time bonus payments. 19 Relates to non-recurring costs incurred in connection with the strategic exit of the brick-and-mortar retail channel. 20 Relates to non-recurring workplace restructuring costs incurred in connection with the Company's transition to an AI- native organization. 21 Relates to non-recurring warehouse relocation costs associated with the move of certain hardware manufacturing operations. 22 With respect to forward looking non-GAAP guidance, we are not able to reconcile the forward-looking non-GAAP Adjusted EBITDA measure to the closest corresponding GAAP measure without unreasonable efforts because we are unable to predict the ultimate outcome of certain significant items, which are fluid and unpredictable in nature. In addition, the Company believes such a reconciliation would imply a degree of precision that may be confusing or misleading to investors. These items include, but are not limited to, litigation costs and fair value adjustments. These items may be material to our results calculated in accordance with GAAP. 23 For the definitions of Non-GAAP cost of revenue and Non-GAAP operating expenses, refer to the "Supplementary and Non-GAAP Financial Information" section. Note: The financial information in this announcement may not add or recalculate due to rounding. All references to $ are to U.S. dollars. Life360, Inc. | ARBN 629 412 942 | 1900 South Norfolk St, Suite 310 San Mateo, CA 94403 | investors.life360.com 15

Shareholder Letter August 10, 2026 U.S. PT August 11, 2026 AEST
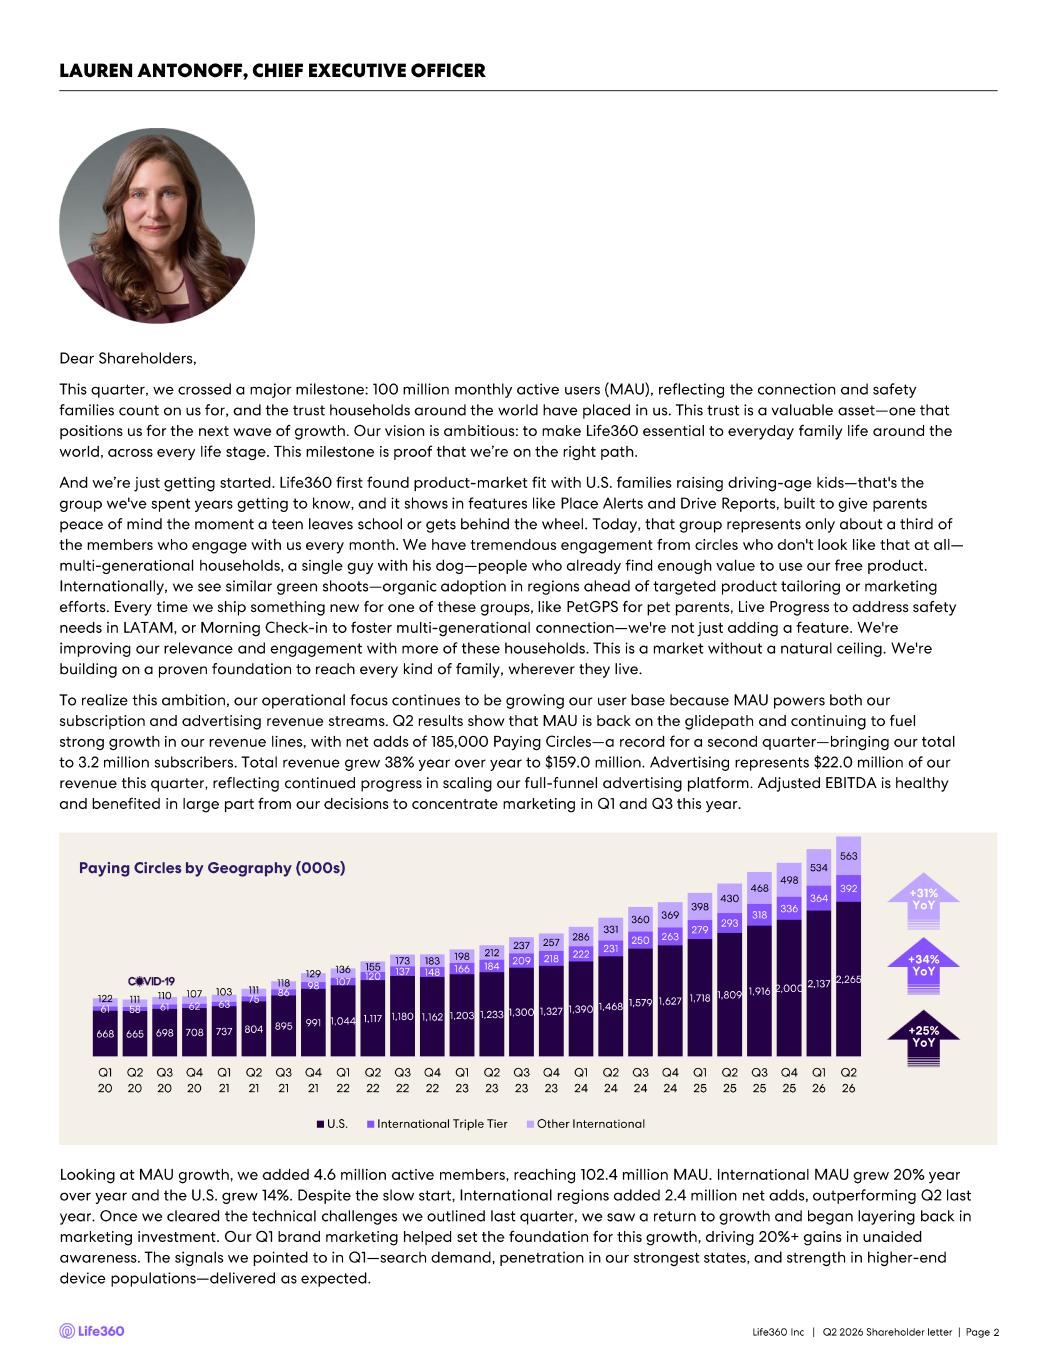
668 665 698 708 737 804 895 991 1,044 1,117 1,180 1,162 1,203 1,233 1,300 1,327 1,390 1,468 1,579 1,627 1,718 1,809 1,916 2,000 2,137 2,265 61 58 61 62 63 75 86 98 107 120 137 148 166 184 209 218 222 231 250 263 279 293 318 336 364 392 122 111 110 107 103 111 118 129 136 155 173 183 198 212 237 257 286 331 360 369 398 430 468 498 534 563 Q1 20 Q2 20 Q3 20 Q4 20 Q1 21 Q2 21 Q3 21 Q4 21 Q1 22 Q2 22 Q3 22 Q4 22 Q1 23 Q2 23 Q3 23 Q4 23 Q1 24 Q2 24 Q3 24 Q4 24 Q1 25 Q2 25 Q3 25 Q4 25 Q1 26 Q2 26 U.S. International Triple Tier Other International Dear Shareholders, This quarter, we crossed a major milestone: 100 million monthly active users (MAU), reflecting the connection and safety families count on us for, and the trust households around the world have placed in us. This trust is a valuable asset —one that positions us for the next wave of growth. Our vision is ambitious: to make Life360 essential to everyday family life around t he world, across every life stage. This milestone is proof that we’re on the right path. And we’re just getting started. Life360 first found product - market fit with U.S. families raising driving - age kids —that's the group we've spent years getting to know, and it shows in features like Place Alerts and Drive Reports, built to give parents peace of mind the moment a teen leaves school or gets behind the wheel. Today, that group represents only about a third of the members who engage with us every month. We have tremendous engagement from circles who don't look like that at all — multi - generational households, a single guy with his dog —people who already find enough value to use our free product. Internationally, we see similar green shoots —organic adoption in regions ahead of targeted product tailoring or marketing efforts. Every time we ship something new for one of these groups, like PetGPS for pet parents, Live Progress to address safety needs in LATAM, or Morning Check - in to foster multi - generational connection —we're not just adding a feature. We're improving our relevance and engagement with more of these households. This is a market without a natural ceiling. We're building on a proven foundation to reach every kind of family, wherever they live. To realize this ambition, our operational focus continues to be growing our user base because MAU powers both our subscription and advertising revenue streams. Q2 results show that MAU is back on the glidepath and continuing to fuel strong growth in our revenue lines, with net adds of 185,000 Paying Circles —a record for a second quarter —bringing our total to 3.2 million subscribers. Total revenue grew 38% year over year to $159.0 million. Advertising represents $22.0 million of our revenue this quarter, reflecting continued progress in scaling our full - funnel advertising platform. Adjusted EBITDA is healthy and benefited in large part from our decisions to concentrate marketing in Q1 and Q3 this year. Life360 Inc | Q2 2026 Shareholder letter | Page 2 LAUREN ANTONOFF, CHIEF EXECUTIVE OFFICER +34% YoY +25% YoY +31% YoY Paying Circles by Geography (000s) Looking at MAU growth, we added 4.6 million active members, reaching 102.4 million MAU. International MAU grew 20% year over year and the U.S. grew 14%. Despite the slow start, International regions added 2.4 million net adds, outperforming Q2 l ast year. Once we cleared the technical challenges we outlined last quarter, we saw a return to growth and began layering back in marketing investment. Our Q1 brand marketing helped set the foundation for this growth, driving 20%+ gains in unaided awareness. The signals we pointed to in Q1 —search demand, penetration in our strongest states, and strength in higher - end device populations —delivered as expected.
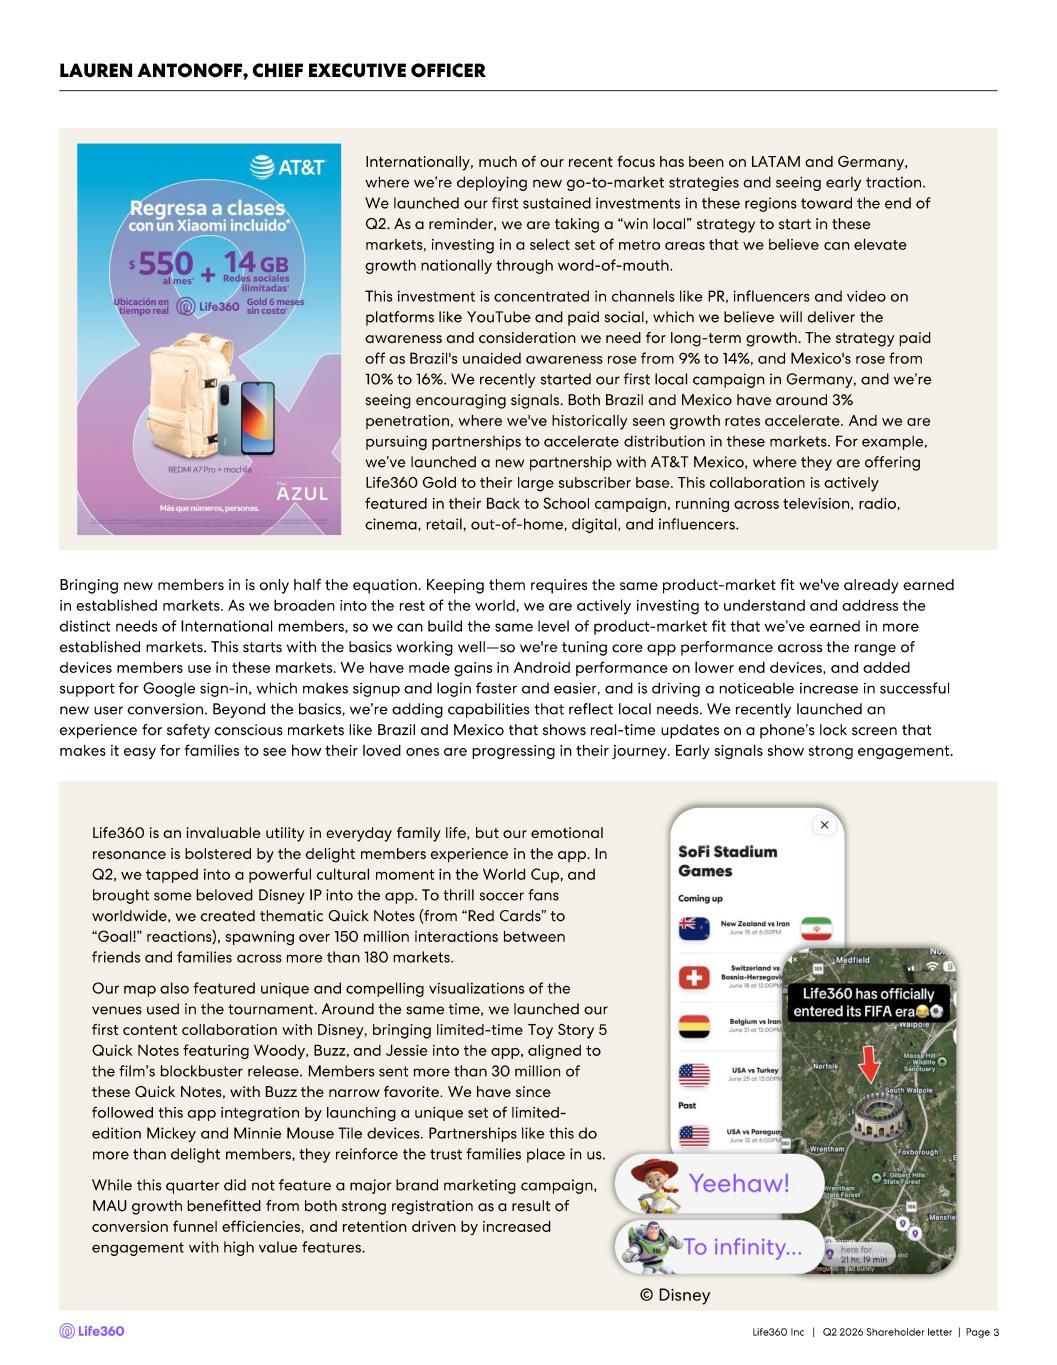
Internationally, much of our recent focus has been on LATAM and Germany, where we’re deploying new go - to- market strategies and seeing early traction. We launched our first sustained investments in these regions toward the end of Q2. As a reminder, we are taking a “win local” strategy to start in these markets, investing in a select set of metro areas that we believe can elevate growth nationally through word - of - mouth. This investment is concentrated in channels like PR, influencers and video on platforms like YouTube and paid social, which we believe will deliver the awareness and consideration we need for long - term growth. The strategy paid off as Brazil's unaided awareness rose from 9% to 14%, and Mexico's rose from 10% to 16%. We recently started our first local campaign in Germany, and we’re seeing encouraging signals. Both Brazil and Mexico have around 3% penetration, where we've historically seen growth rates accelerate. And we are pursuing partnerships to accelerate distribution in these markets. For example, we’ve launched a new partnership with AT&T Mexico, where they are offering Life360 Gold to their large subscriber base. This collaboration is actively featured in their Back to School campaign, running across television, radio, cinema, retail, out - of - home, digital, and influencers. 3 LAUREN ANTONOFF, CHIEF EXECUTIVE OFFICER Bringing new members in is only half the equation. Keeping them requires the same product - market fit we've already earned in established markets. As we broaden into the rest of the world, we are actively investing to understand and address the distinct needs of International members, so we can build the same level of product - market fit that we’ve earned in more established markets. This starts with the basics working well —so we're tuning core app performance across the range of devices members use in these markets. We have made gains in Android performance on lower end devices, and added support for Google sign - in, which makes signup and login faster and easier, and is driving a noticeable increase in successful new user conversion. Beyond the basics, we’re adding capabilities that reflect local needs. We recently launched an experience for safety conscious markets like Brazil and Mexico that shows real - time updates on a phone’s lock screen that makes it easy for families to see how their loved ones are progressing in their journey. Early signals show strong engagement . Life360 is an invaluable utility in everyday family life, but our emotional resonance is bolstered by the delight members experience in the app. In Q2, we tapped into a powerful cultural moment in the World Cup, and brought some beloved Disney IP into the app. To thrill soccer fans worldwide, we created thematic Quick Notes (from “Red Cards” to “Goal!” reactions), spawning over 150 million interactions between friends and families across more than 180 markets. Our map also featured unique and compelling visualizations of the venues used in the tournament. Around the same time, we launched our first content collaboration with Disney, bringing limited - time Toy Story 5 Quick Notes featuring Woody, Buzz, and Jessie into the app, aligned to the film’s blockbuster release. Members sent more than 30 million of these Quick Notes, with Buzz the narrow favorite. We have since followed this app integration by launching a unique set of limited - edition Mickey and Minnie Mouse Tile devices. Partnerships like this do more than delight members, they reinforce the trust families place in us. While this quarter did not feature a major brand marketing campaign, MAU growth benefitted from both strong registration as a result of conversion funnel efficiencies, and retention driven by increased engagement with high value features. © Disney Life360 Inc | Q2 2026 Shareholder letter | Page
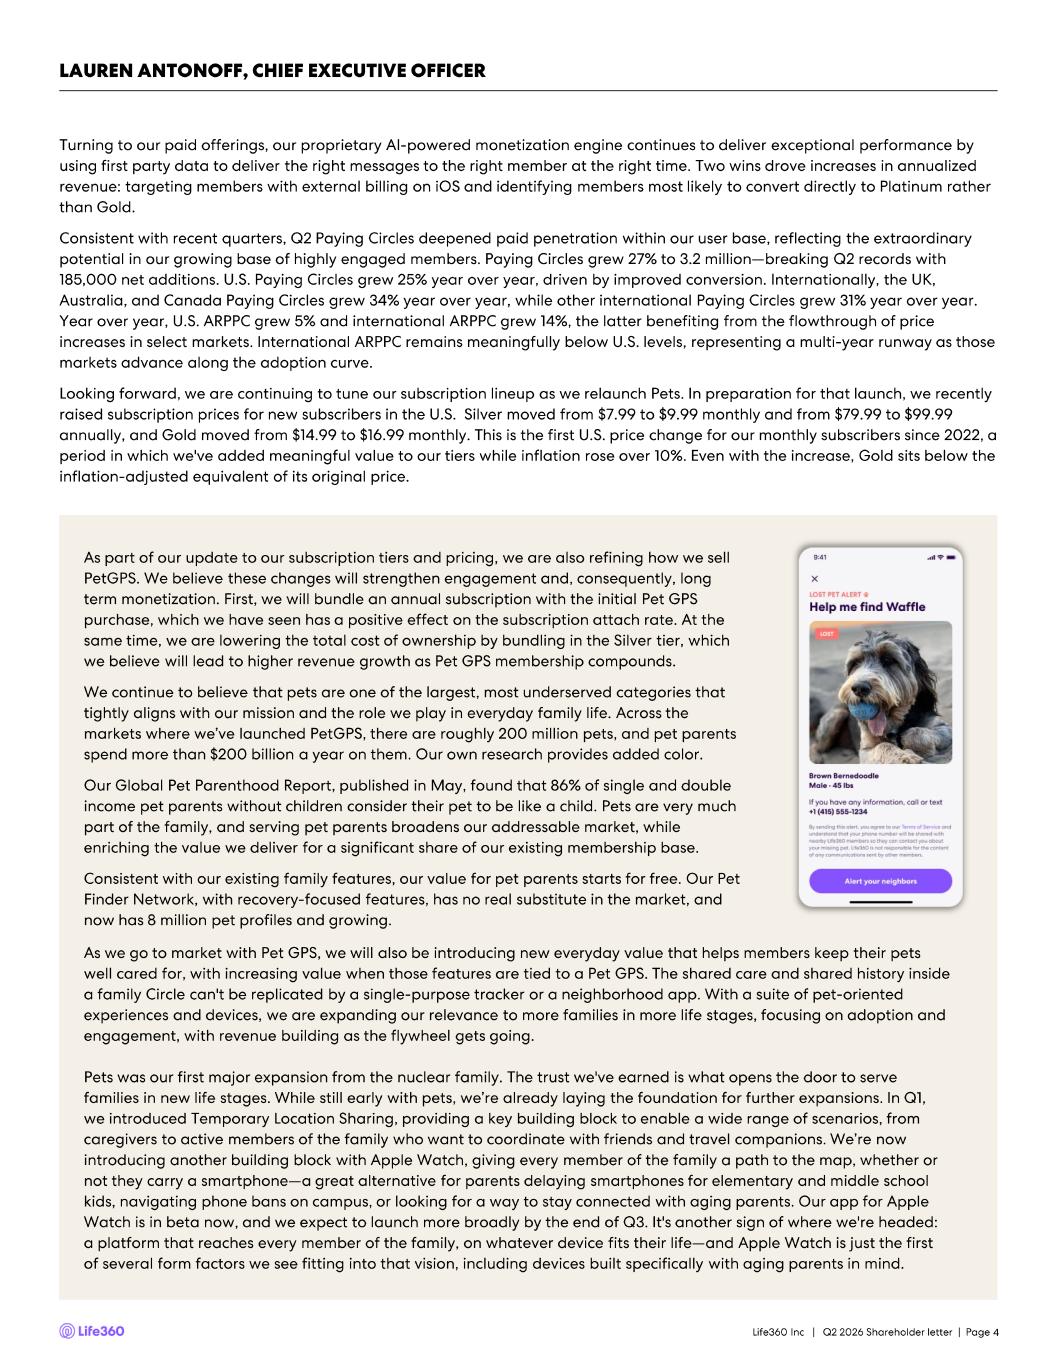
4 LAUREN ANTONOFF, CHIEF EXECUTIVE OFFICER Turning to our paid offerings, our proprietary AI - powered monetization engine continues to deliver exceptional performance by using first party data to deliver the right messages to the right member at the right time. Two wins drove increases in annua lized revenue: targeting members with external billing on iOS and identifying members most likely to convert directly to Platinum r ath er than Gold. Consistent with recent quarters, Q2 Paying Circles deepened paid penetration within our user base, reflecting the extraordina ry potential in our growing base of highly engaged members. Paying Circles grew 27% to 3.2 million —breaking Q2 records with 185,000 net additions. U.S. Paying Circles grew 25% year over year, driven by improved conversion. Internationally, the UK, Australia, and Canada Paying Circles grew 34% year over year, while other international Paying Circles grew 31% year over yea r. Year over year, U.S. ARPPC grew 5% and international ARPPC grew 14%, the latter benefiting from the flowthrough of price increases in select markets. International ARPPC remains meaningfully below U.S. levels, representing a multi - year runway as tho se markets advance along the adoption curve. Looking forward, we are continuing to tune our subscription lineup as we relaunch Pets. In preparation for that launch, we re cen tly raised subscription prices for new subscribers in the U.S. Silver moved from $7.99 to $9.99 monthly and from $79.99 to $99.9 9 annually, and Gold moved from $14.99 to $16.99 monthly. This is the first U.S. price change for our monthly subscribers since 20 22, a period in which we've added meaningful value to our tiers while inflation rose over 10%. Even with the increase, Gold sits be low the inflation - adjusted equivalent of its original price. As part of our update to our subscription tiers and pricing, we are also refining how we sell PetGPS . We believe these changes will strengthen engagement and, consequently, long term monetization. First, we will bundle an annual subscription with the initial Pet GPS purchase, which we have seen has a positive effect on the subscription attach rate. At the same time, we are lowering the total cost of ownership by bundling in the Silver tier, which we believe will lead to higher revenue growth as Pet GPS membership compounds. We continue to believe that pets are one of the largest, most underserved categories that tightly aligns with our mission and the role we play in everyday family life. Across the markets where we’ve launched PetGPS , there are roughly 200 million pets, and pet parents spend more than $200 billion a year on them. Our own research provides added color. Our Global Pet Parenthood Report, published in May, found that 86% of single and double income pet parents without children consider their pet to be like a child. Pets are very much part of the family, and serving pet parents broadens our addressable market, while enriching the value we deliver for a significant share of our existing membership base. Consistent with our existing family features, our value for pet parents starts for free. Our Pet Finder Network, with recovery - focused features, has no real substitute in the market, and now has 8 million pet profiles and growing. As we go to market with Pet GPS, we will also be introducing new everyday value that helps members keep their pets well cared for, with increasing value when those features are tied to a Pet GPS. The shared care and shared history inside a family Circle can't be replicated by a single - purpose tracker or a neighborhood app. With a suite of pet - oriented experiences and devices, we are expanding our relevance to more families in more life stages, focusing on adoption and engagement, with revenue building as the flywheel gets going. Pets was our first major expansion from the nuclear family. The trust we've earned is what opens the door to serve families in new life stages. While still early with pets, we’re already laying the foundation for further expansions. In Q1, we introduced Temporary Location Sharing, providing a key building block to enable a wide range of scenarios, from caregivers to active members of the family who want to coordinate with friends and travel companions. We’re now introducing another building block with Apple Watch, giving every member of the family a path to the map, whether or not they carry a smartphone —a great alternative for parents delaying smartphones for elementary and middle school kids, navigating phone bans on campus, or looking for a way to stay connected with aging parents. Our app for Apple Watch is in beta now, and we expect to launch more broadly by the end of Q3. It's another sign of where we're headed: a platform that reaches every member of the family, on whatever device fits their life —and Apple Watch is just the first of several form factors we see fitting into that vision, including devices built specifically with aging parents in mind. Life360 Inc | Q2 2026 Shareholder letter | Page
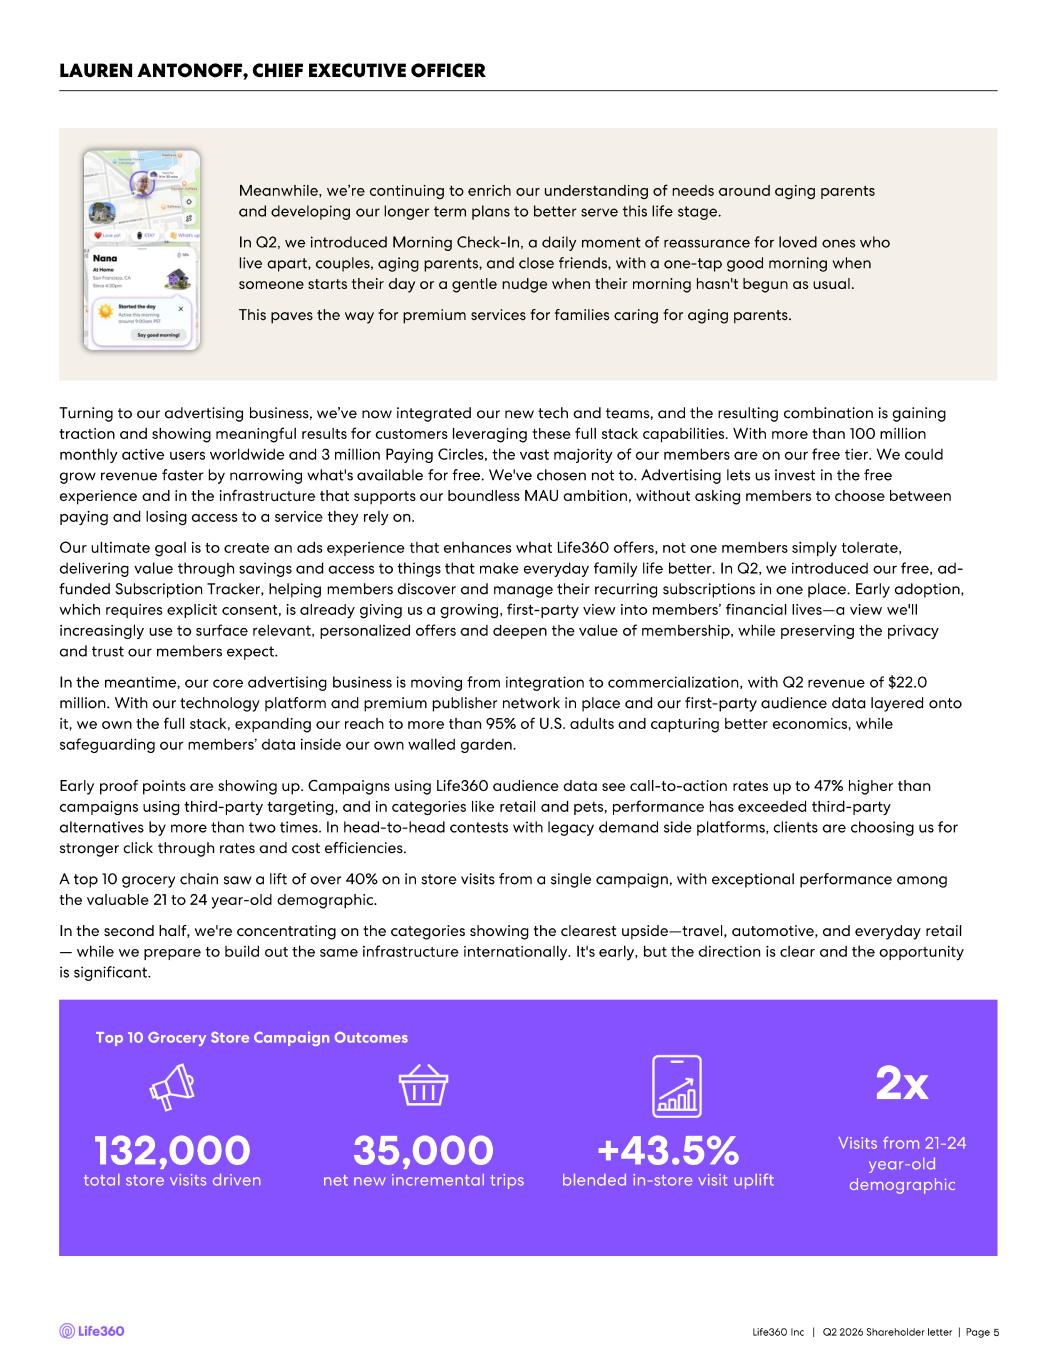
5 LAUREN ANTONOFF, CHIEF EXECUTIVE OFFICER Turning to our advertising business, we’ve now integrated our new tech and teams, and the resulting combination is gaining traction and showing meaningful results for customers leveraging these full stack capabilities. With more than 100 million monthly active users worldwide and 3 million Paying Circles, the vast majority of our members are on our free tier. We could grow revenue faster by narrowing what's available for free. We've chosen not to. Advertising lets us invest in the free experience and in the infrastructure that supports our boundless MAU ambition, without asking members to choose between paying and losing access to a service they rely on. Our ultimate goal is to create an ads experience that enhances what Life360 offers, not one members simply tolerate, delivering value through savings and access to things that make everyday family life better. In Q2, we introduced our free, a d- funded Subscription Tracker, helping members discover and manage their recurring subscriptions in one place. Early adoption, which requires explicit consent, is already giving us a growing, first - party view into members’ financial lives —a view we'll increasingly use to surface relevant, personalized offers and deepen the value of membership, while preserving the privacy and trust our members expect. In the meantime, our core advertising business is moving from integration to commercialization, with Q2 revenue of $22.0 million. With our technology platform and premium publisher network in place and our first - party audience data layered onto it, we own the full stack, expanding our reach to more than 95% of U.S. adults and capturing better economics, while safeguarding our members’ data inside our own walled garden. Early proof points are showing up. Campaigns using Life360 audience data see call - to- action rates up to 47% higher than campaigns using third - party targeting, and in categories like retail and pets, performance has exceeded third - party alternatives by more than two times. In head - to- head contests with legacy demand side platforms, clients are choosing us for stronger click through rates and cost efficiencies. A top 10 grocery chain saw a lift of over 40% on in store visits from a single campaign, with exceptional performance among the valuable 21 to 24 year - old demographic. In the second half, we're concentrating on the categories showing the clearest upside —travel, automotive, and everyday retail — while we prepare to build out the same infrastructure internationally. It's early, but the direction is clear and the opportu nity is significant. Meanwhile, we’re continuing to enrich our understanding of needs around aging parents and developing our longer term plans to better serve this life stage. In Q2, we introduced Morning Check - In, a daily moment of reassurance for loved ones who live apart, couples, aging parents, and close friends, with a one - tap good morning when someone starts their day or a gentle nudge when their morning hasn't begun as usual. This paves the way for premium services for families caring for aging parents. Top 10 Grocery Store Campaign Outcomes 132,000 total store visits driven 35,000 net new incremental trips +43.5% blended in - store visit uplift Life360 Inc | Q2 2026 Shareholder letter | Page Visits from 21 - 24 year - old demographic 2x

6 Sincerely, Lauren Antonoff Chief Executive Officer LAUREN ANTONOFF, CHIEF EXECUTIVE OFFICER Now, I want to touch on AI because it advances everything we've talked about, across user growth, subscriptions, and advertising. AI continues to accelerate both how we build Life360 and what we believe the platform can become. Every day, more than 100 million members use Life360 as they navigate the chaos and responsibilities of family life, creating real - world data that reflects the patterns, relationships, and routines of families moving through the world together. That context allows us to build experiences designed for the Circle, not just individuals, and for the inherently cross - platform nature of family life. Unlike internet data that can be scraped or synthetic datasets that can be generated, this real - world fam ily context puts us in a unique position to make family life easier and more fun, by anticipating what families actually need and creating highly personalized, engaging experiences. This is an advantage no competitor can replicate by scraping the internet or generating synthetic data. This unique foundation is enabling us to evolve from a product families check to see what happened into an intelligent orchestration layer that proactively helps the whole family stay in sync. To capture that opportunity, we continue our transition to an AI - native company, redesigning how work gets done so that AI increasingly handles execution while our people direct, decide, and remain accountable for outcomes. Alongside that transformation, we continue investing in the shared AI infrastructure, governance, and cost optimization needed to scale AI across the company, ensuring new capabilities compound rather than remain isolated within individual teams. We are also expanding our Family AI Lab, led by our executive chair and co - founder, Chris Hulls, to accelerate our long - term vision for AI - powered family coordination. As part of that effort, we entered into an agreement to acquire the team and technology from SuperDuper . The experience that comes with this AI - native four - person team will help us move faster toward surfacing what matters most at the right moment for the whole family. Overall, Q2 was a strong quarter for us. I'm proud of the disciplined execution that carried us past the 100 million MAU mark an d brings our strategic targets of 150 million MAU and one billion dollars in revenue within sight, while we make steady progres s toward our target of 35%+ Adjusted EBITDA margin. We've built a powerful moat carved from nearly two decades of solving location and real - world complexity, where software, hardware, and services converge to solve problems better for families. Most of all, we've earned the trust of over 100 million monthly active users who rely on us to improve their everyday family life. We'll hit roadblocks along the way. But we've shown, quarter after quarter, that we have the focus and the discipline to work through them and come out stronger on the other side. Our return to the MAU glidepath this quarter is proof of exactly that k ind of resilience, and it sets us up for a strong second half across product, subscriptions, advertising, and international. I co ntinue to be bullish about where the company is headed. Thank you to our team for the work, and to our shareholders for your continued trust. We have real momentum heading into the back half of the year, and I'm looking forward to showing all that’s in store. Life360 Inc | Q2 2026 Shareholder letter | Page
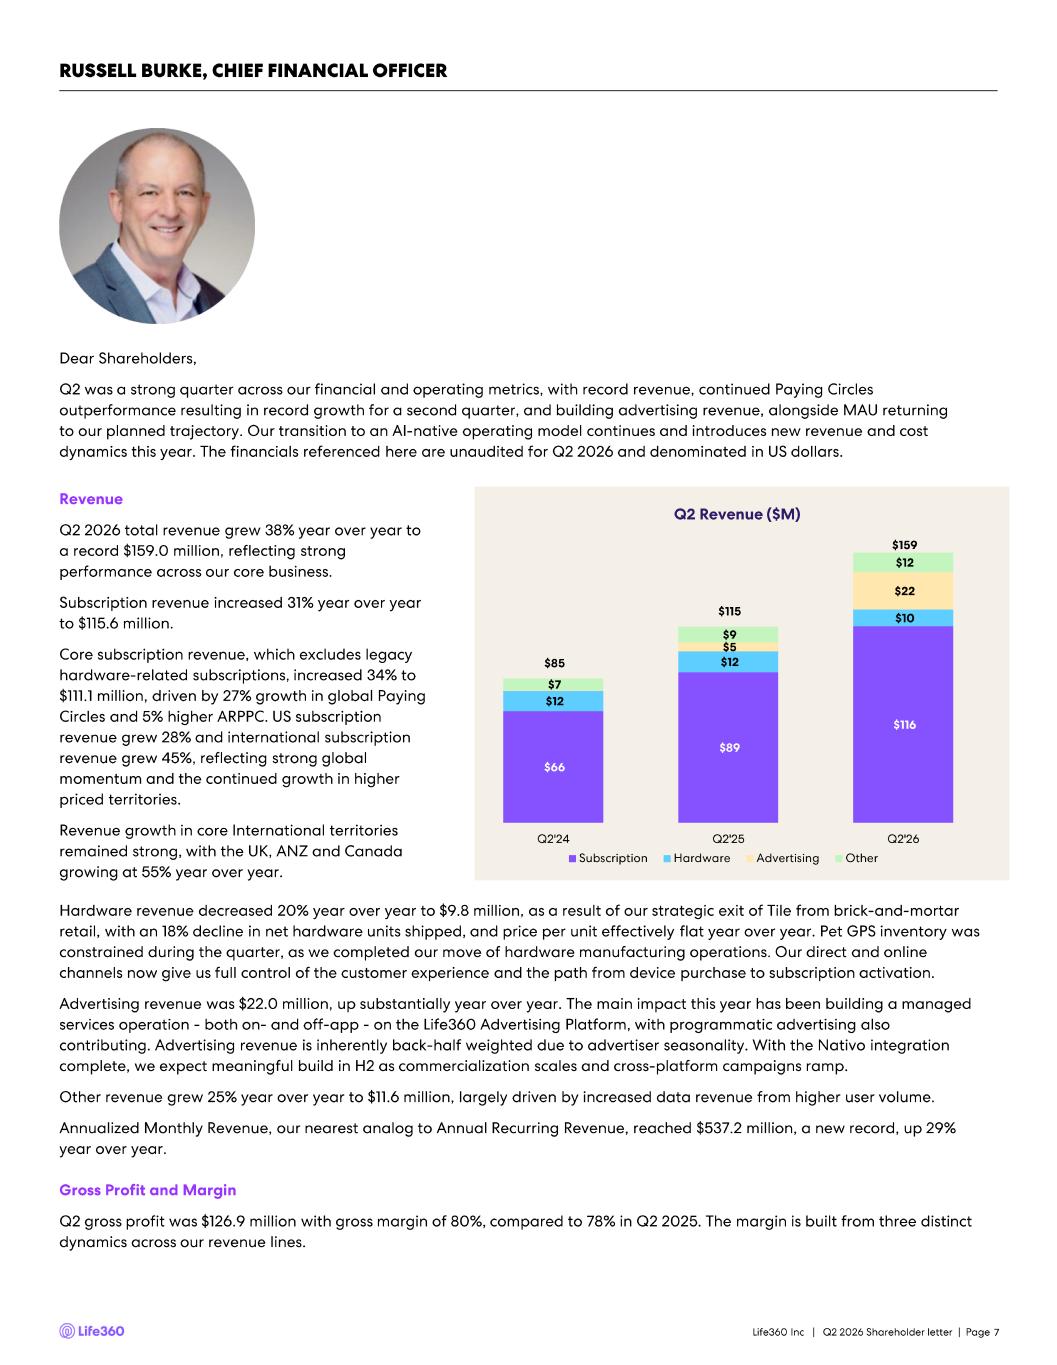
Dear Shareholders, Q2 was a strong quarter across our financial and operating metrics, with record revenue, continued Paying Circles outperformance resulting in record growth for a second quarter, and building advertising revenue, alongside MAU returning to our planned trajectory. Our transition to an AI - native operating model continues and introduces new revenue and cost dynamics this year. The financials referenced here are unaudited for Q2 2026 and denominated in US dollars. Revenue Q2 2026 total revenue grew 38% year over year to a record $159.0 million, reflecting strong performance across our core business. Subscription revenue increased 31% year over year to $115.6 million. Core subscription revenue, which excludes legacy hardware - related subscriptions, increased 34% to $111.1 million, driven by 27% growth in global Paying Circles and 5% higher ARPPC. US subscription revenue grew 28% and international subscription revenue grew 45%, reflecting strong global momentum and the continued growth in higher priced territories. Revenue growth in core International territories remained strong, with the UK, ANZ and Canada growing at 55% year over year. Hardware revenue decreased 20% year over year to $9.8 million, as a result of our strategic exit of Tile from brick - and - mortar retail, with an 18% decline in net hardware units shipped, and price per unit effectively flat year over year. Pet GPS invent ory was constrained during the quarter, as we completed our move of hardware manufacturing operations. Our direct and online channels now give us full control of the customer experience and the path from device purchase to subscription activation. Advertising revenue was $22.0 million, up substantially year over year. The main impact this year has been building a managed services operation - both on - and off - app - on the Life360 Advertising Platform, with programmatic advertising also contributing. Advertising revenue is inherently back - half weighted due to advertiser seasonality. With the Nativo integration complete, we expect meaningful build in H2 as commercialization scales and cross - platform campaigns ramp. Other revenue grew 25% year over year to $11.6 million, largely driven by increased data revenue from higher user volume. Annualized Monthly Revenue, our nearest analog to Annual Recurring Revenue, reached $537.2 million, a new record, up 29% year over year. Gross Profit and Margin Q2 gross profit was $126.9 million with gross margin of 80%, compared to 78% in Q2 2025. The margin is built from three disti nct dynamics across our revenue lines. Q2 Revenue ($M) 7 RUSSELL BURKE, CHIEF FINANCIAL OFFICER $66 $89 $116 $12 $12 $10 $5 $22 $7 $9 $12 $85 $115 $159 Q2'24 Q2'25 Q2'26 Subscription Hardware Advertising Other Life360 Inc | Q2 2026 Shareholder letter | Page
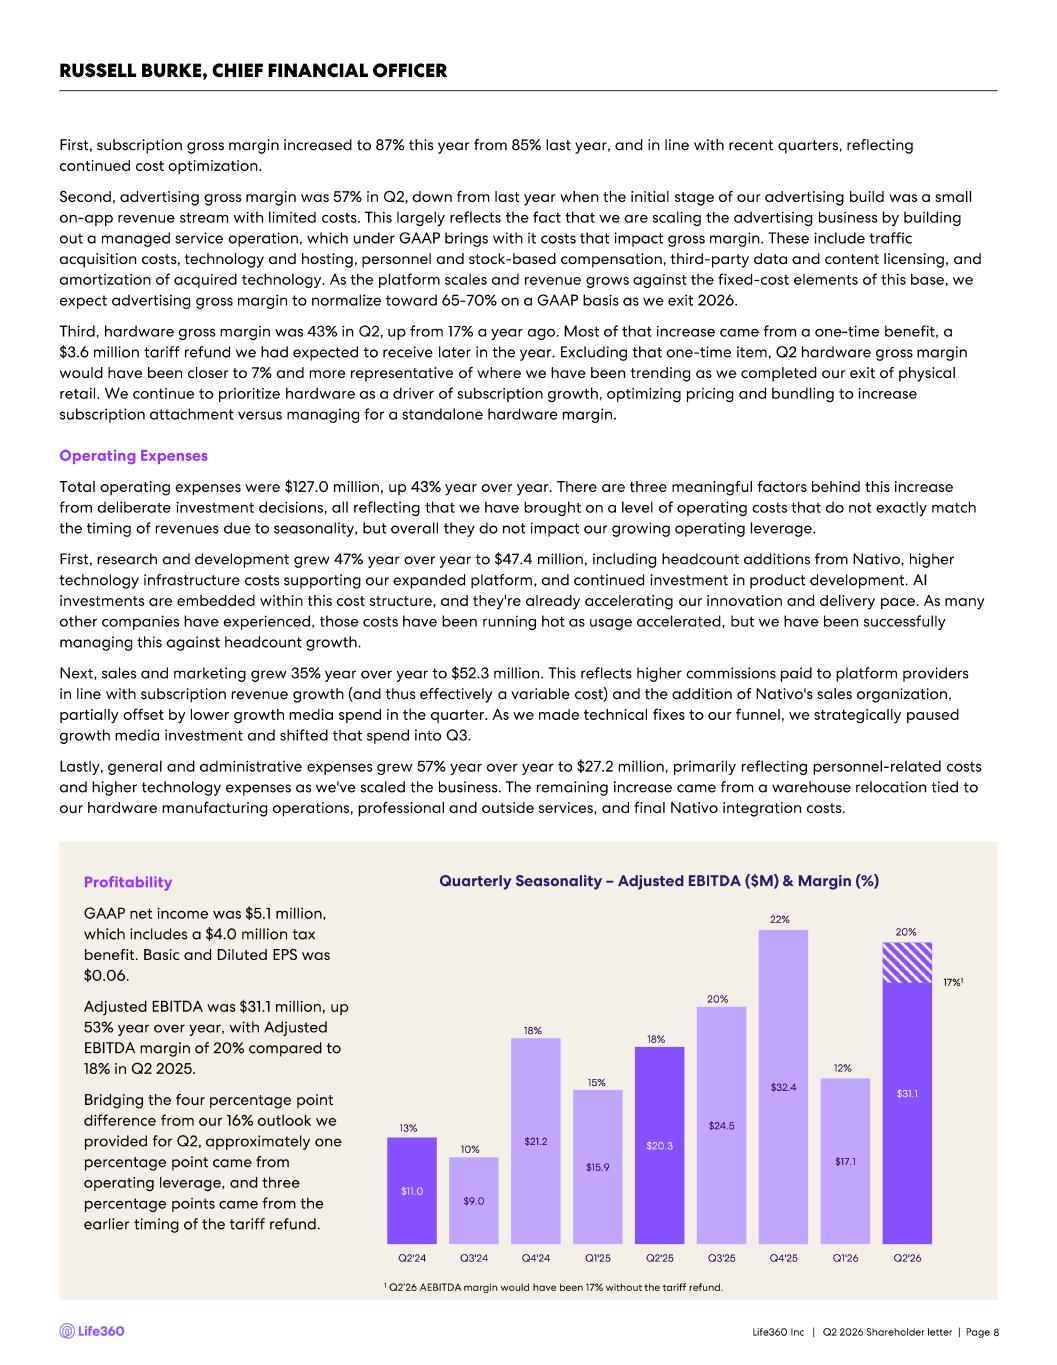
Profitability GAAP net income was $5.1 million, which includes a $4.0 million tax benefit. Basic and Diluted EPS was $0.06. Adjusted EBITDA was $31.1 million, up 53% year over year, with Adjusted EBITDA margin of 20% compared to 18% in Q2 2025. Bridging the four percentage point difference from our 16% outlook we provided for Q2, approximately one percentage point came from operating leverage, and three percentage points came from the earlier timing of the tariff refund. 8 First, subscription gross margin increased to 87% this year from 85% last year, and in line with recent quarters, reflecting continued cost optimization. Second, advertising gross margin was 57% in Q2, down from last year when the initial stage of our advertising build was a sma ll on - app revenue stream with limited costs. This largely reflects the fact that we are scaling the advertising business by buildin g out a managed service operation, which under GAAP brings with it costs that impact gross margin. These include traffic acquisition costs, technology and hosting, personnel and stock - based compensation, third - party data and content licensing, and amortization of acquired technology. As the platform scales and revenue grows against the fixed - cost elements of this base, we expect advertising gross margin to normalize toward 65 - 70% on a GAAP basis as we exit 2026. Third, hardware gross margin was 43% in Q2, up from 17% a year ago. Most of that increase came from a one - time benefit, a $3.6 million tariff refund we had expected to receive later in the year. Excluding that one - time item, Q2 hardware gross margin would have been closer to 7% and more representative of where we have been trending as we completed our exit of physical retail. We continue to prioritize hardware as a driver of subscription growth, optimizing pricing and bundling to increase subscription attachment versus managing for a standalone hardware margin. Operating Expenses Total operating expenses were $127.0 million, up 43% year over year. There are three meaningful factors behind this increase from deliberate investment decisions, all reflecting that we have brought on a level of operating costs that do not exactly m atc h the timing of revenues due to seasonality, but overall they do not impact our growing operating leverage. First, research and development grew 47% year over year to $47.4 million, including headcount additions from Nativo, higher technology infrastructure costs supporting our expanded platform, and continued investment in product development. AI investments are embedded within this cost structure, and they're already accelerating our innovation and delivery pace. As ma ny other companies have experienced, those costs have been running hot as usage accelerated, but we have been successfully managing this against headcount growth. Next, sales and marketing grew 35% year over year to $52.3 million. This reflects higher commissions paid to platform provide rs in line with subscription revenue growth (and thus effectively a variable cost) and the addition of Nativo's sales organizati on, partially offset by lower growth media spend in the quarter. As we made technical fixes to our funnel, we strategically pause d growth media investment and shifted that spend into Q3. Lastly, general and administrative expenses grew 57% year over year to $27.2 million, primarily reflecting personnel - related cos ts and higher technology expenses as we've scaled the business. The remaining increase came from a warehouse relocation tied to our hardware manufacturing operations, professional and outside services, and final Nativo integration costs. RUSSELL BURKE, CHIEF FINANCIAL OFFICER $11.0 $9.0 $21.2 $15.9 $20.3 $24.5 $32.4 $17.1 $31.1 13% 10% 18% 15% 18% 20% 22% 12% 20% 0% 5% 10% 15% 20% 25% $0.0 $5.0 $10.0 $15.0 $20.0 $25.0 $30.0 $35.0 Q2'24 Q3'24 Q4'24 Q1'25 Q2'25 Q3'25 Q4'25 Q1'26 Q2'26 17%1 Quarterly Seasonality – Adjusted EBITDA ($M) & Margin (%) 1 Q2’26 AEBITDA margin would have been 17% without the tariff refund. Life360 Inc | Q2 2026 Shareholder letter | Page
RUSSELL BURKE, CHIEF FINANCIAL OFFICER 9 Transition to AI Native In Q2, we reshaped our technology organization to accelerate our transition to an AI - native operating model, reallocating investment from certain roles toward AI - native capabilities, tooling, and workflow redesign rather than backfilling them. That reallocation is now producing results. We are starting to see this transition creating faster execution and expect meaningful operating leverage over time, with that benefit compounding from 2027 onward. One example where we are already seeing results is our AI - driven personalization engine which is already generating real revenue impact, and we're accelerating investme nt in it based on that early performance. Balance Sheet and Cash Flow Life360 ended Q2 2026 with cash, cash equivalents, restricted cash, and short - term investments of $467.7 million. Our underlying cash generation remains healthy. Operating cash flow was $23.8 million in Q2, up 79% year over year. We have significant financial flexibility to continue investing in our highest - return growth opportunities and returning capital to shareholders through our repurchase program. In May, our Board authorized a multi - year share repurchase program for up to $225.0 million. During the quarter, we repurchased 314,762 shares for approximately $13.2 million, leaving $211.8 million available under the program. We will continue to be th oug htful about the pace and timing of repurchases, balancing capital return and offsetting dilution with continued investment in long term growth initiatives. Financial Outlook Looking forward, we will continue to do three things simultaneously: invest in our highest - return opportunities, accelerate reve nue growth, and expand margin. That combination is reflected in our updated full - year financial outlook as follows: • Consolidated revenue of $650 million to $685 million; • Subscription revenue of $475 million to $480 million, increased from $470 million to $475 million; • Hardware revenue of $35 million to $45 million, reduced from $40 million to $50 million, reflecting price and volume shifts o f devices; • Advertising revenue of $98 million to $115 million, unchanged from our previous outlook. We expect meaningful acceleration in H2 with the integration completed and cross - platform campaigns ramping; • Other revenue of $42 million to $45 million, unchanged from our previous outlook; • Adjusted EBITDA of $130 million to $140 million remains unchanged, representing approximately 20% Adjusted EBITDA margin and another step in our multi - year path of continuous annual expansion toward our strategic target of over 35%. Quarterly Financial Modeling A few points for financial modeling purposes. Revenue and margin are back - half weighted this year, driven by three factors: advertising revenue mix and seasonality concentrating in H2, Nativo integration costs concentrated in H1 while the resulting advertising revenue benefit builds throu gh H2, and hardware revenue and gross margin remaining pressured as we complete the retail channel exit and ramp Pet GPS. It is important to note that we're pricing the Pet GPS device relative to competing devices to drive adoption, consistent wit h o ur strategy of using devices to complement the member experience rather than drive revenue on their own, and we expect a loss at the device gross profit level initially, while at the same time benefiting longer term subscription revenue. The average pet lives about a decade, and we're building this customer relationship for the life of that pet and beyond. The Silver Pet GPS bundle will be priced at $99 annually. We don't expect Pet GPS to be a material revenue contributor this year. On revenue, we now expect subscription revenue of $475 to $480 million for the year, ahead of our prior expectation, and hardware revenue below our original plan, reflecting the physical retail exit and the relocation of device manufacturing. We expect Q4 advertising revenue to roughly double Q1's contribution, which represented approximately 18% of our expected full - year advertising revenue. Life360 Inc | Q2 2026 Shareholder letter | Page
RUSSELL BURKE, CHIEF FINANCIAL OFFICER 10 Sincerely, Russell Burke Chief Financial Officer Turning to gross margin, several factors are in play. We expect subscription and other gross margins to remain consistent wit h recent performance through the second half. Advertising gross margin is trending toward the low - 60% level for the full year, reflecting a mix shift and the cost structure that came with the Nativo integration. We now expect it to normalize at 65 - 70% as we exit the year with the platform continuing to scale. Hardware margin is expected to move to negative mid - 40% in the second half, supporting our device pricing strategy in Pet GPS to drive subscriber acquisition. Consolidated gross margin should land in t he mid - 70% range for the year. We expect Q3 Adjusted EBITDA margin of approximately 18%, continued sequential improvement from Q2's comparable margin of 17% after excluding the one - time tariff benefit. Three factors are moving through Q3 at once and reflected in our outlook. First, the tariff refund that lifted Q2's reported har dware margin was a timing benefit. The refund was previously expected to occur in Q3 or Q4. Second, we intentionally paced growth marketing below plan in the first half of the year, and that spend shifts into Q3 to support Back to School and our full - year MA U growth, full - year marketing spend remains in line with our original plan. And third, AI costs continue to run above our original plan through the second half as usage scales, but offset by lower headcount growth. Operating expenses as a percentage of revenue will decline sequentially through the second half, with Q4 opex as a percentage of revenue coming in below Q4 2025. We expect Q4 2026 Adjusted EBITDA margin to exceed the 22% delivered in Q4 2025. The financial setup into the back half remains strong. Revenue acceleration, margin expansion, Paying Circles and MAU growth all point in the right direction. We look forward to demonstrating that in the back half of the year. Life360 Inc | Q2 2026 Shareholder letter | Page

Appendix 11Life360 Inc | Q2 2026 Shareholder letter | Page
These materials and the accompanying oral presentation have been prepared by Life360, Inc. (ARBN 629 412 942) (“Company”) on a confidential and non - reliance basis, and may not be reproduced in whole or in part, nor may any of its contents be disclosed, to any other person, without the prior written consent of the Company. These materials are for informational purposes only. This presentation contains summary information about the Company and its activities and is current as of the date of this presentation. This presentation does not purport to be all - inclusive or to contain all of the information you may desire. It should be read in conjunction with the Company’s periodic and continuous disclosure announcements filed with the Australian Securities Exchange and the U.S. Securities and Exchange Commission (“SEC”), available at www.asx.com.au and www.sec.gov , respectively. These materials do not constitute an offer, invitation, solicitation or recommendation with respect to the purchase or sale of any security in the Company or interest therein nor does it constitute financial product advice. These materials are not a prospectus, product disclosure statement or other offer document under Australian law or under any other law. These materials have not been filed, registered or approved by regulatory authorities in any jurisdiction. This communication is restricted by law; it is not intended for distribution to, or use by any person in, any jurisdiction where such distribution or use would be contrary to local law or regulation. The information contained in these materials is not intended to be relied upon as advice or a recommendation to investors and is not intended to form the basis of any investment decision in the Company’s securities. The information does not take into account the investment objectives, financial situation, taxation situation or needs of any particular investor. An investor must not act on the basis of any matter contained in these materials but must make its own assessment of the Company and conduct its own investigations and analysis. Investors should assess their own individual financial circumstances and consider talking to a financial adviser, professional adviser or consultant before making any investment decision. By reading these materials you agree to be bound by the limitations set out in these materials. No representation or warranty, express or implied, is made as to the accuracy, reliability, completeness or fairness of the information, opinions, forecasts, reports, estimates and conclusions contained in these materials. The Company does not undertake any obligation to provide any additional information nor update or revise the information in these materials nor correct any inaccuracies or omissions. To the maximum extent permitted by law, none of the Company and its related bodies corporate, or their respective directors, employees or agents, nor any other person accepts any responsibility nor any liability for loss arising from the use of or reliance on information contained in these materials or otherwise arising in connection with it, nor in relation to any other written or oral information or opinions provided now or in the future to the recipient or its advisers and representatives, including without limitation any liability from fault of negligence. Past performance is not indicative of future performance and no guarantee of future returns is implied or given. Nothing contained in these materials nor any information made available to you is, or shall be relied upon as, a promise, representation, warranty or guarantee as to the past, present or the future performance of the Company. Certain statements in these materials constitute forward - looking statements within the meaning of the Private Securities Litigation Reform Act of 1995 (“PSLRA”), Section 27A of the Securities Act of 1933, as amended, and Section 21E of the Securities Exchange Act of 1934, as amended (the “Exchange Act”). Statements that are not historical in nature, including the words “anticipate”, “expect”, “suggests”, “plan”, “believe”, “intend”, “estimates”, “targets”, “projects”, “should”, “could”, “would”, “may”, “will”, “forecast,” “opportunity,” “goal,” “vision,” “outlook” and other similar expressions are intended to identify forward - looking statements. These forward - looking statements include, but are not limited to, statements regarding: the Company’s growth strategy and business plan and the Company’s ability to effectively manage its growth and meet future capital requirements; the Company’s expectations regarding future financial performance, including its expectations regarding its revenue, revenue growth, adjusted EBITDA, and operating cash flow, and the Company’s ability to achieve or maintain future profitability; the Company’s ability to further penetrate its existing member base, maintain and expand its member base and increase monetization of its member base; the Company’s ability to expand internationally and the significance of its global opportunity; the Company’s ability to anticipate market needs or develop new products and services or enhance existing products and services to meet those needs; the Company’s ability to increase sales of its products and services; and the Company’s proposed acquisition of Nativo, its expected timing and completion, the anticipated benefits and synergies of the transaction, and the potential impact on the Company’s business strategy, financial condition, and growth prospects. Such forward - looking statements are prediction, projections and other statements about future events that are based on current expectations and assumptions and, as a result, involve known and unknown risks, uncertainties, assumptions and other important factors, many of which are beyond the control of the Company and which may cause actual results, performance or achievements to differ materially from those expressed or implied by such statements. Forward - looking statements are provided as a general guide only, and should not be relied on as an indication or guarantee of future performance. They can be affected by inaccurate assumptions we might make or by known or unknown risks or uncertainties. Given these uncertainties, recipients are cautioned to not place undue reliance on any forward - looking statement. Forward - looking statements speak only as of the date they are made. Subject to any continuing obligations under applicable law the Company disclaims any obligation or undertaking to disseminate any updates or revisions to any forward - looking statements in these materials to reflect any change in expectations in relation to such forward - looking statements or any change in events, conditions or circumstances on which any such statement is based. These materials contain certain measures of financial performance not determined in accordance with U.S. generally accepted accounting principles (“GAAP”), including Adjusted EBITDA, Adjusted EBITDA margin, and non - GAAP Operating Expenses (the “non - GAAP financial measures”). The non - GAAP financial measures are used by Company management to evaluate financial performance of, and determine resource allocation for, each of the Company's operating segments. Items excluded from each of the non - GAAP financial measures are significant components in understanding and assessing financial performance. The non - GAAP financial measures should not be considered in isolation, or as alternatives to, or substitutes for, net income, net income margin, income from operations, cash flows generated by operations, investing or financing activities, or other financial statement data presented in the Company's consolidated financial statements as indicators of financial performance or liquidity. Because the non - GAAP financial measures are not measurements determined in accordance with GAAP and are thus susceptible to varying definitions, the non - GAAP financial measurements as presented may not be comparable to other similarly titled measures of other companies. Please refer to the Appendix in the Q2’26 Investor Presentation for a reconciliation of these financial measures to the most directly comparable financial measure prepared in accordance with GAAP. These materials include our trademarks and trade names that we own or license and our logo. This presentation also includes trademarks, trade names and service marks that are the property of other organizations. Solely for convenience, trademarks and trade names referred to in this prospectus appear without any “TM” or “®” symbol, but those references are not intended to indicate, in any way, that we will not assert, to the fullest extent under applicable law, our rights to these trademarks, trade names and service marks. We do not intend our use or display of other parties' trademarks, trade names or service marks to imply, and such use or display should not be construed to imply, a relationship with, or endorsement or sponsorship of us by, these other parties. FIFA®, FIFA World Cup®, and World Cup® are trademarks of FIFA. Life360 is not affiliated with, sponsored by, or endorsed by FIFA. References to the FIFA World Cup are for descriptive purposes only. These materials include industry and market data derived from internal analyses based upon publicly available data or other proprietary research and analysis, surveys or studies conducted by third parties and industry and general publications. Unless otherwise indicated, information contained in this presentation concerning our industry and the markets in which we operate, including our general expectations and market position, market opportunity and market size, is based on these various sources. Because this information involves a number of assumptions and limitations, you are cautioned not to give undue weight to such information. We have not independently verified market data and industry forecasts provided by any of these or any other third - party sources referred to in this presentation. All values are stated in US dollars unless otherwise stated. Note: Numbers may not add or recalculate due to rounding Disclaimer APPENDIX 12Life360 Inc | Q2 2026 Shareholder letter | Page
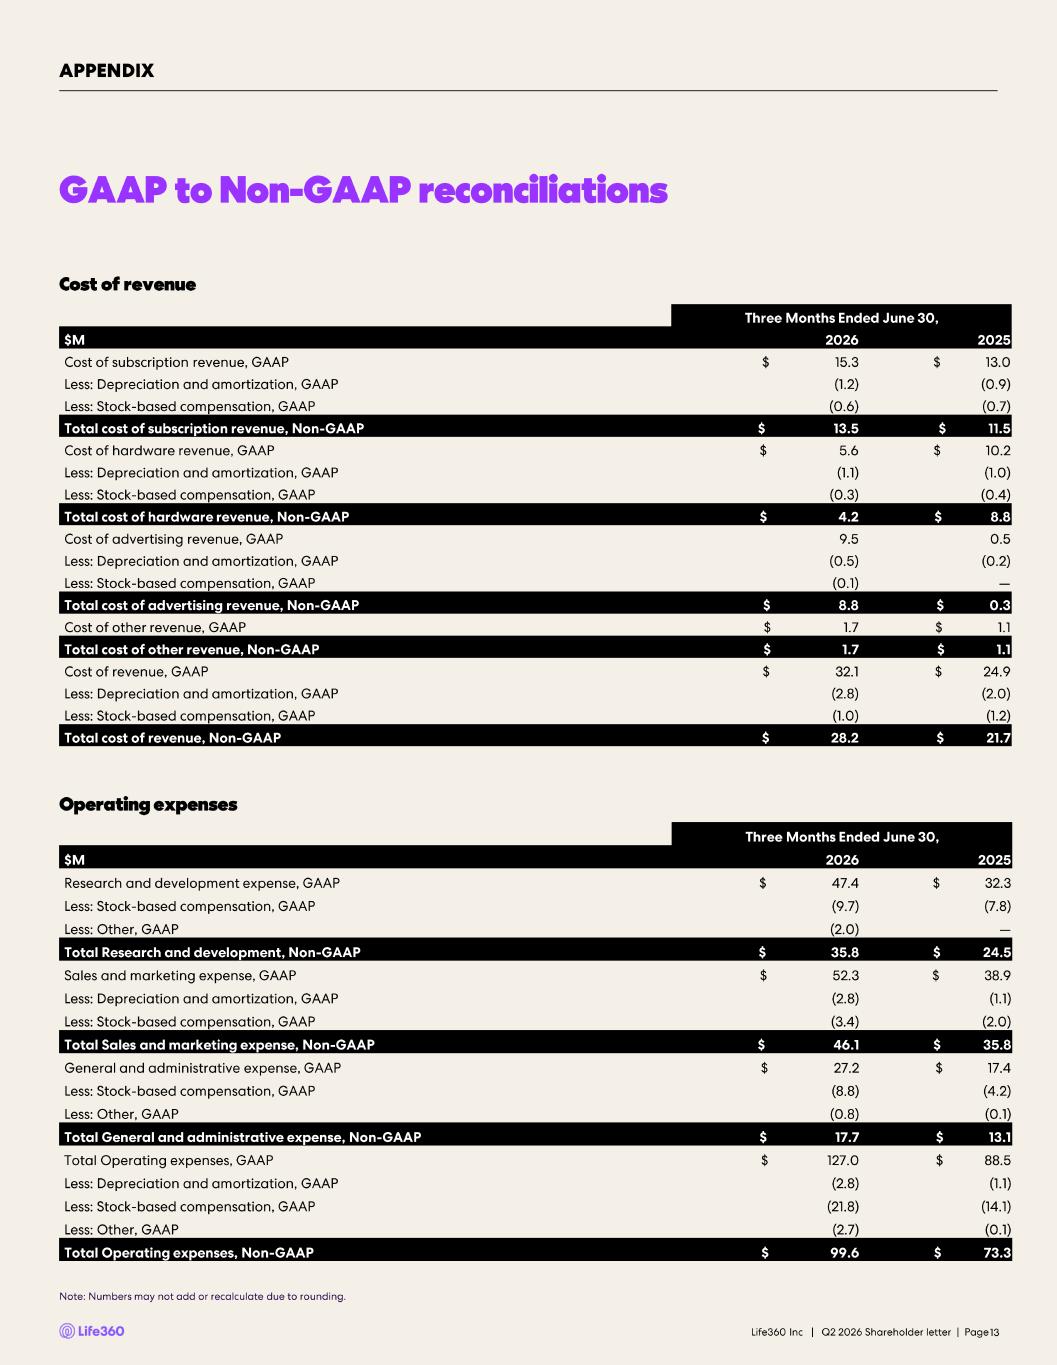
GAAP to Non -GAAP reconciliations Cost of revenue Operating expenses 13 APPENDIX Note: Numbers may not add or recalculate due to rounding. Three Months Ended June 30, $M 2026 2025 Cost of subscription revenue, GAAP $ 15.3 $ 13.0 Less: Depreciation and amortization, GAAP (1.2) (0.9) Less: Stock -based compensation, GAAP (0.6) (0.7) Total cost of subscription revenue, Non -GAAP $ 13.5 $ 11.5 Cost of hardware revenue, GAAP $ 5.6 $ 10.2 Less: Depreciation and amortization, GAAP (1.1) (1.0) Less: Stock -based compensation, GAAP (0.3) (0.4) Total cost of hardware revenue, Non -GAAP $ 4.2 $ 8.8 Cost of advertising revenue, GAAP 9.5 0.5 Less: Depreciation and amortization, GAAP (0.5) (0.2) Less: Stock -based compensation, GAAP (0.1) — Total cost of advertising revenue, Non -GAAP $ 8.8 $ 0.3 Cost of other revenue, GAAP $ 1.7 $ 1.1 Total cost of other revenue, Non -GAAP $ 1.7 $ 1.1 Cost of revenue, GAAP $ 32.1 $ 24.9 Less: Depreciation and amortization, GAAP (2.8) (2.0) Less: Stock -based compensation, GAAP (1.0) (1.2) Total cost of revenue, Non -GAAP $ 28.2 $ 21.7 Three Months Ended June 30, $M 2026 2025 Research and development expense, GAAP $ 47.4 $ 32.3 Less: Stock -based compensation, GAAP (9.7) (7.8) Less: Other, GAAP (2.0) — Total Research and development, Non -GAAP $ 35.8 $ 24.5 Sales and marketing expense, GAAP $ 52.3 $ 38.9 Less: Depreciation and amortization, GAAP (2.8) (1.1) Less: Stock -based compensation, GAAP (3.4) (2.0) Total Sales and marketing expense, Non -GAAP $ 46.1 $ 35.8 General and administrative expense, GAAP $ 27.2 $ 17.4 Less: Stock -based compensation, GAAP (8.8) (4.2) Less: Other, GAAP (0.8) (0.1) Total General and administrative expense, Non -GAAP $ 17.7 $ 13.1 Total Operating expenses, GAAP $ 127.0 $ 88.5 Less: Depreciation and amortization, GAAP (2.8) (1.1) Less: Stock -based compensation, GAAP (21.8) (14.1) Less: Other, GAAP (2.7) (0.1) Total Operating expenses, Non -GAAP $ 99.6 $ 73.3 Life360 Inc | Q2 2026 Shareholder letter | Page
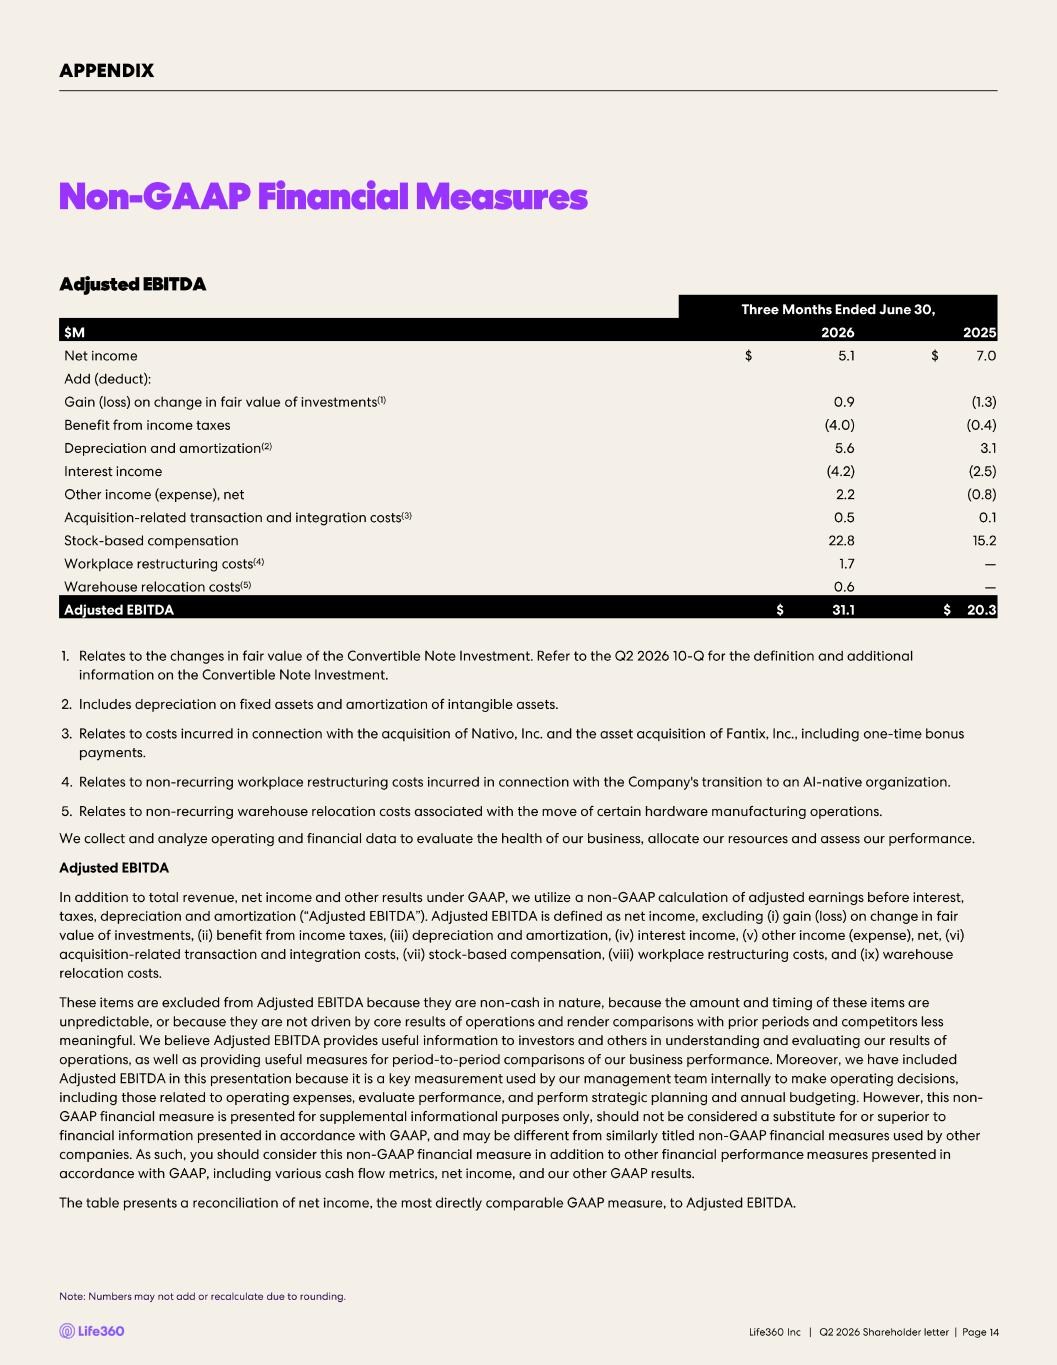
Non-GAAP Financial Measures Note: Numbers may not add or recalculate due to rounding. 14 1. Relates to the changes in fair value of the Convertible Note Investment. Refer to the Q2 2026 10 -Q for the definition and ad ditional information on the Convertible Note Investment. 2. Includes depreciation on fixed assets and amortization of intangible assets. 3. Relates to costs incurred in connection with the acquisition of Nativo, Inc. and the asset acquisition of Fantix , Inc., including one - time bonus payments. 4. Relates to non -recurring workplace restructuring costs incurred in connection with the Company's transition to an AI -native organization. 5. Relates to non -recurring warehouse relocation costs associated with the move of certain hardware manufacturing operations. We collect and analyze operating and financial data to evaluate the health of our business, allocate our resources and assess ou r performance. Adjusted EBITDA In addition to total revenue, net income and other results under GAAP, we utilize a non -GAAP calculation of adjusted earnings be fore interest, taxes, depreciation and amortization (“Adjusted EBITDA”). Adjusted EBITDA is defined as net income, excluding ( i) gain (loss) on change in fair value of investments, (ii) benefit from income taxes, (iii) depreciation and amortization, (iv) interest income, (v) other in com e (expense), net, (vi) acquisition - related transaction and integration costs, (vii) stock -based compensation, (viii) workplace restructuring costs, and (ix) warehouse relocation costs. These items are excluded from Adjusted EBITDA because they are non -cash in nature, because the amount and timing of these items are unpredictable, or because they are not driven by core results of operations and render comparisons with prior periods and com pet itors less meaningful. We believe Adjusted EBITDA provides useful information to investors and others in understanding and evaluating ou r results of operations, as well as providing useful measures for period - to-period comparisons of our business performance. Moreover, we have included Adjusted EBITDA in this presentation because it is a key measurement used by our management team internally to make operating de cisions, including those related to operating expenses, evaluate performance, and perform strategic planning and annual budgeting. How eve r, this non - GAAP financial measure is presented for supplemental informational purposes only, should not be considered a substitute for o r superior to financial information presented in accordance with GAAP, and may be different from similarly titled non -GAAP financial measures used by other companies. As such, you should consider this non -GAAP financial measure in addition to other financial performance measures pres ented in accordance with GAAP, including various cash flow metrics, net income, and our other GAAP results. The table presents a reconciliation of net income, the most directly comparable GAAP measure, to Adjusted EBITDA. APPENDIX Adjusted EBITDA Three Months Ended June 30, $M 2026 2025 Net income $ 5.1 $ 7.0 Add (deduct): Gain (loss) on change in fair value of investments (1) 0.9 (1.3) Benefit from income taxes (4.0) (0.4) Depreciation and amortization (2) 5.6 3.1 Interest income (4.2) (2.5) Other income (expense), net 2.2 (0.8) Acquisition - related transaction and integration costs (3) 0.5 0.1 Stock -based compensation 22.8 15.2 Workplace restructuring costs (4) 1.7 — Warehouse relocation costs (5) 0.6 — Adjusted EBITDA $ 31.1 $ 20.3 Life360 Inc | Q2 2026 Shareholder letter | Page

Investor Presentation | August 2026 Q2'26 Investor Presentation 10 August 2026 U.S. PT | 11 August 2026 AEST

Investor Presentation | August 2026 DISCLAIMER These materials and the accompanying oral presentation have been prepared by Life360, Inc. (ARBN 629 412 942) (“Company”) on a confidential and non-reliance basis, and may not be reproduced in whole or in part, nor may any of its contents be disclosed, to any other person, without the prior written consent of the Company. These materials are for informational purposes only. This presentation contains summary information about the Company and its activities and is current as of the date of this presentation. This presentation does not purport to be all-inclusive or to contain all of the information you may desire. It should be read in conjunction with the Company’s periodic and continuous disclosure announcements filed with the Australian Securities Exchange and the U.S. Securities and Exchange Commission (“SEC”), available at www.asx.com.au and www.sec.gov, respectively. These materials do not constitute an offer, invitation, solicitation or recommendation with respect to the purchase or sale of any security in the Company or interest therein nor does it constitute financial product advice. These materials are not a prospectus, product disclosure statement or other offer document under Australian law or under any other law. These materials have not been filed, registered or approved by regulatory authorities in any jurisdiction. This communication is restricted by law; it is not intended for distribution to, or use by any person in, any jurisdiction where such distribution or use would be contrary to local law or regulation. The information contained in these materials is not intended to be relied upon as advice or a recommendation to investors and is not intended to form the basis of any investment decision in the Company’s securities. The information does not take into account the investment objectives, financial situation, taxation situation or needs of any particular investor. An investor must not act on the basis of any matter contained in these materials but must make its own assessment of the Company and conduct its own investigations and analysis. Investors should assess their own individual financial circumstances and consider talking to a financial adviser, professional adviser or consultant before making any investment decision. By reading these materials you agree to be bound by the limitations set out in these materials. No representation or warranty, express or implied, is made as to the accuracy, reliability, completeness or fairness of the information, opinions, forecasts, reports, estimates and conclusions contained in these materials. The Company does not undertake any obligation to provide any additional information nor update or revise the information in these materials nor correct any inaccuracies or omissions. To the maximum extent permitted by law, none of the Company and its related bodies corporate, or their respective directors, employees or agents, nor any other person accepts any responsibility nor any liability for loss arising from the use of or reliance on information contained in these materials or otherwise arising in connection with it, nor in relation to any other written or oral information or opinions provided now or in the future to the recipient or its advisers and representatives, including without limitation any liability from fault of negligence. Past performance is not indicative of future performance and no guarantee of future returns is implied or given. Nothing contained in these materials nor any information made available to you is, or shall be relied upon as, a promise, representation, warranty or guarantee as to the past, present or the future performance of the Company. Certain statements in these materials constitute forward-looking statements within the meaning of the Private Securities Litigation Reform Act of 1995 (“PSLRA”), Section 27A of the Securities Act of 1933, as amended, and Section 21E of the Securities Exchange Act of 1934, as amended (the “Exchange Act”). Statements that are not historical in nature, including the words “anticipate”, “expect”, “suggests”, “plan”, “believe”, “intend”, “estimates”, “targets”, “projects”, “should”, “could”, “would”, “may”, “will”, “forecast,” “opportunity,” “goal,” “vision,” “outlook” and other similar expressions are intended to identify forward-looking statements. These forward- looking statements include, but are not limited to, statements regarding: the Company’s growth strategy and business plan and the Company’s ability to effectively manage its growth and meet future capital requirements; the Company’s expectations regarding future financial performance, including its expectations regarding its revenue, revenue growth, adjusted EBITDA, and operating cash flow, and the Company’s ability to achieve or maintain future profitability; the Company’s ability to further penetrate its existing member base, maintain and expand its member base and increase monetization of its member base; the Company’s ability to expand internationally and the significance of its global opportunity; the Company’s ability to anticipate market needs or develop new products and services or enhance existing products and services to meet those needs; the Company’s ability to increase sales of its products and services. Such forward-looking statements are prediction, projections and other statements about future events that are based on current expectations and assumptions and, as a result, involve known and unknown risks, uncertainties, assumptions and other important factors, many of which are beyond the control of the Company and which may cause actual results, performance or achievements to differ materially from those expressed or implied by such statements. Forward-looking statements are provided as a general guide only, and should not be relied on as an indication or guarantee of future performance. They can be affected by inaccurate assumptions we might make or by known or unknown risks or uncertainties. Given these uncertainties, recipients are cautioned to not place undue reliance on any forward- looking statement. Forward-looking statements speak only as of the date they are made. Subject to any continuing obligations under applicable law the Company disclaims any obligation or undertaking to disseminate any updates or revisions to any forward-looking statements in these materials to reflect any change in expectations in relation to such forward-looking statements or any change in events, conditions or circumstances on which any such statement is based. This presentation contains certain measures of financial performance not determined in accordance with U.S. generally accepted accounting principles (“GAAP”), including Adjusted EBITDA, Adjusted EBITDA margin, and non-GAAP Operating Expenses (the “non-GAAP financial measures”). The non-GAAP financial measures are used by Company management to evaluate financial performance of, and determine resource allocation for, each of the Company's operating segments. Items excluded from each of the non-GAAP financial measures are significant components in understanding and assessing financial performance. The non-GAAP financial measures should not be considered in isolation, or as alternatives to, or substitutes for, net income, net income margin, income from operations, cash flows generated by operations, investing or financing activities, or other financial statement data presented in the Company's consolidated financial statements as indicators of financial performance or liquidity. Because the non-GAAP financial measures are not measurements determined in accordance with GAAP and are thus susceptible to varying definitions, the non-GAAP financial measurements as presented may not be comparable to other similarly titled measures of other companies. Please refer to the Appendix beginning on slide 43 of this presentation for a reconciliation of these financial measures to the most directly comparable financial measure prepared in accordance with GAAP. This presentation includes our trademarks and trade names that we own or license and our logo. This presentation also includes trademarks, trade names and service marks that are the property of other organizations. Solely for convenience, trademarks and trade names referred to in this prospectus appear without any “TM” or “®” symbol, but those references are not intended to indicate, in any way, that we will not assert, to the fullest extent under applicable law, our rights to these trademarks, trade names and service marks. We do not intend our use or display of other parties' trademarks, trade names or service marks to imply, and such use or display should not be construed to imply, a relationship with, or endorsement or sponsorship of us by, these other parties. FIFA®, FIFA World Cup®, and World Cup® are trademarks of FIFA. Life360 is not affiliated with, sponsored by, or endorsed by FIFA. References to the FIFA World Cup are for descriptive purposes only. This presentation includes industry and market data derived from internal analyses based upon publicly available data or other proprietary research and analysis, surveys or studies conducted by third parties and industry and general publications. Unless otherwise indicated, information contained in this presentation concerning our industry and the markets in which we operate, including our general expectations and market position, market opportunity and market size, is based on these various sources. Because this information involves a number of assumptions and limitations, you are cautioned not to give undue weight to such information. We have not independently verified market data and industry forecasts provided by any of these or any other third-party sources referred to in this presentation. All values are stated in US dollars unless otherwise stated. 2

Investor Presentation | August 2026 Contents Appendix (54 – 63)05 04 Financial Update Q2'26 (37 – 51)03 Life360 Strategy (28 – 36)02 Life360 Overview (4 – 27)01 Operating metrics Financials GAAP to Non-GAAP reconciliations & Non-GAAP financial measures Beyond MAU: 121 million Total Users in the Life360 Ecosystem End-to-End Differentiated Ads Platform at Scale Life360 and Uber Competitive landscape FY’26 Outlook (52 – 53)

Investor Presentation | August 2026 01 Life360 Overview
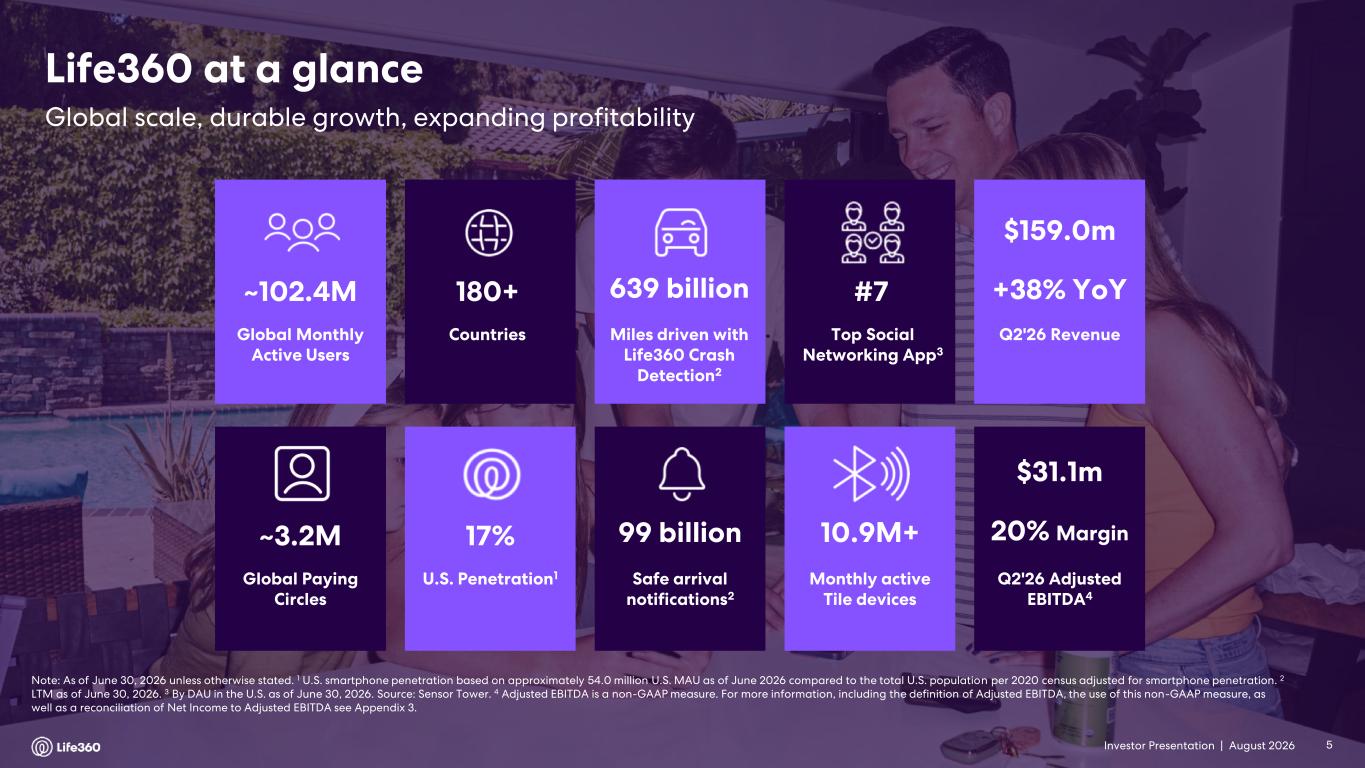
Investor Presentation | August 2026 Note: As of June 30, 2026 unless otherwise stated. 1 U.S. smartphone penetration based on approximately 54.0 million U.S. MAU as of June 2026 compared to the total U.S. population per 2020 census adjusted for smartphone penetration. 2 LTM as of June 30, 2026. 3 By DAU in the U.S. as of June 30, 2026. Source: Sensor Tower. 4 Adjusted EBITDA is a non-GAAP measure. For more information, including the definition of Adjusted EBITDA, the use of this non-GAAP measure, as well as a reconciliation of Net Income to Adjusted EBITDA see Appendix 3. Global Paying Circles ~3.2M Safe arrival notifications2 99 billion U.S. Penetration1 17% 10.9M+ Monthly active Tile devices Global Monthly Active Users ~102.4M Miles driven with Life360 Crash Detection2 639 billion Countries 180+ Top Social Networking App3 #7 Q2'26 Revenue $159.0m +38% YoY Q2'26 Adjusted EBITDA4 $31.1m 20% Margin Global scale, durable growth, expanding profitability Life360 at a glance 5
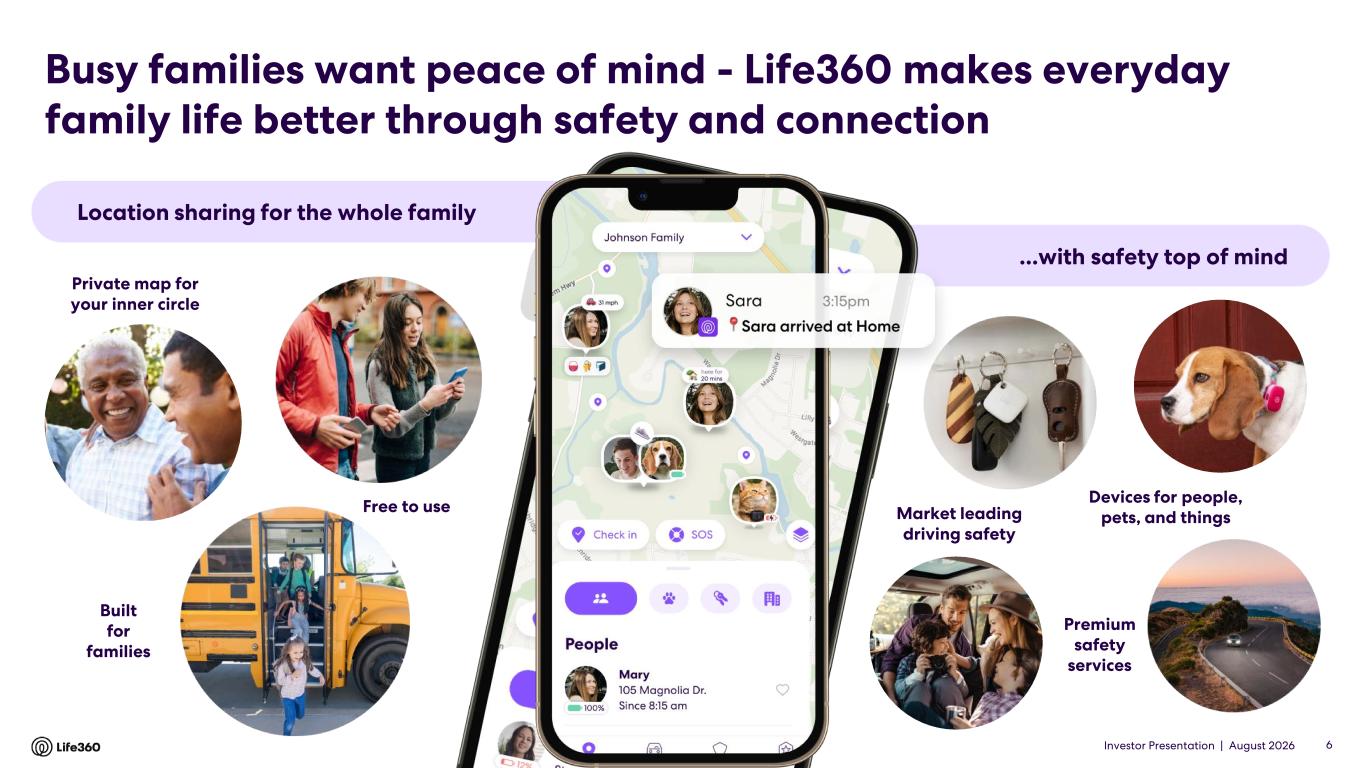
Investor Presentation | August 2026 Location sharing for the whole family ...with safety top of mind Private map for your inner circle Free to use Built for families Devices for people, pets, and things Premium safety services Market leading driving safety Busy families want peace of mind - Life360 makes everyday family life better through safety and connection 6
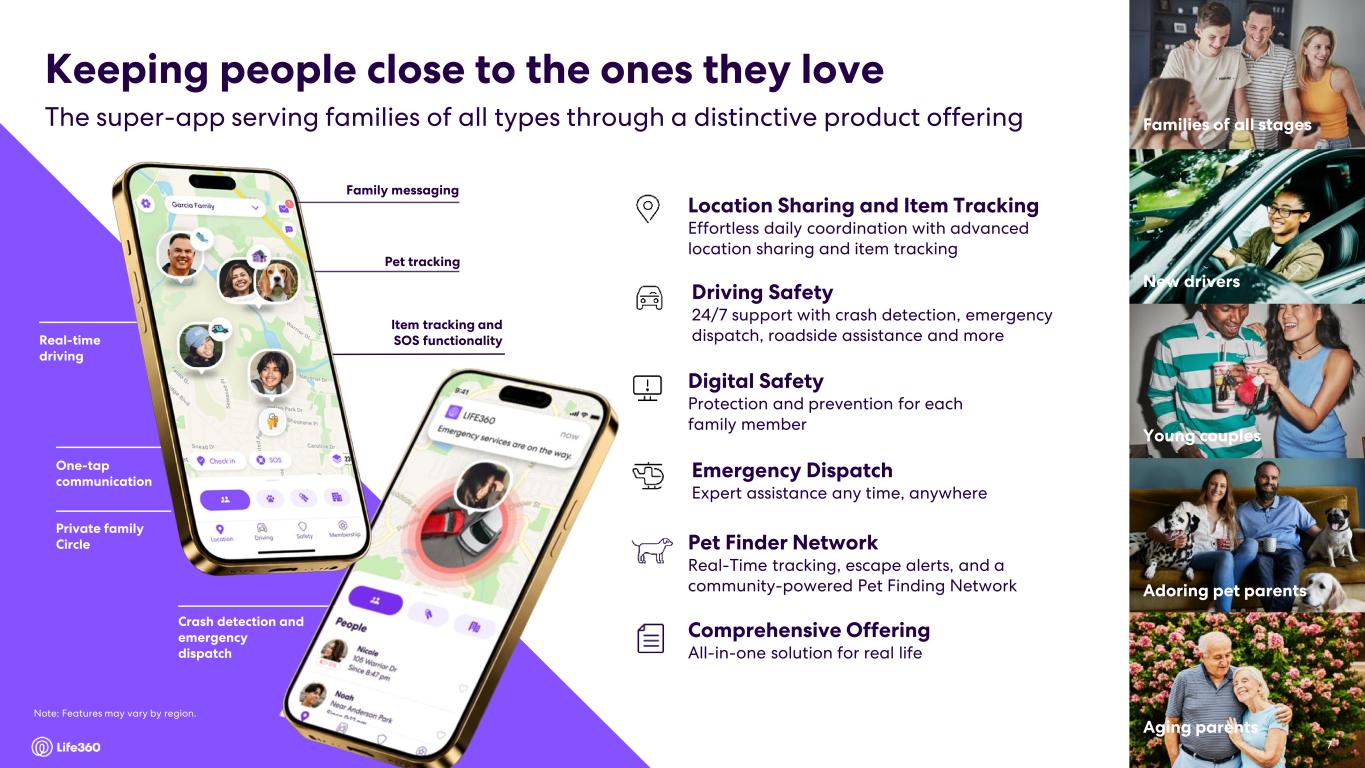
Investor Presentation | August 2026 7 Family messaging Real-time driving One-tap communication Private family Circle Item tracking and SOS functionality Crash detection and emergency dispatch Driving Safety 24/7 support with crash detection, emergency dispatch, roadside assistance and more Digital Safety Protection and prevention for each family member Location Sharing and Item Tracking Effortless daily coordination with advanced location sharing and item tracking Emergency Dispatch Expert assistance any time, anywhere Comprehensive Offering All-in-one solution for real life Young couples New drivers Families of all stages Aging parents Adoring pet parents The super-app serving families of all types through a distinctive product offering Keeping people close to the ones they love 7 Pet Finder Network Real-Time tracking, escape alerts, and a community-powered Pet Finding Network Pet tracking Note: Features may vary by region.
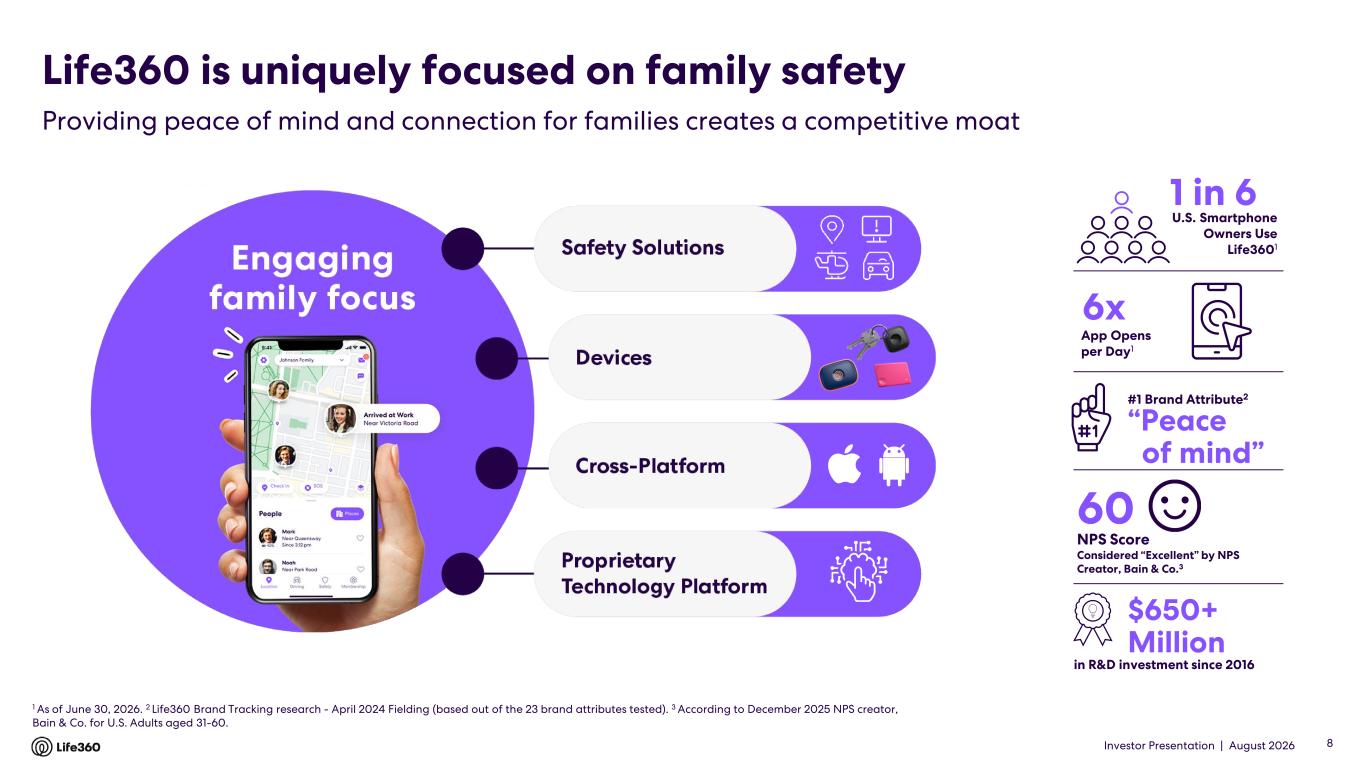
Investor Presentation | August 2026 1 As of June 30, 2026. 2 Life360 Brand Tracking research - April 2024 Fielding (based out of the 23 brand attributes tested). 3 According to December 2025 NPS creator, Bain & Co. for U.S. Adults aged 31-60. in R&D investment since 2016 #1 Brand Attribute2 1 in 6 60 NPS Score Considered “Excellent” by NPS Creator, Bain & Co.3 “Peace of mind” 6x U.S. Smartphone Owners Use Life3601 $650+ Million App Opens per Day1 Life360 is uniquely focused on family safety Providing peace of mind and connection for families creates a competitive moat 8
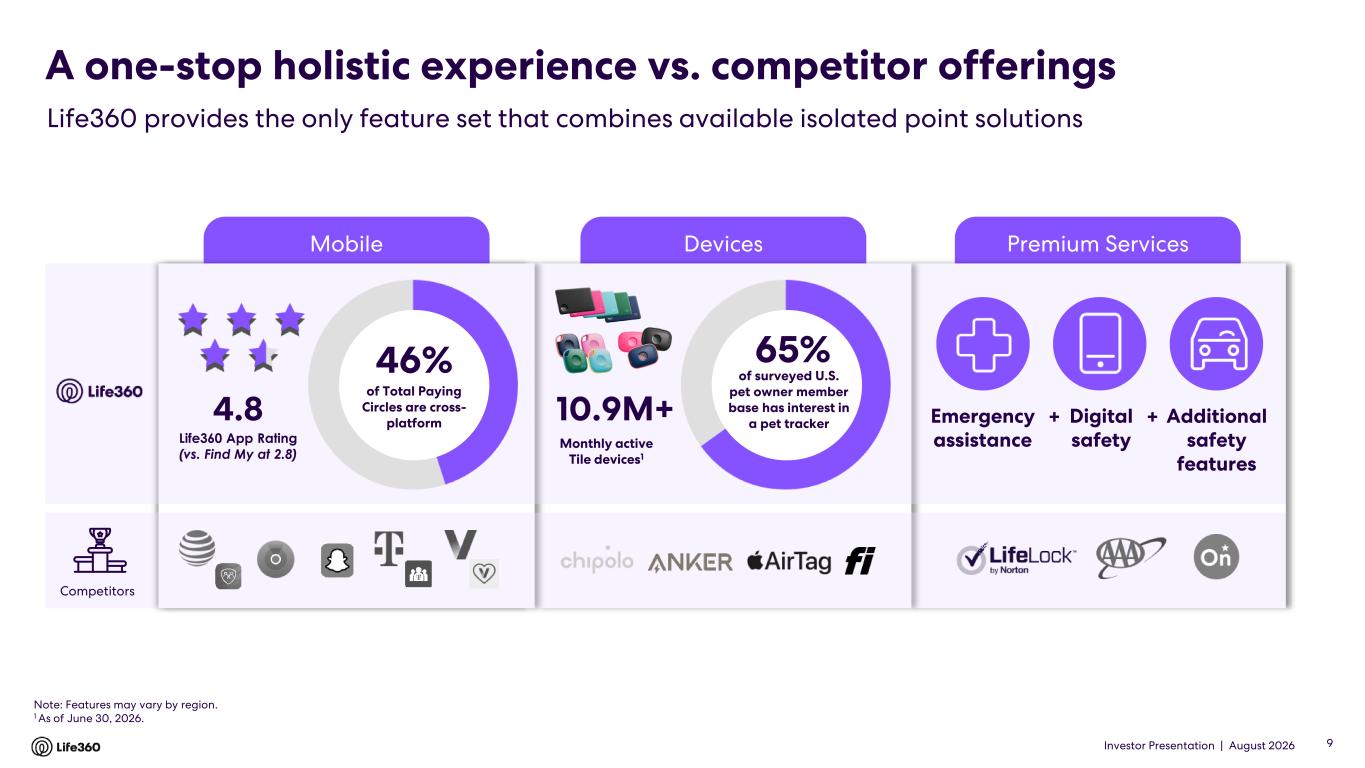
Investor Presentation | August 2026 Premium ServicesDevicesMobile A one-stop holistic experience vs. competitor offerings Life360 provides the only feature set that combines available isolated point solutions Note: Features may vary by region. 1 As of June 30, 2026. 10.9M+ 65% of surveyed U.S. pet owner member base has interest in a pet tracker Monthly active Tile devices1 Emergency assistance Digital safety Additional safety features + +4.8 Life360 App Rating (vs. Find My at 2.8) Competitors 46% of Total Paying Circles are cross- platform 9
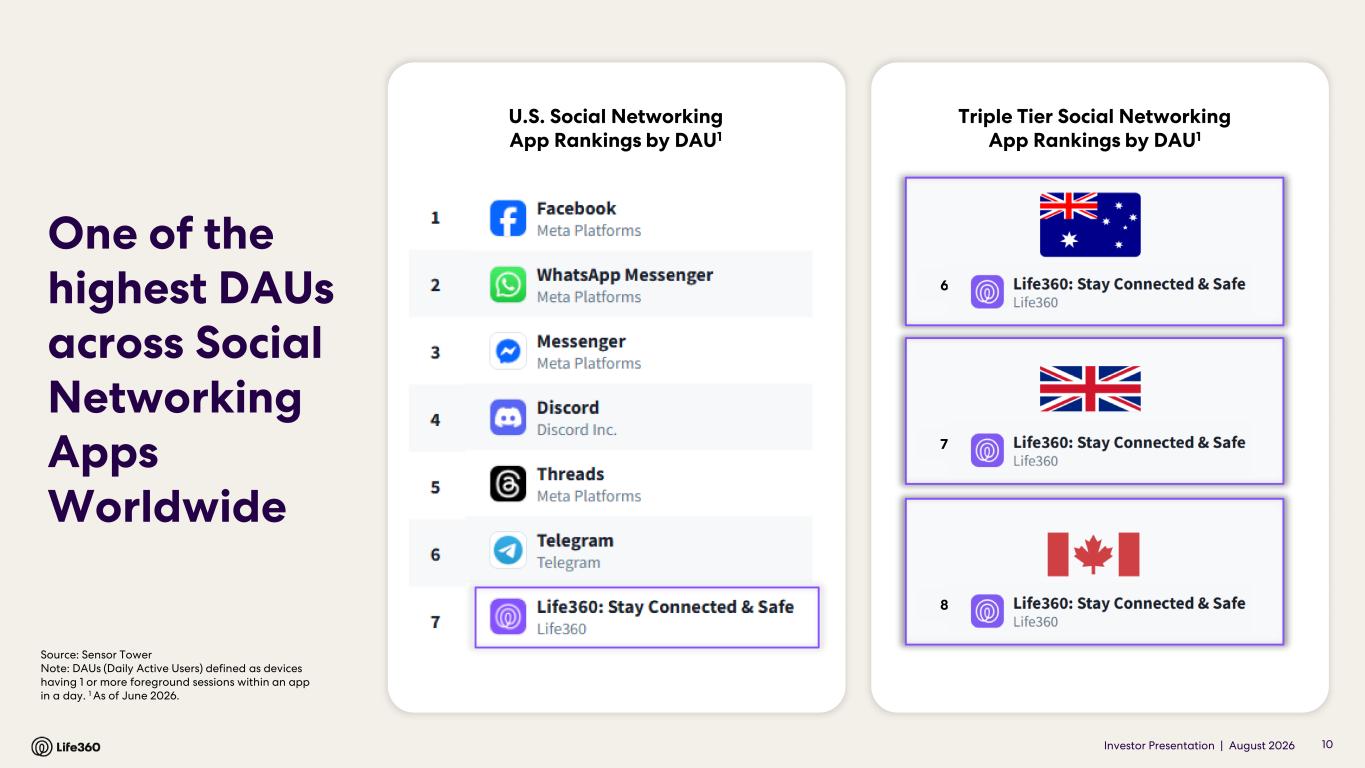
Investor Presentation | August 2026 6 7 8 Source: Sensor Tower Note: DAUs (Daily Active Users) defined as devices having 1 or more foreground sessions within an app in a day. 1 As of June 2026. U.S. Social Networking App Rankings by DAU1 10 One of the highest DAUs across Social Networking Apps Worldwide Triple Tier Social Networking App Rankings by DAU1
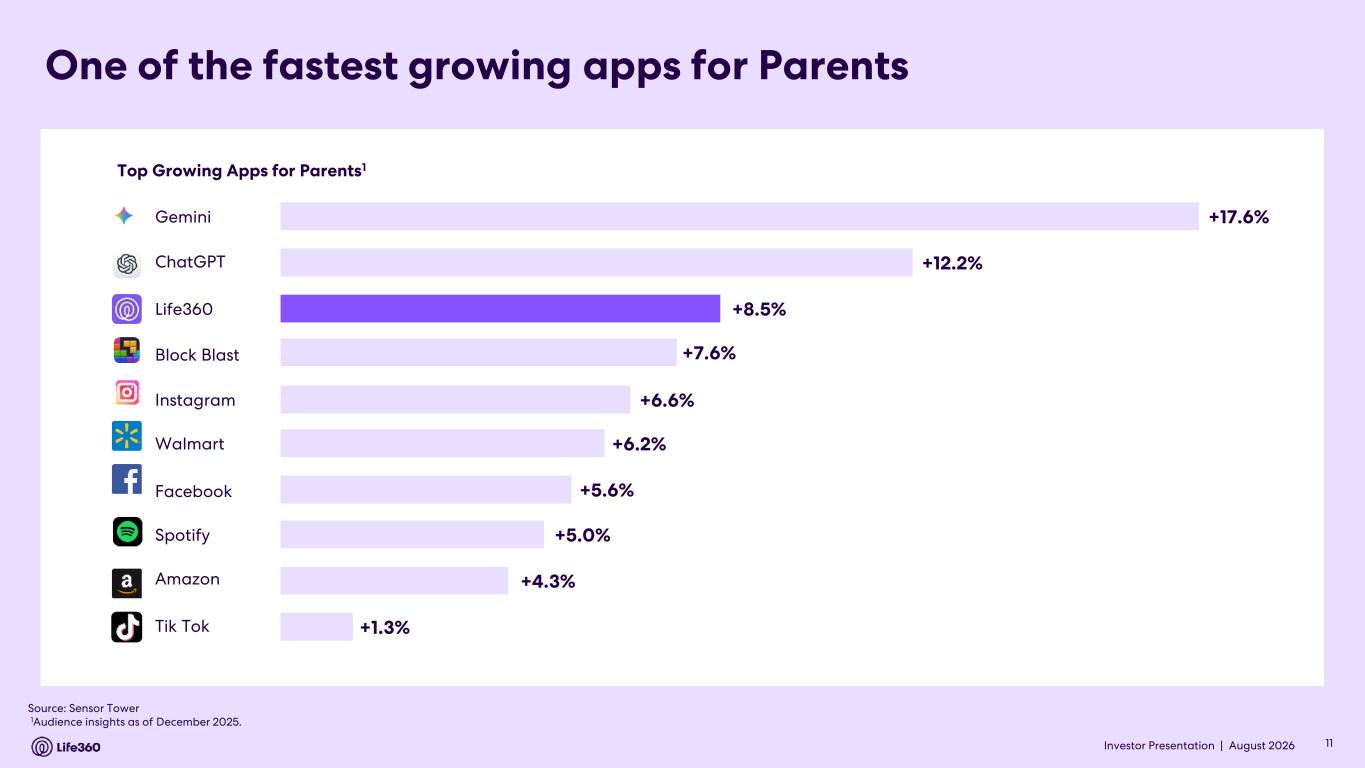
Investor Presentation | August 2026 Top Growing Apps for Parents1 Source: Sensor Tower 1Audience insights as of December 2025. +17.6% +12.2% +8.5% +7.6% +6.6% +6.2% +5.6% +5.0% +4.3% +1.3% Gemini ChatGPT Life360 Block Blast Instagram Walmart Spotify Amazon Tik Tok Facebook One of the fastest growing apps for Parents 11
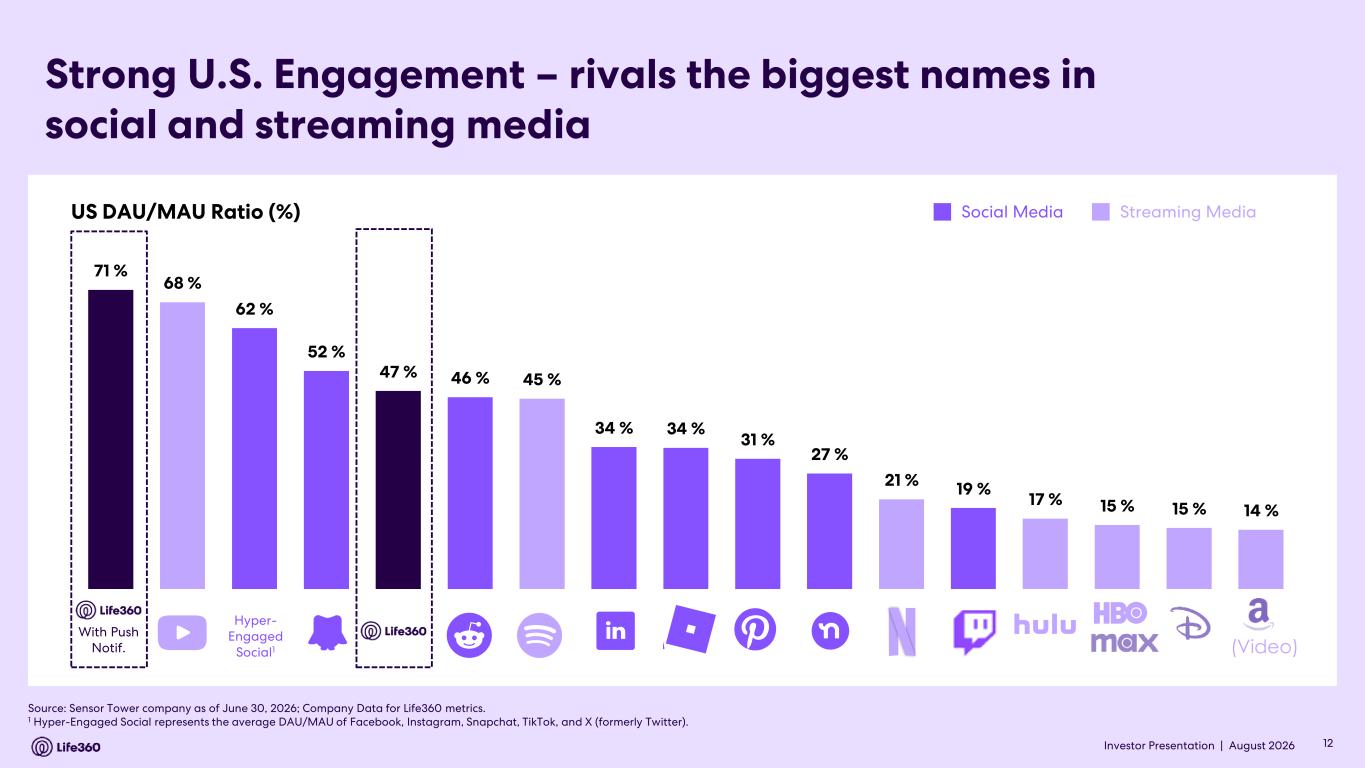
Investor Presentation | August 2026 Strong U.S. Engagement – rivals the biggest names in social and streaming media Source: Sensor Tower company as of June 30, 2026; Company Data for Life360 metrics. 1 Hyper-Engaged Social represents the average DAU/MAU of Facebook, Instagram, Snapchat, TikTok, and X (formerly Twitter). US DAU/MAU Ratio (%) Social Media Streaming Media (Video) Hyper- Engaged Social1 With Push Notif. 12 71 % 68 % 62 % 52 % 47 % 46 % 45 % 34 % 34 % 31 % 27 % 21 % 19 % 17 % 15 % 15 % 14 %
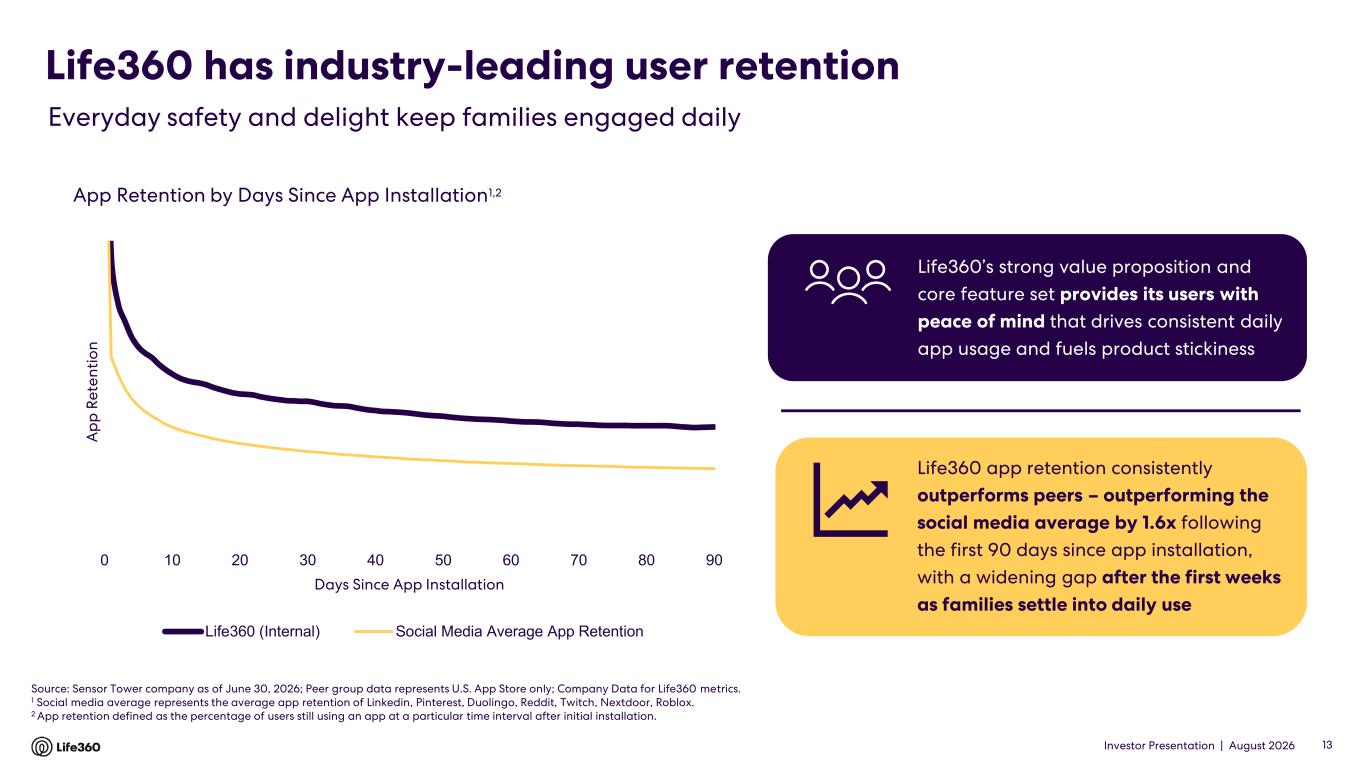
Investor Presentation | August 2026 Life360 has industry-leading user retention 13 Everyday safety and delight keep families engaged daily App Retention by Days Since App Installation1,2 Source: Sensor Tower company as of June 30, 2026; Peer group data represents U.S. App Store only; Company Data for Life360 metrics. 1 Social media average represents the average app retention of Linkedin, Pinterest, Duolingo, Reddit, Twitch, Nextdoor, Roblox. 2 App retention defined as the percentage of users still using an app at a particular time interval after initial installation. Life360 app retention consistently outperforms peers – outperforming the social media average by 1.6x following the first 90 days since app installation, with a widening gap after the first weeks as families settle into daily use Life360’s strong value proposition and core feature set provides its users with peace of mind that drives consistent daily app usage and fuels product stickiness 0 10 20 30 40 50 60 70 80 90 A p p R e te n ti o n Days Since App Installation Life360 (Internal) Social Media Average App Retention
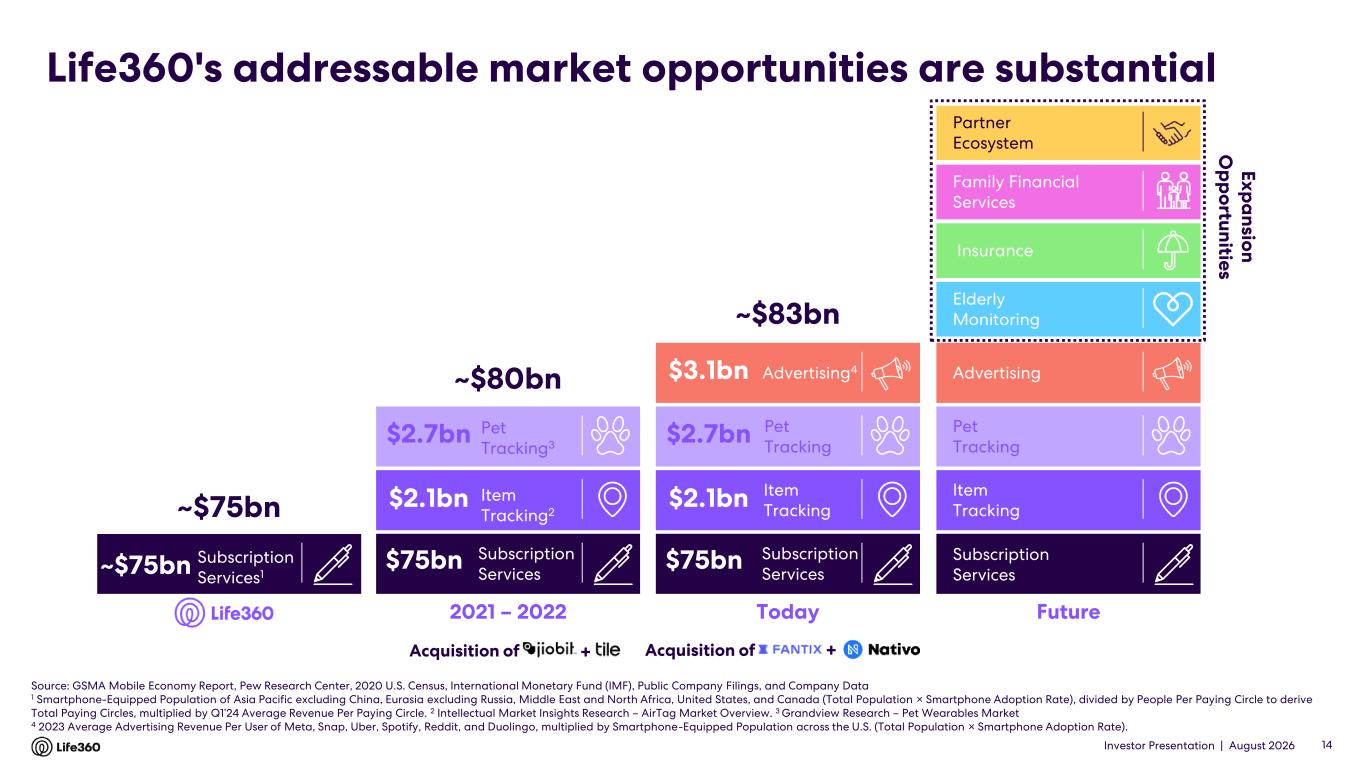
Investor Presentation | August 2026 Life360's addressable market opportunities are substantial Source: GSMA Mobile Economy Report, Pew Research Center, 2020 U.S. Census, International Monetary Fund (IMF), Public Company Filings, and Company Data 1 Smartphone-Equipped Population of Asia Pacific excluding China, Eurasia excluding Russia, Middle East and North Africa, United States, and Canada (Total Population × Smartphone Adoption Rate), divided by People Per Paying Circle to derive Total Paying Circles, multiplied by Q1’24 Average Revenue Per Paying Circle. 2 Intellectual Market Insights Research – AirTag Market Overview. 3 Grandview Research – Pet Wearables Market 4 2023 Average Advertising Revenue Per User of Meta, Snap, Uber, Spotify, Reddit, and Duolingo, multiplied by Smartphone-Equipped Population across the U.S. (Total Population × Smartphone Adoption Rate). 14 2021 – 2022 ~$80bn Subscription Services $2.7bn $2.1bn $75bn Today ~$83bn Advertising4 Item Tracking Pet Tracking Subscription Services $2.7bn $2.1bn $75bn $3.1bn Subscription Services1 ~$75bn ~$75bn Acquisition of + Future E x p a n sio n O p p o rtu n itie s Family Financial Services Elderly Monitoring Insurance Advertising Item Tracking Pet Tracking Subscription Services Acquisition of + Partner Ecosystem Item Tracking2 Pet Tracking3
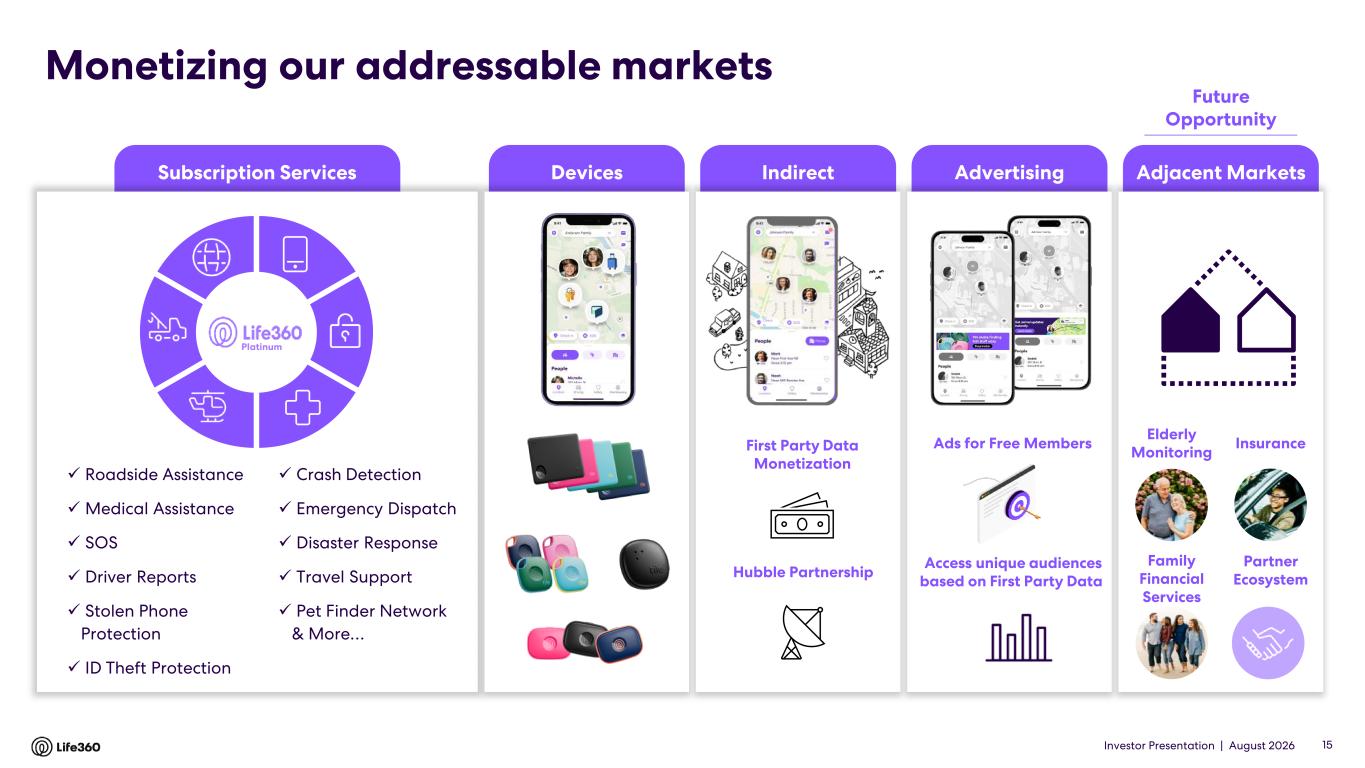
Investor Presentation | August 2026 Subscription Services IndirectDevices Advertising Adjacent Markets Monetizing our addressable markets ✓ Roadside Assistance ✓ Medical Assistance ✓ SOS ✓ Driver Reports ✓ Stolen Phone Protection ✓ ID Theft Protection ✓ Crash Detection ✓ Emergency Dispatch ✓ Disaster Response ✓ Travel Support ✓ Pet Finder Network & More… Platinum Ads for Free Members Access unique audiences based on First Party Data Elderly Monitoring Family Financial Services InsuranceFirst Party Data Monetization Hubble Partnership 15 Future Opportunity Partner Ecosystem
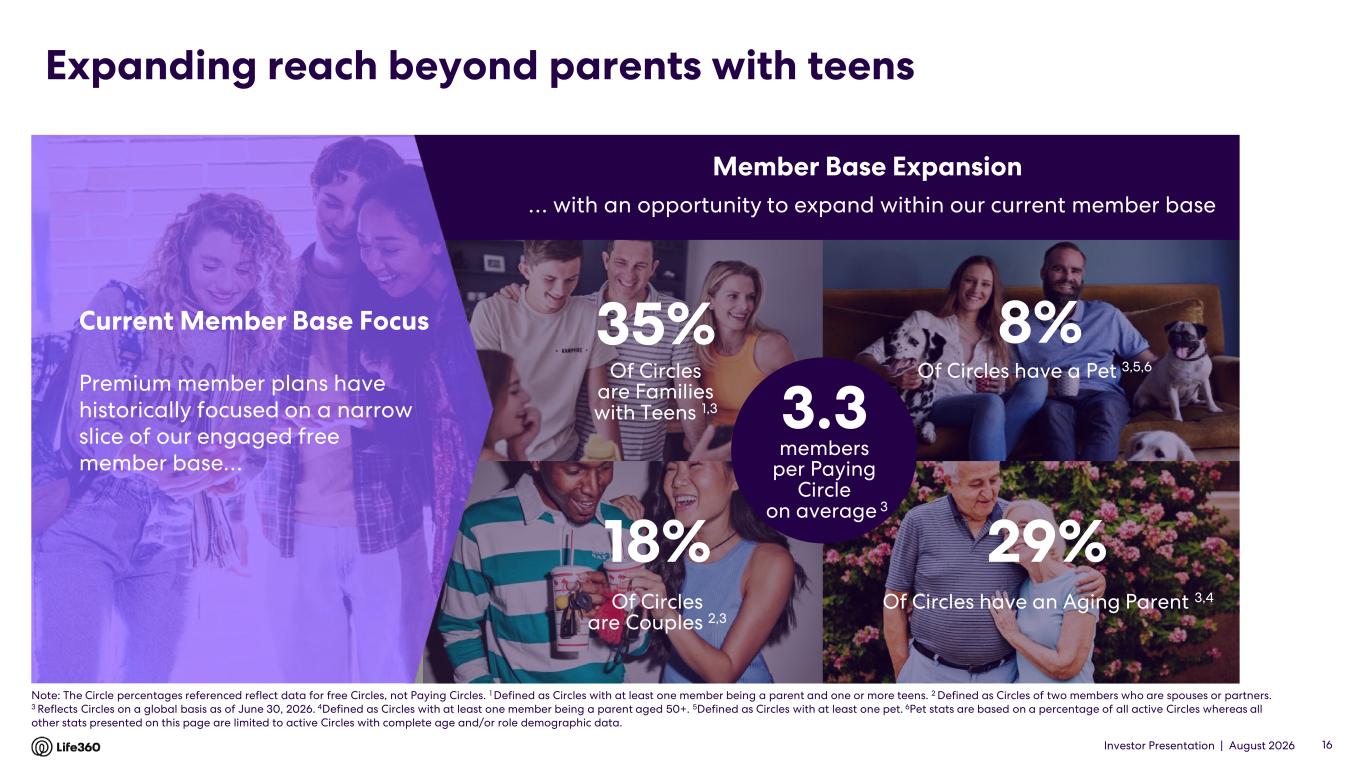
Investor Presentation | August 2026 Expanding reach beyond parents with teens 16 Of Circles are Families with Teens 1,3 35% Of Circles have a Pet 3,5,6 Of Circles have an Aging Parent 3,4 29% Of Circles are Couples 2,3 18% 8% … with an opportunity to expand within our current member base Premium member plans have historically focused on a narrow slice of our engaged free member base… Current Member Base Focus Member Base Expansion 3.3 members per Paying Circle on average 3 Note: The Circle percentages referenced reflect data for free Circles, not Paying Circles. 1 Defined as Circles with at least one member being a parent and one or more teens. 2 Defined as Circles of two members who are spouses or partners. 3 Reflects Circles on a global basis as of June 30, 2026. 4Defined as Circles with at least one member being a parent aged 50+. 5Defined as Circles with at least one pet. 6Pet stats are based on a percentage of all active Circles whereas all other stats presented on this page are limited to active Circles with complete age and/or role demographic data.
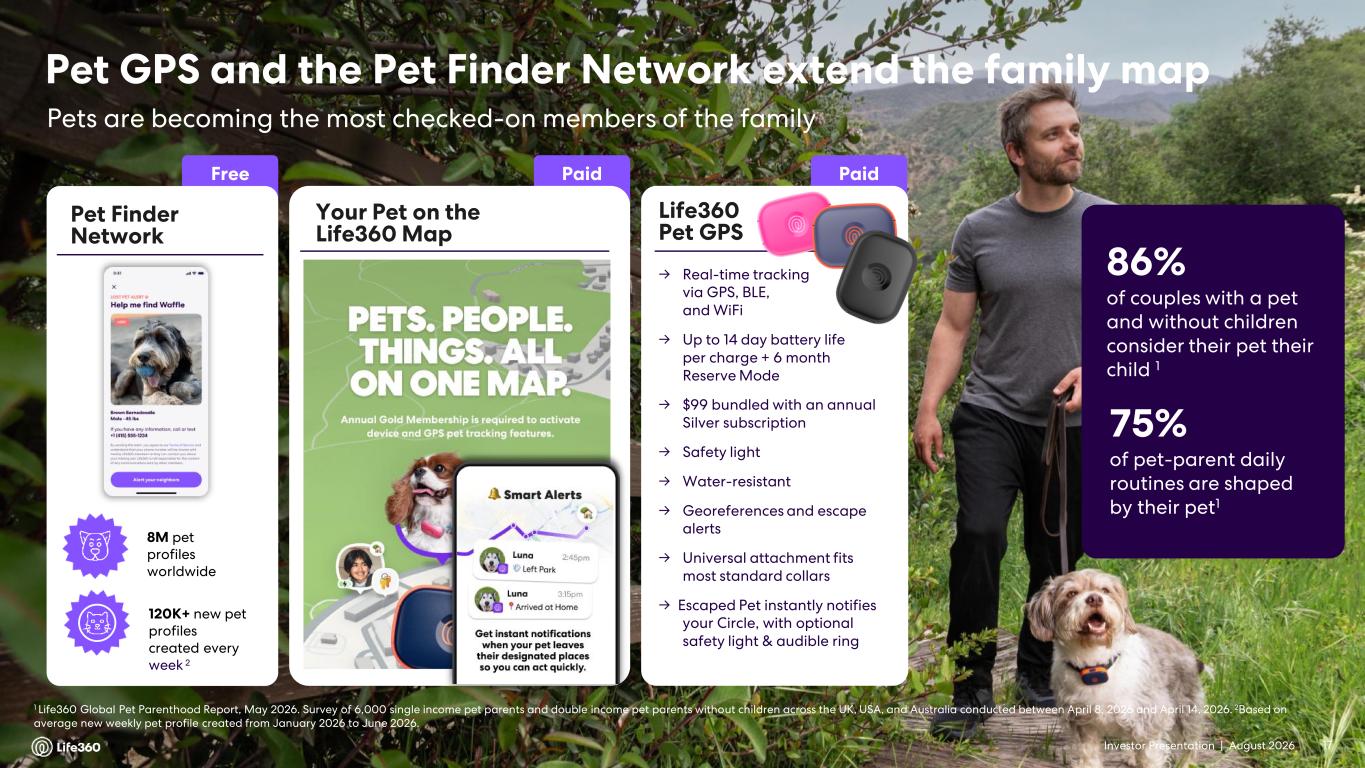
Investor Presentation | August 2026 Pet Finder Network Free >8M Pets added to Life360 Circles Pet GPS and the Pet Finder Network extend the family map Pets are becoming the most checked-on members of the family 1 Life360 Global Pet Parenthood Report, May 2026. Survey of 6,000 single income pet parents and double income pet parents without children across the UK, USA, and Australia conducted between April 8, 2026 and April 14, 2026. 2Based on average new weekly pet profile created from January 2026 to June 2026. 17 Paid Your Pet on the Life360 Map Paid Life360 Pet GPS → Real-time tracking via GPS, BLE, and WiFi → Up to 14 day battery life per charge + 6 month Reserve Mode → $99 bundled with an annual Silver subscription → Safety light → Water-resistant → Georeferences and escape alerts → Universal attachment fits most standard collars → Escaped Pet instantly notifies your Circle, with optional safety light & audible ring 8M pet profiles worldwide 120K+ new pet profiles created every week 2 86% of couples with a pet and without children consider their pet their child 1 75% of pet-parent daily routines are shaped by their pet1
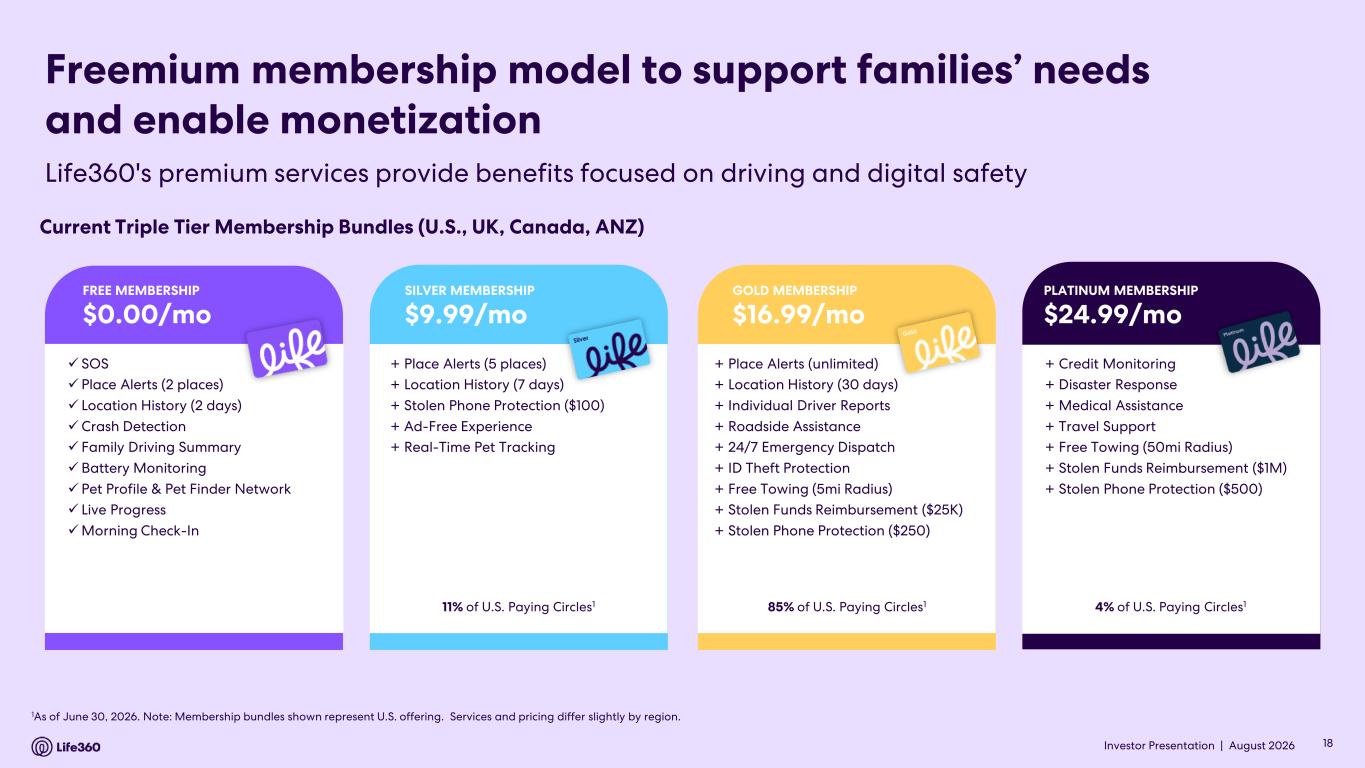
Investor Presentation | August 2026 1As of June 30, 2026. Note: Membership bundles shown represent U.S. offering. Services and pricing differ slightly by region. Freemium membership model to support families’ needs and enable monetization Current Triple Tier Membership Bundles (U.S., UK, Canada, ANZ) + Place Alerts (5 places) + Location History (7 days) + Stolen Phone Protection ($100) + Ad-Free Experience + Real-Time Pet Tracking 11% of U.S. Paying Circles1 SILVER MEMBERSHIP $9.99/mo + Place Alerts (unlimited) + Location History (30 days) + Individual Driver Reports + Roadside Assistance + 24/7 Emergency Dispatch + ID Theft Protection + Free Towing (5mi Radius) + Stolen Funds Reimbursement ($25K) + Stolen Phone Protection ($250) 85% of U.S. Paying Circles1 GOLD MEMBERSHIP $16.99/mo + Credit Monitoring + Disaster Response + Medical Assistance + Travel Support + Free Towing (50mi Radius) + Stolen Funds Reimbursement ($1M) + Stolen Phone Protection ($500) 4% of U.S. Paying Circles1 PLATINUM MEMBERSHIP $24.99/mo ✓ SOS ✓Place Alerts (2 places) ✓ Location History (2 days) ✓Crash Detection ✓ Family Driving Summary ✓Battery Monitoring ✓Pet Profile & Pet Finder Network ✓ Live Progress ✓Morning Check-In FREE MEMBERSHIP $0.00/mo Life360's premium services provide benefits focused on driving and digital safety 18
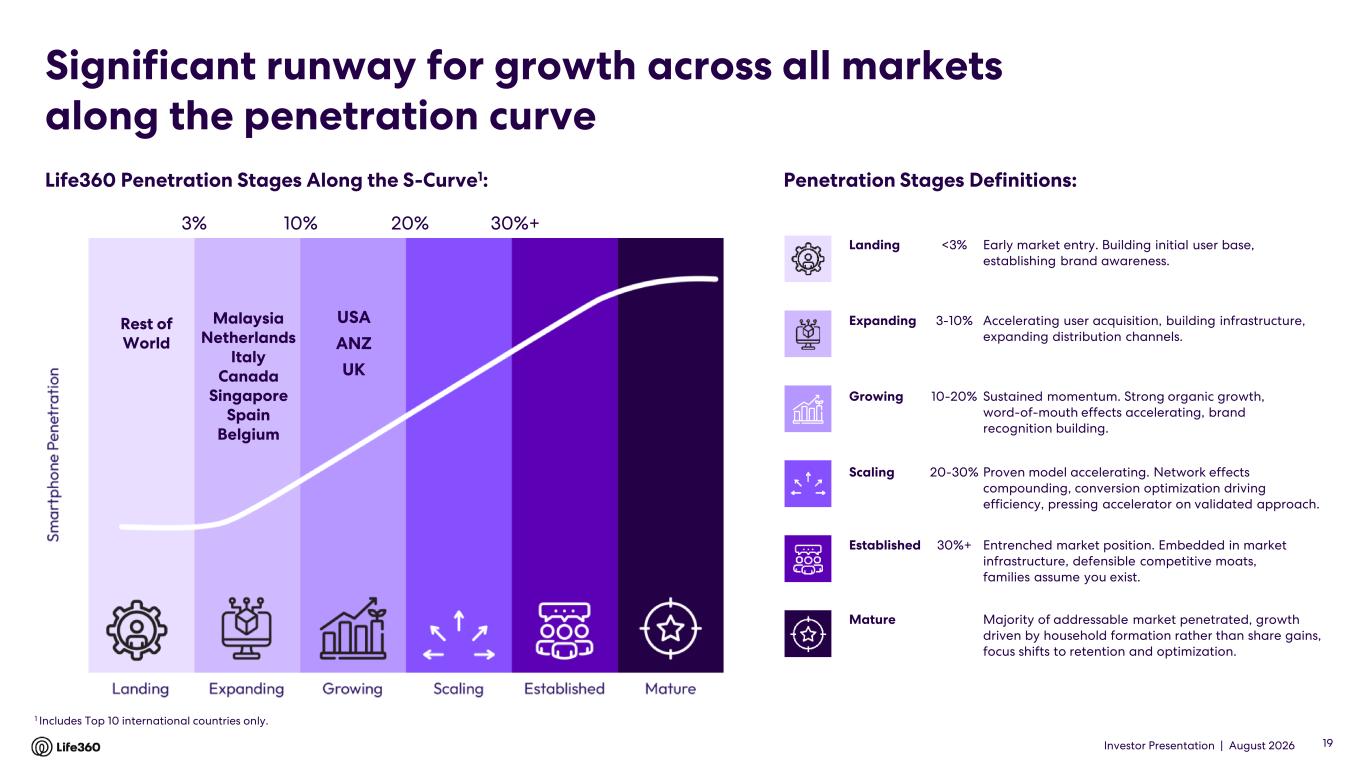
Investor Presentation | August 2026 Significant runway for growth across all markets along the penetration curve Landing <3% Early market entry. Building initial user base, establishing brand awareness. Expanding 3-10% Accelerating user acquisition, building infrastructure, expanding distribution channels. Growing 10-20% Sustained momentum. Strong organic growth, word-of-mouth effects accelerating, brand recognition building. Scaling 20-30% Proven model accelerating. Network effects compounding, conversion optimization driving efficiency, pressing accelerator on validated approach. Established 30%+ Entrenched market position. Embedded in market infrastructure, defensible competitive moats, families assume you exist. Mature Majority of addressable market penetrated, growth driven by household formation rather than share gains, focus shifts to retention and optimization. Life360 Penetration Stages Along the S-Curve1: Penetration Stages Definitions: Malaysia Netherlands Italy Canada Singapore Spain Belgium USA ANZ UK 10% 20% 30%+3% 19 1 Includes Top 10 international countries only. Rest of World
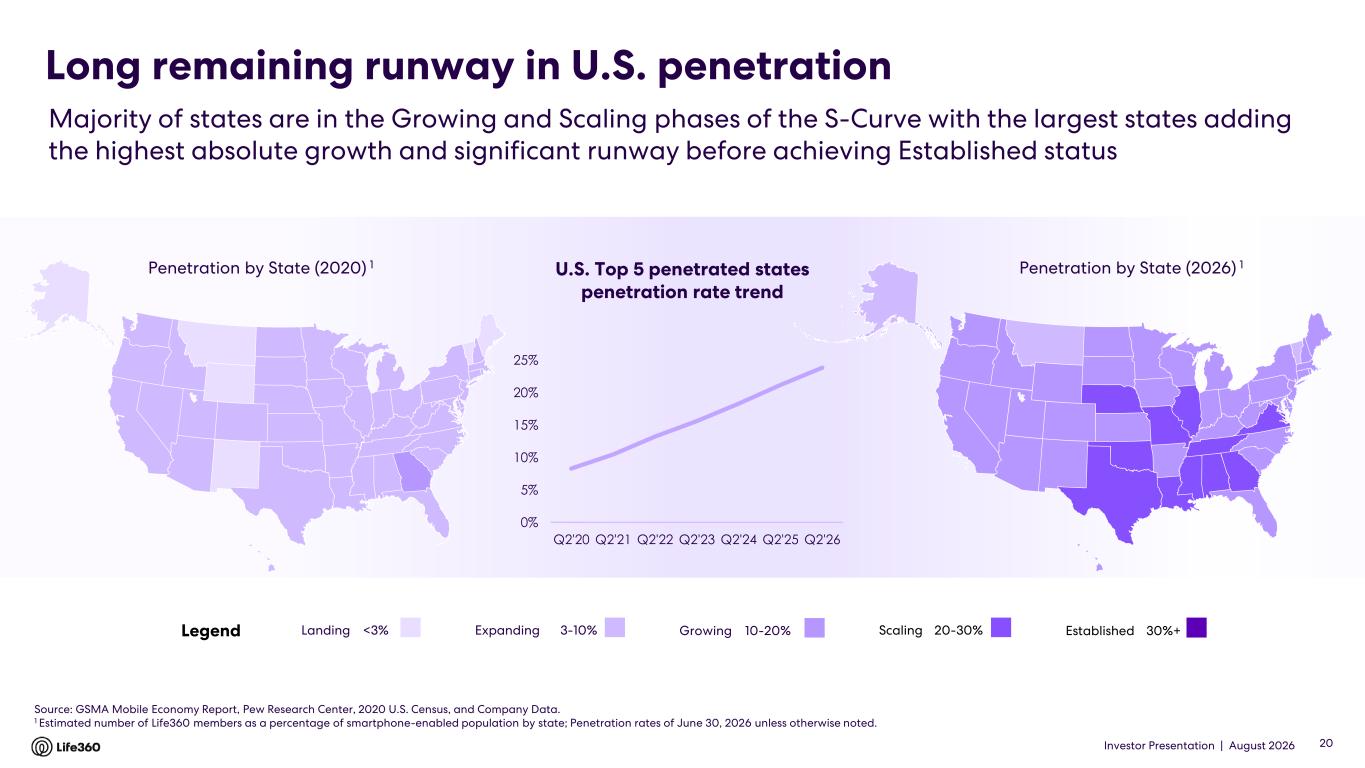
Investor Presentation | August 2026 Long remaining runway in U.S. penetration Source: GSMA Mobile Economy Report, Pew Research Center, 2020 U.S. Census, and Company Data. 1 Estimated number of Life360 members as a percentage of smartphone-enabled population by state; Penetration rates of June 30, 2026 unless otherwise noted. Penetration by State (2020) 1 Penetration by State (2026) 1 Landing <3% Majority of states are in the Growing and Scaling phases of the S-Curve with the largest states adding the highest absolute growth and significant runway before achieving Established status 20 U.S. Top 5 penetrated states penetration rate trend Legend Expanding 3-10% Growing 10-20% Scaling 20-30% Established 30%+ 0% 5% 10% 15% 20% 25% Q2'20 Q2'21 Q2'22 Q2'23 Q2'24 Q2'25 Q2'26
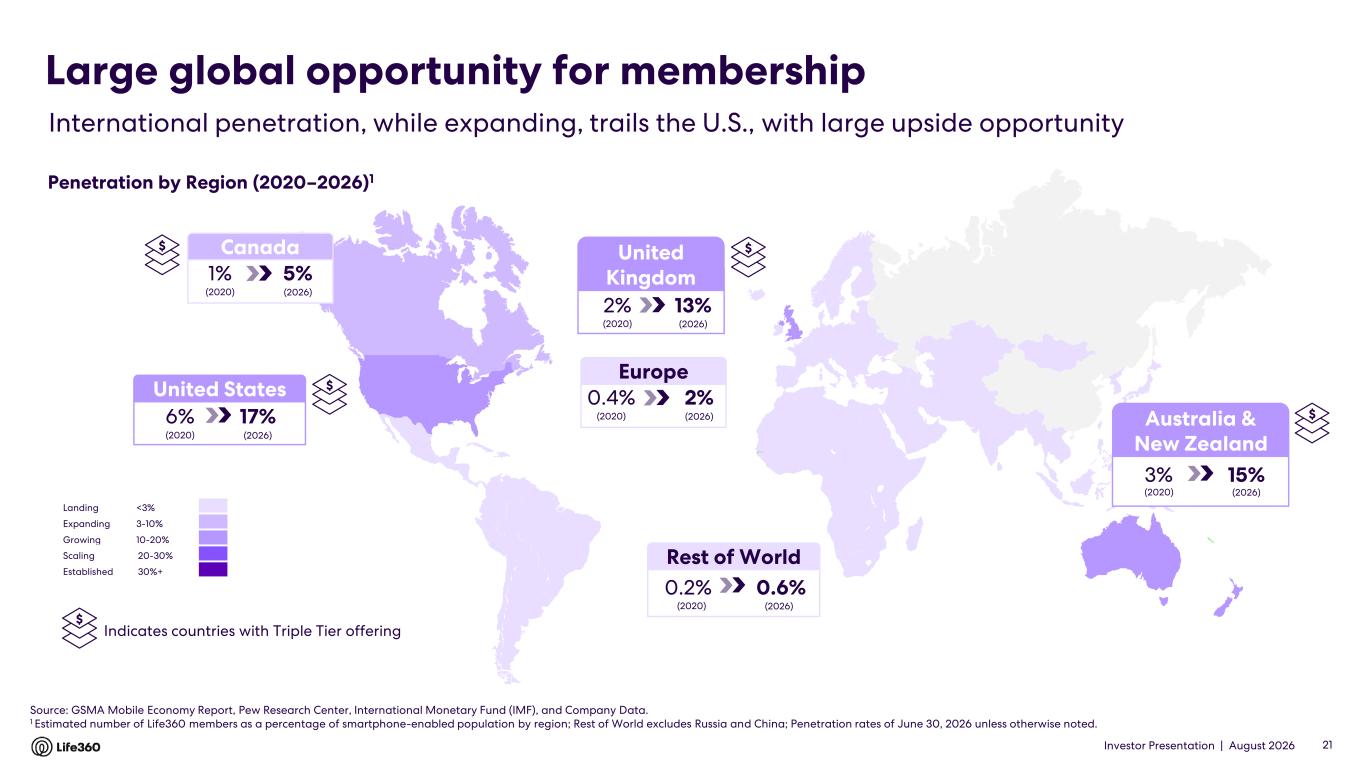
Investor Presentation | August 2026 Europe 2%0.4% (2020) (2026) Source: GSMA Mobile Economy Report, Pew Research Center, International Monetary Fund (IMF), and Company Data. 1 Estimated number of Life360 members as a percentage of smartphone-enabled population by region; Rest of World excludes Russia and China; Penetration rates of June 30, 2026 unless otherwise noted. Rest of World 0.6%0.2% (2020) (2026) International penetration, while expanding, trails the U.S., with large upside opportunity Large global opportunity for membership Penetration by Region (2020–2026)1 21 United Kingdom 13%2% (2020) (2026) $ Indicates countries with Triple Tier offering United States 17%6% (2020) (2026) Landing <3% Expanding 3-10% Growing 10-20% Scaling 20-30% Established 30%+ Australia & New Zealand 15%3% (2020) (2026) Canada 5%1% (2020) (2026) $ $ $ $
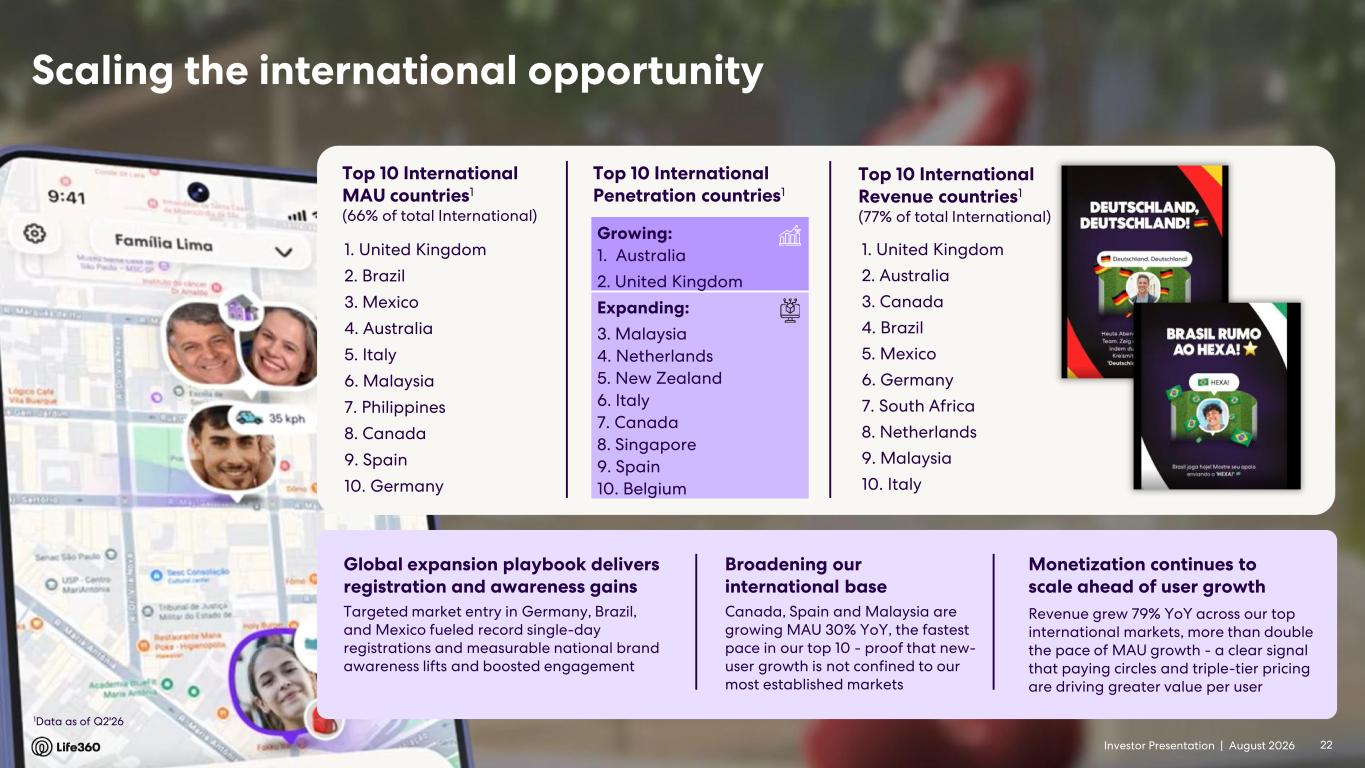
Investor Presentation | August 2026 Growing: 1. Australia 2. United Kingdom Expanding: 3. Malaysia 4. Netherlands 5. New Zealand 6. Italy 7. Canada 8. Singapore 9. Spain 10. Belgium Top 10 International MAU countries1 (66% of total International) 1. United Kingdom 2. Brazil 3. Mexico 4. Australia 5. Italy 6. Malaysia 7. Philippines 8. Canada 9. Spain 10. Germany 1Data as of Q2'26 Scaling the international opportunity 22 Top 10 International Penetration countries1 Broadening our international base Monetization continues to scale ahead of user growth Revenue grew 79% YoY across our top international markets, more than double the pace of MAU growth - a clear signal that paying circles and triple-tier pricing are driving greater value per user Global expansion playbook delivers registration and awareness gains 1. United Kingdom 2. Australia 3. Canada 4. Brazil 5. Mexico 6. Germany 7. South Africa 8. Netherlands 9. Malaysia 10. Italy Top 10 International Revenue countries1 (77% of total International) Canada, Spain and Malaysia are growing MAU 30% YoY, the fastest pace in our top 10 - proof that new- user growth is not confined to our most established markets Targeted market entry in Germany, Brazil, and Mexico fueled record single-day registrations and measurable national brand awareness lifts and boosted engagement
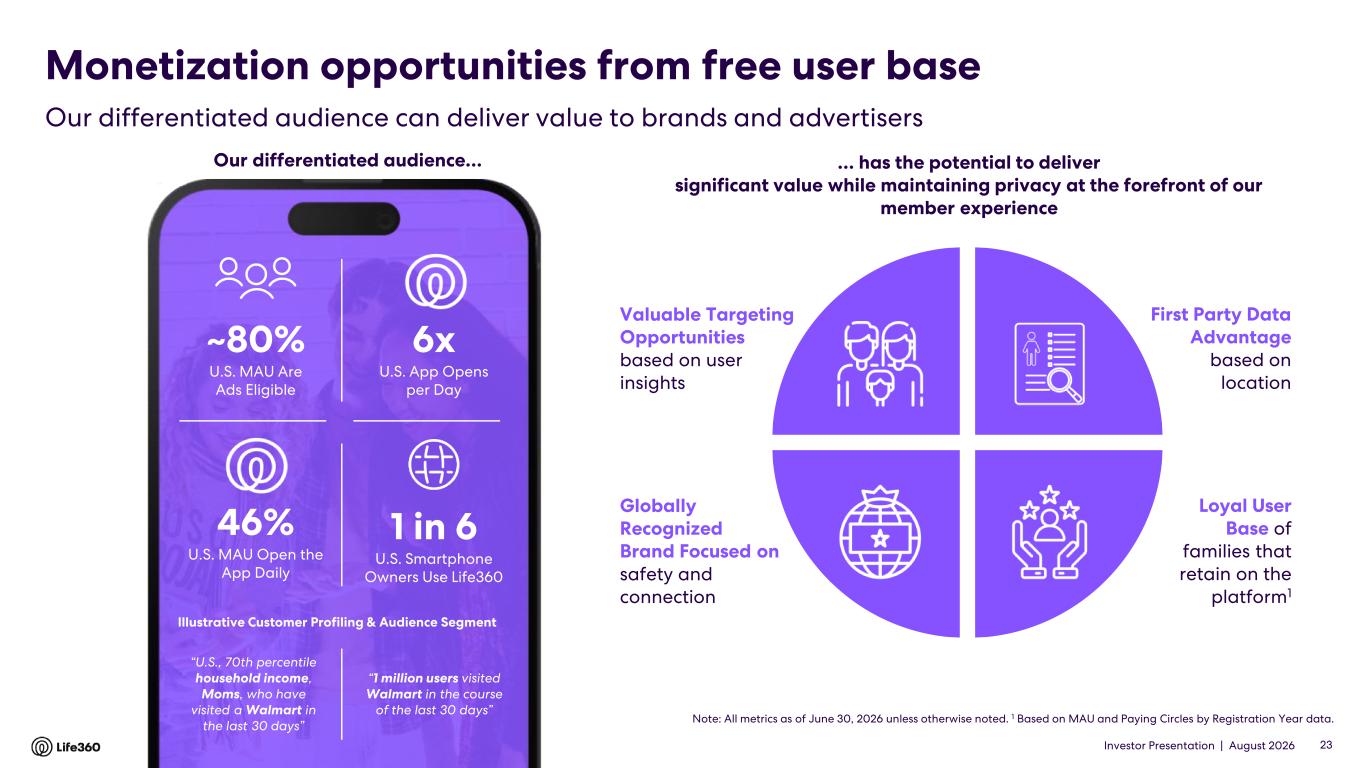
Investor Presentation | August 2026 Monetization opportunities from free user base Loyal User Base of families that retain on the platform1 Globally Recognized Brand Focused on safety and connection First Party Data Advantage based on location Valuable Targeting Opportunities based on user insights … has the potential to deliver significant value while maintaining privacy at the forefront of our member experience Note: All metrics as of June 30, 2026 unless otherwise noted. 1 Based on MAU and Paying Circles by Registration Year data. ~80% U.S. MAU Are Ads Eligible 1 in 6 U.S. Smartphone Owners Use Life360 6x U.S. App Opens per Day 46% U.S. MAU Open the App Daily “U.S., 70th percentile household income, Moms, who have visited a Walmart in the last 30 days” Illustrative Customer Profiling & Audience Segment “1 million users visited Walmart in the course of the last 30 days” Our differentiated audience… 23 Our differentiated audience can deliver value to brands and advertisers
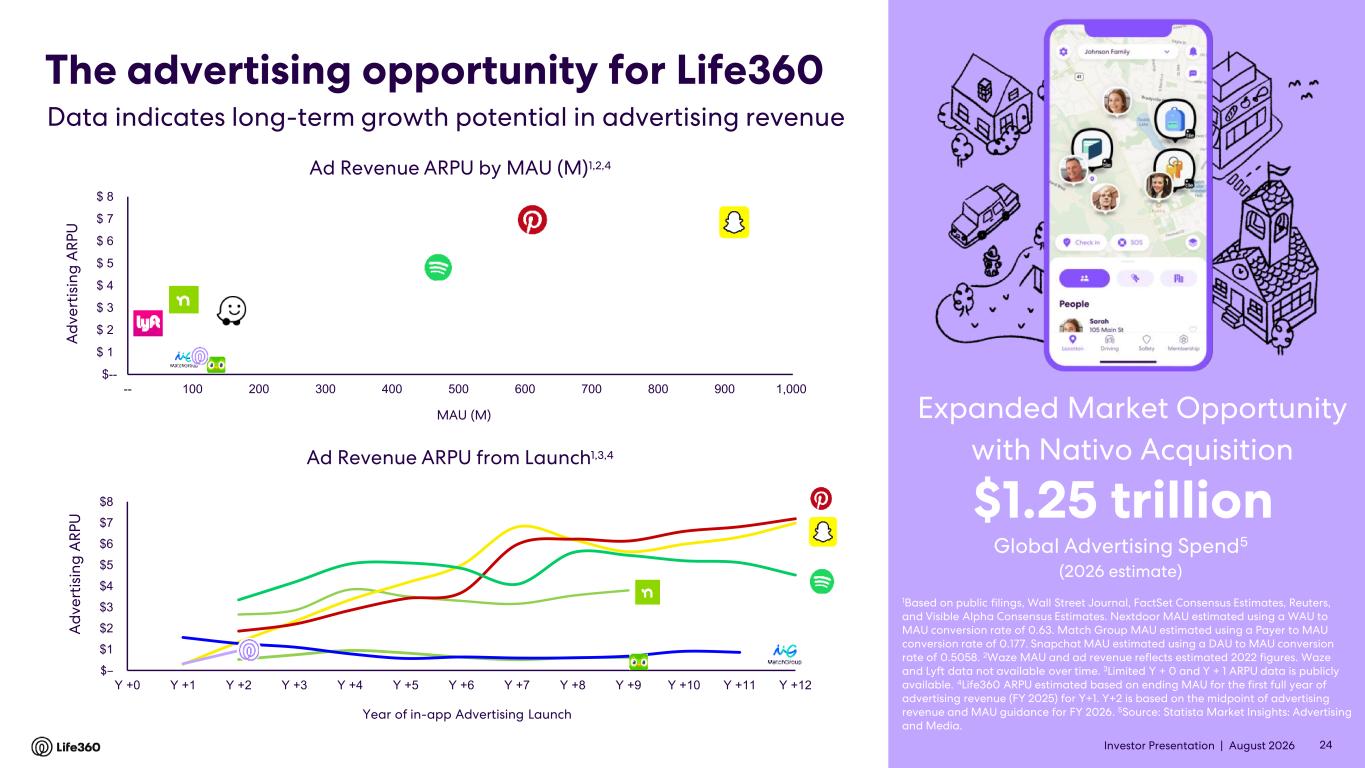
Investor Presentation | August 2026 $-- $ 1 $ 2 $ 3 $ 4 $ 5 $ 6 $ 7 $ 8 -- 100 200 300 400 500 600 700 800 900 1,000 Ad Revenue ARPU by MAU (M)1,2,4 MAU (M) The advertising opportunity for Life360 1Based on public filings, Wall Street Journal, FactSet Consensus Estimates, Reuters, and Visible Alpha Consensus Estimates. Nextdoor MAU estimated using a WAU to MAU conversion rate of 0.63. Match Group MAU estimated using a Payer to MAU conversion rate of 0.177. Snapchat MAU estimated using a DAU to MAU conversion rate of 0.5058. 2Waze MAU and ad revenue reflects estimated 2022 figures. Waze and Lyft data not available over time. 3Limited Y + 0 and Y + 1 ARPU data is publicly available. 4Life360 ARPU estimated based on ending MAU for the first full year of advertising revenue (FY 2025) for Y+1. Y+2 is based on the midpoint of advertising revenue and MAU guidance for FY 2026. 5Source: Statista Market Insights: Advertising and Media. Global Advertising Spend5 $1.25 trillion (2026 estimate) Data indicates long-term growth potential in advertising revenue A d v e rt is in g A R P U 24 Expanded Market Opportunity with Nativo Acquisition $– $1 $2 $3 $4 $5 $6 $7 $8 Y +0 Y +1 Y +2 Y +3 Y +4 Y +5 Y +6 Y +7 Y +8 Y +9 Y +10 Y +11 Y +12 Ad Revenue ARPU from Launch1,3,4 Year of in-app Advertising Launch A d v e rt is in g A R P U
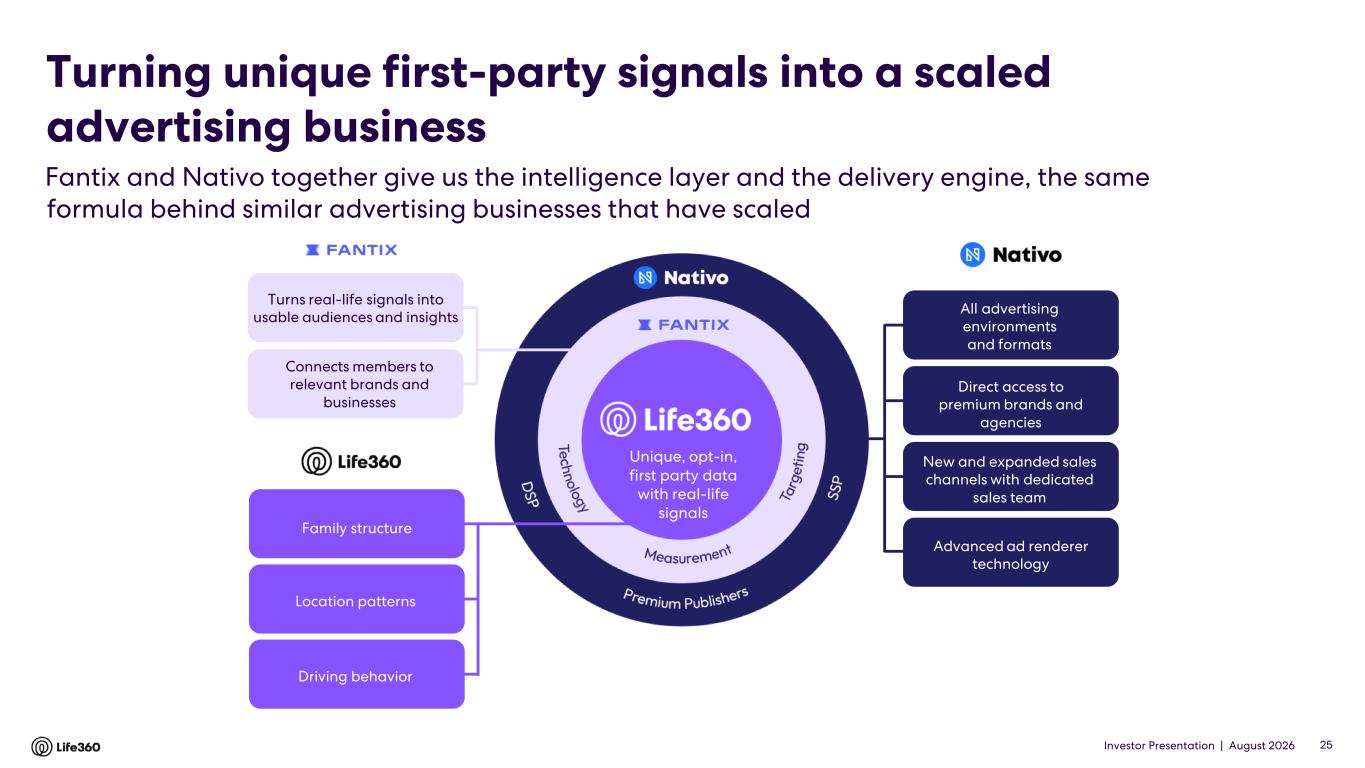
Investor Presentation | August 2026 25 25 First party data with location and context Unique, opt-in, first party data with real-life signals Turns real-life signals into usable audiences and insights Connects members to relevant brands and businesses All advertising environments and formats Advanced ad renderer technology Direct access to premium brands and agencies New and expanded sales channels with dedicated sales team Family structure Location patterns Driving behavior Fantix and Nativo together give us the intelligence layer and the delivery engine, the same formula behind similar advertising businesses that have scaled Turning unique first-party signals into a scaled advertising business
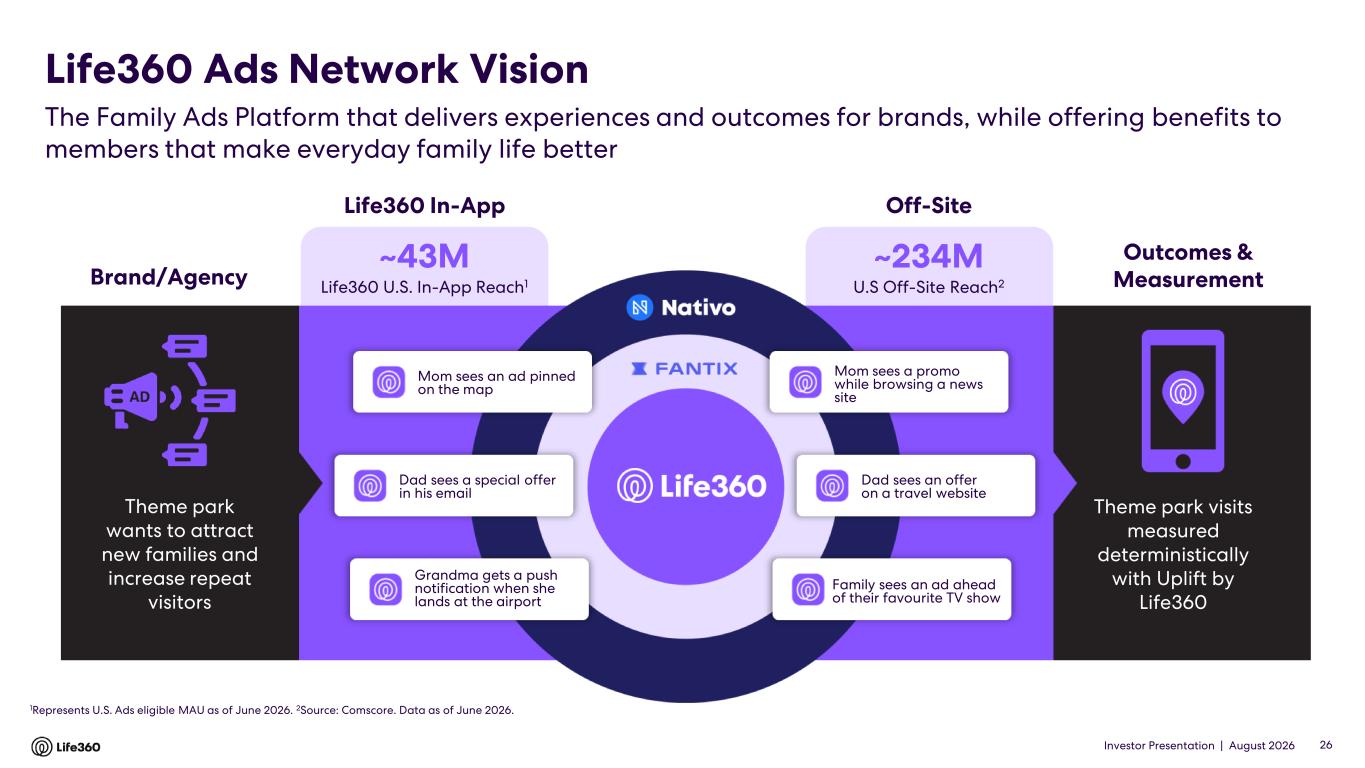
Investor Presentation | August 2026 ~43M Life360 U.S. In-App Reach1 ~234M U.S Off-Site Reach2Brand/Agency Theme park wants to attract new families and increase repeat visitors Theme park visits measured deterministically with Uplift by Life360 Off-SiteLife360 In-App Outcomes & Measurement The Family Ads Platform that delivers experiences and outcomes for brands, while offering benefits to members that make everyday family life better Life360 Ads Network Vision 26 1Represents U.S. Ads eligible MAU as of June 2026. 2Source: Comscore. Data as of June 2026. Mom sees an ad pinned on the map Dad sees a special offer in his email Grandma gets a push notification when she lands at the airport Mom sees a promo while browsing a news site Dad sees an offer on a travel website Family sees an ad ahead of their favourite TV show
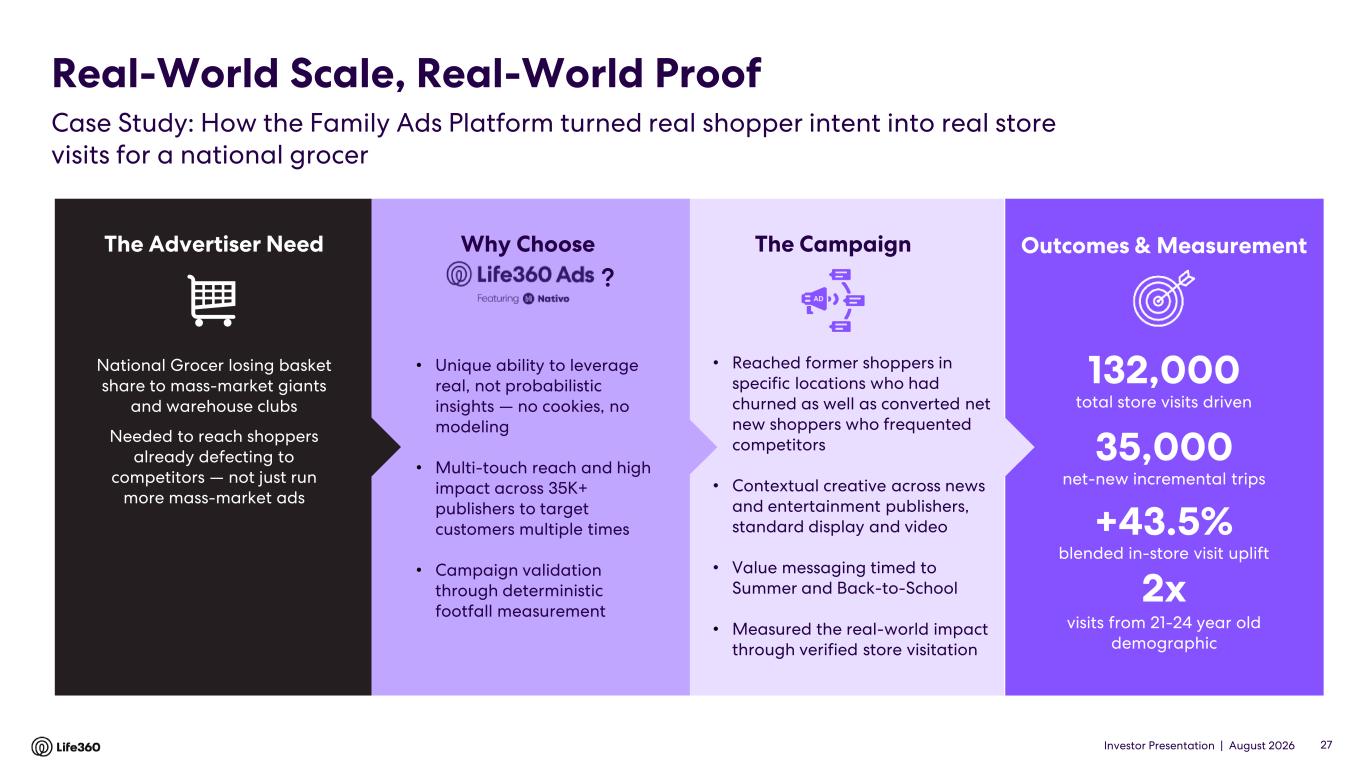
Investor Presentation | August 2026 The Advertiser Need National Grocer losing basket share to mass-market giants and warehouse clubs Needed to reach shoppers already defecting to competitors — not just run more mass-market ads 132,000 total store visits driven 35,000 net-new incremental trips +43.5% blended in-store visit uplift 2x visits from 21-24 year old demographic Real-World Scale, Real-World Proof Case Study: How the Family Ads Platform turned real shopper intent into real store visits for a national grocer The Campaign Outcomes & Measurement 27 • Unique ability to leverage real, not probabilistic insights — no cookies, no modeling • Multi-touch reach and high impact across 35K+ publishers to target customers multiple times • Campaign validation through deterministic footfall measurement • Reached former shoppers in specific locations who had churned as well as converted net new shoppers who frequented competitors • Contextual creative across news and entertainment publishers, standard display and video • Value messaging timed to Summer and Back-to-School • Measured the real-world impact through verified store visitation Why Choose ?

Investor Presentation | August 2026 02 Life360 Strategy
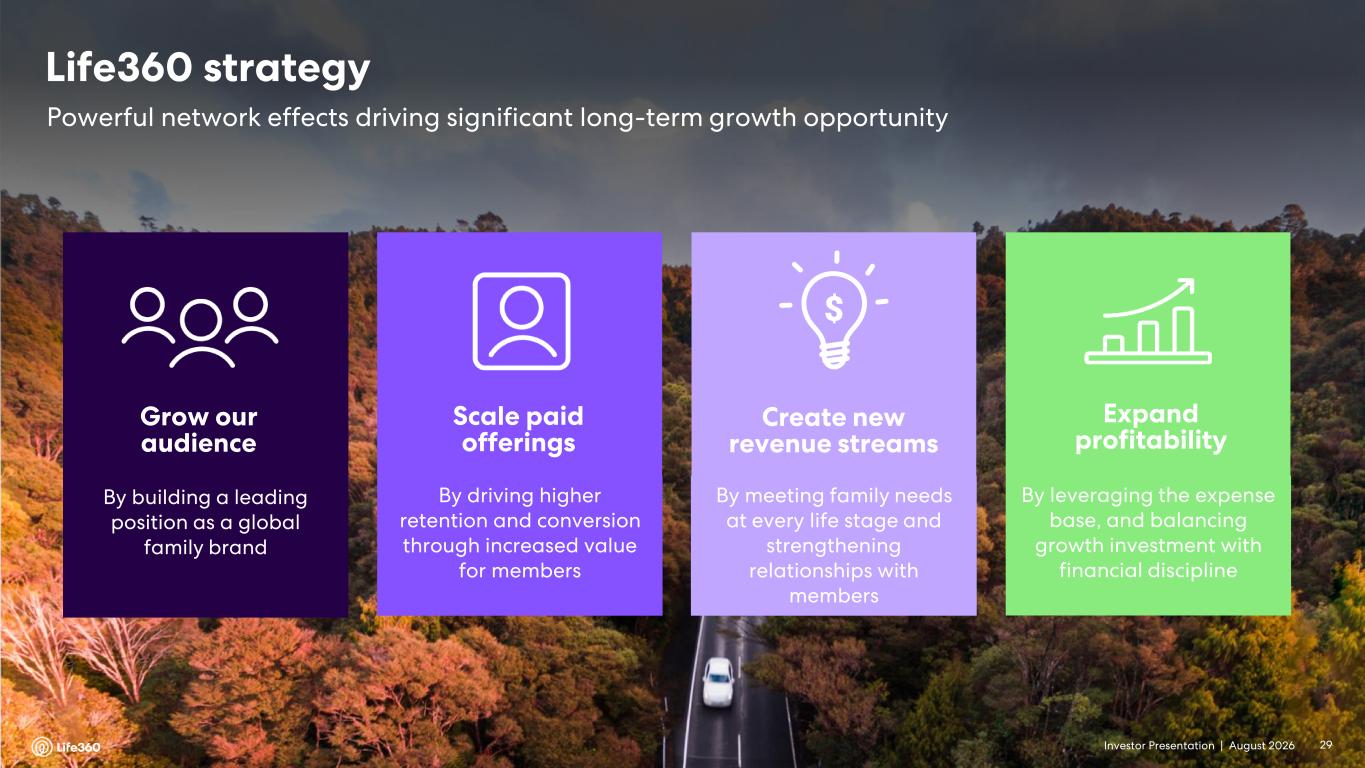
Investor Presentation | August 2026 Grow our audience By building a leading position as a global family brand Scale paid offerings By driving higher retention and conversion through increased value for members Create new revenue streams By meeting family needs at every life stage and strengthening relationships with members Expand profitability By leveraging the expense base, and balancing growth investment with financial discipline Powerful network effects driving significant long-term growth opportunity Life360 strategy 29
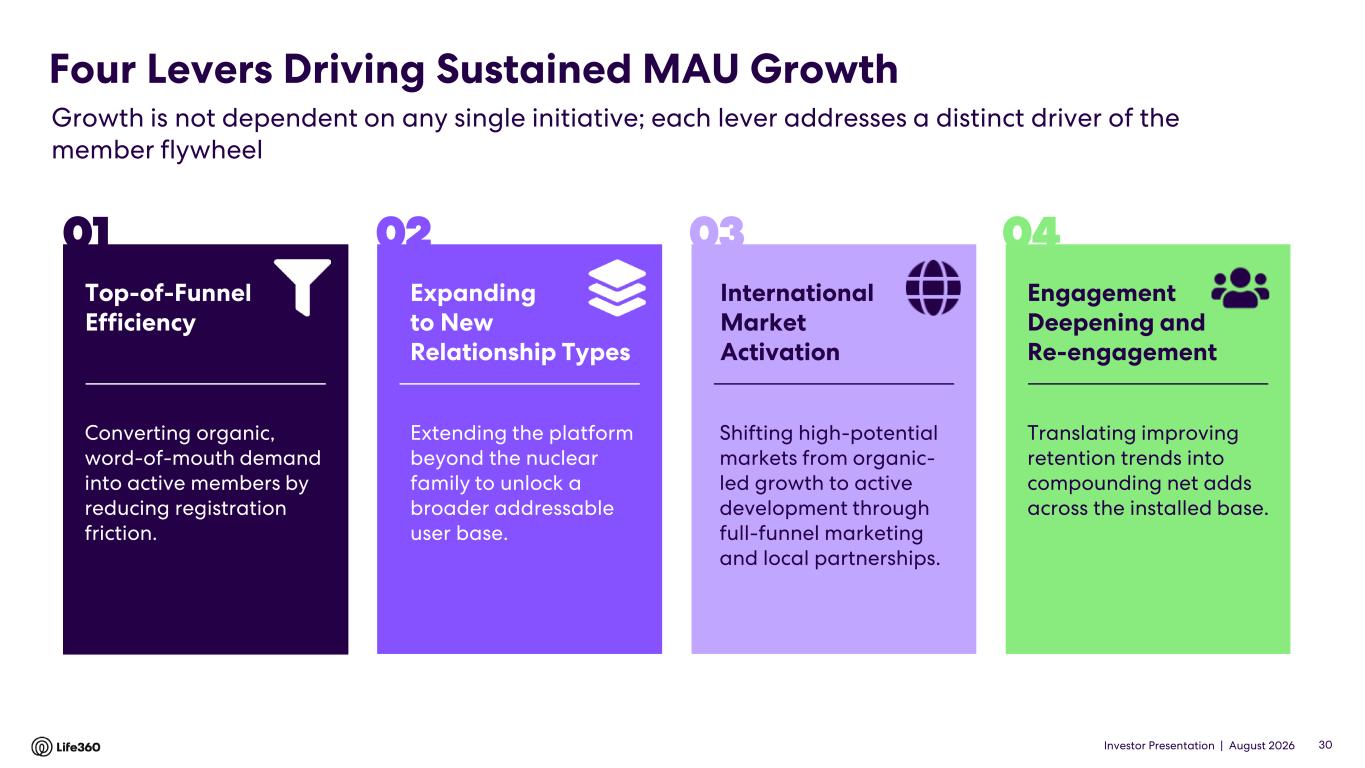
Investor Presentation | August 2026 Converting organic, word-of-mouth demand into active members by reducing registration friction. Expanding to New Relationship Types Extending the platform beyond the nuclear family to unlock a broader addressable user base. International Market Activation Shifting high-potential markets from organic- led growth to active development through full-funnel marketing and local partnerships. Engagement Deepening and Re-engagement Translating improving retention trends into compounding net adds across the installed base. Four Levers Driving Sustained MAU Growth Growth is not dependent on any single initiative; each lever addresses a distinct driver of the member flywheel Top-of-Funnel Efficiency 01 02 03 04 30
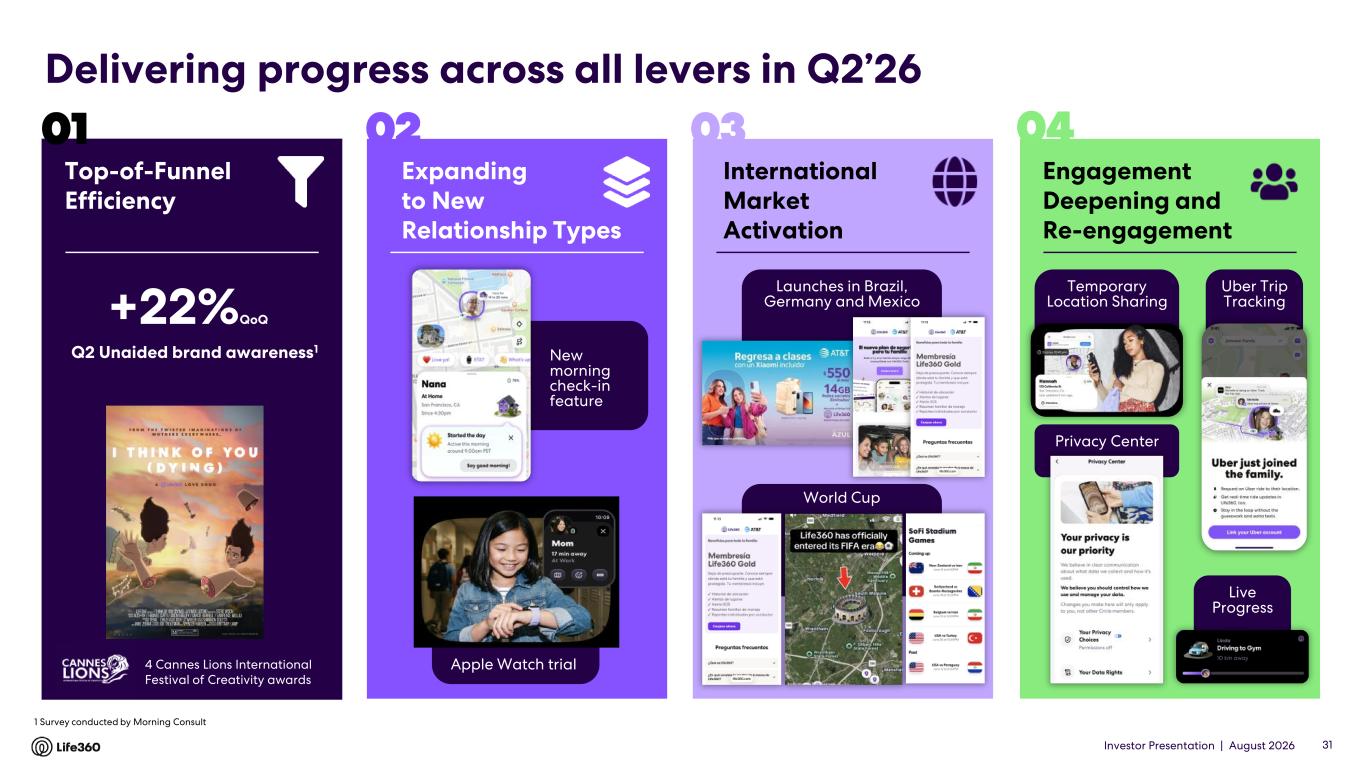
Investor Presentation | August 2026 International Market Activation 03 Expanding to New Relationship Types 02 Top-of-Funnel Efficiency 01 Engagement Deepening and Re-engagement 04 31 4 Cannes Lions International Festival of Creativity awards Q2 Unaided brand awareness1 1 Survey conducted by Morning Consult New morning check-in feature Apple Watch trial World Cup Launches in Brazil, Germany and Mexico Temporary Location Sharing Privacy Center Uber Trip Tracking Live Progress Delivering progress across all levers in Q2’26 +22%QoQ
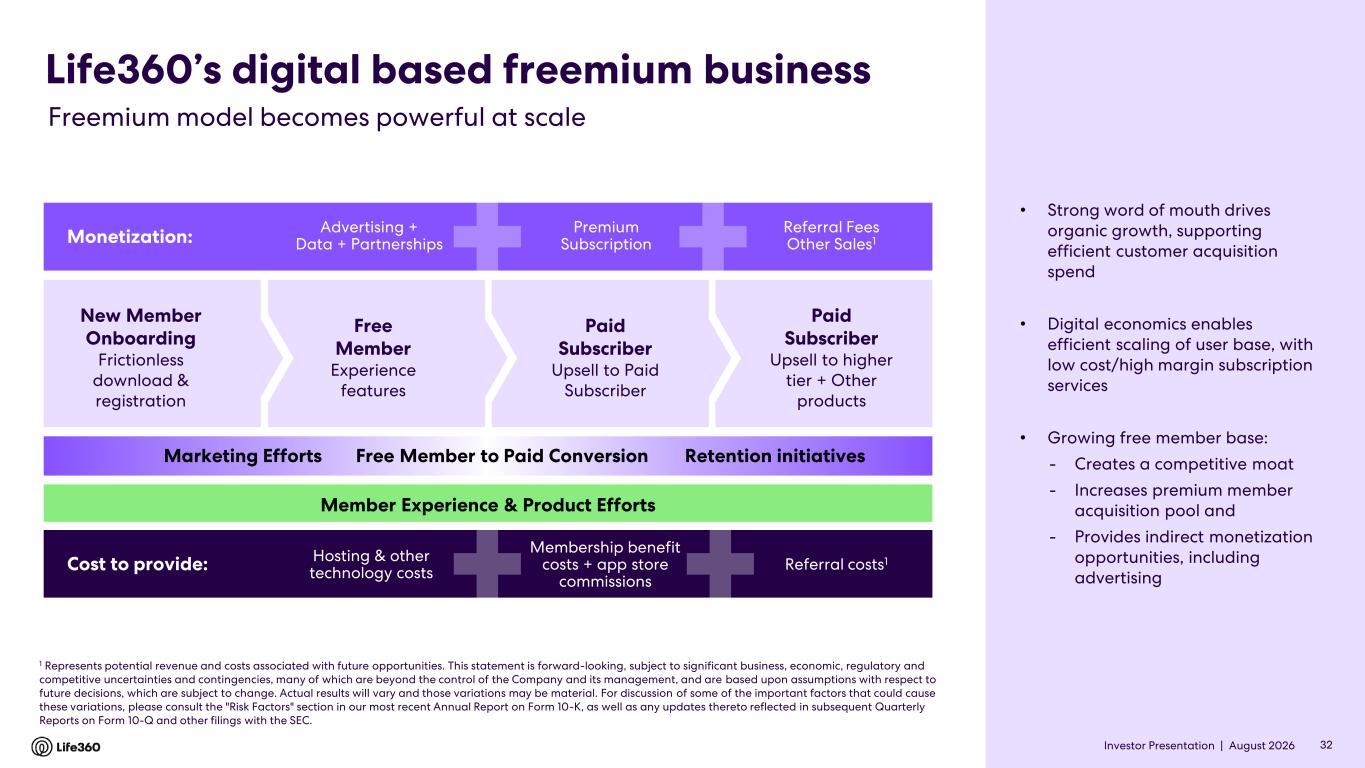
Investor Presentation | August 2026 New Member Onboarding Frictionless download & registration Free Member Experience features Paid Subscriber Upsell to Paid Subscriber Paid Subscriber Upsell to higher tier + Other products Life360’s digital based freemium business Monetization: Advertising + Data + Partnerships Premium Subscription Referral Fees Other Sales1 Cost to provide: Hosting & other technology costs Membership benefit costs + app store commissions Referral costs1 Marketing Efforts Free Member to Paid Conversion Retention initiatives Member Experience & Product Efforts 1 Represents potential revenue and costs associated with future opportunities. This statement is forward-looking, subject to significant business, economic, regulatory and competitive uncertainties and contingencies, many of which are beyond the control of the Company and its management, and are based upon assumptions with respect to future decisions, which are subject to change. Actual results will vary and those variations may be material. For discussion of some of the important factors that could cause these variations, please consult the "Risk Factors" section in our most recent Annual Report on Form 10-K, as well as any updates thereto reflected in subsequent Quarterly Reports on Form 10-Q and other filings with the SEC. Freemium model becomes powerful at scale • Strong word of mouth drives organic growth, supporting efficient customer acquisition spend • Digital economics enables efficient scaling of user base, with low cost/high margin subscription services • Growing free member base: - Creates a competitive moat - Increases premium member acquisition pool and - Provides indirect monetization opportunities, including advertising 32
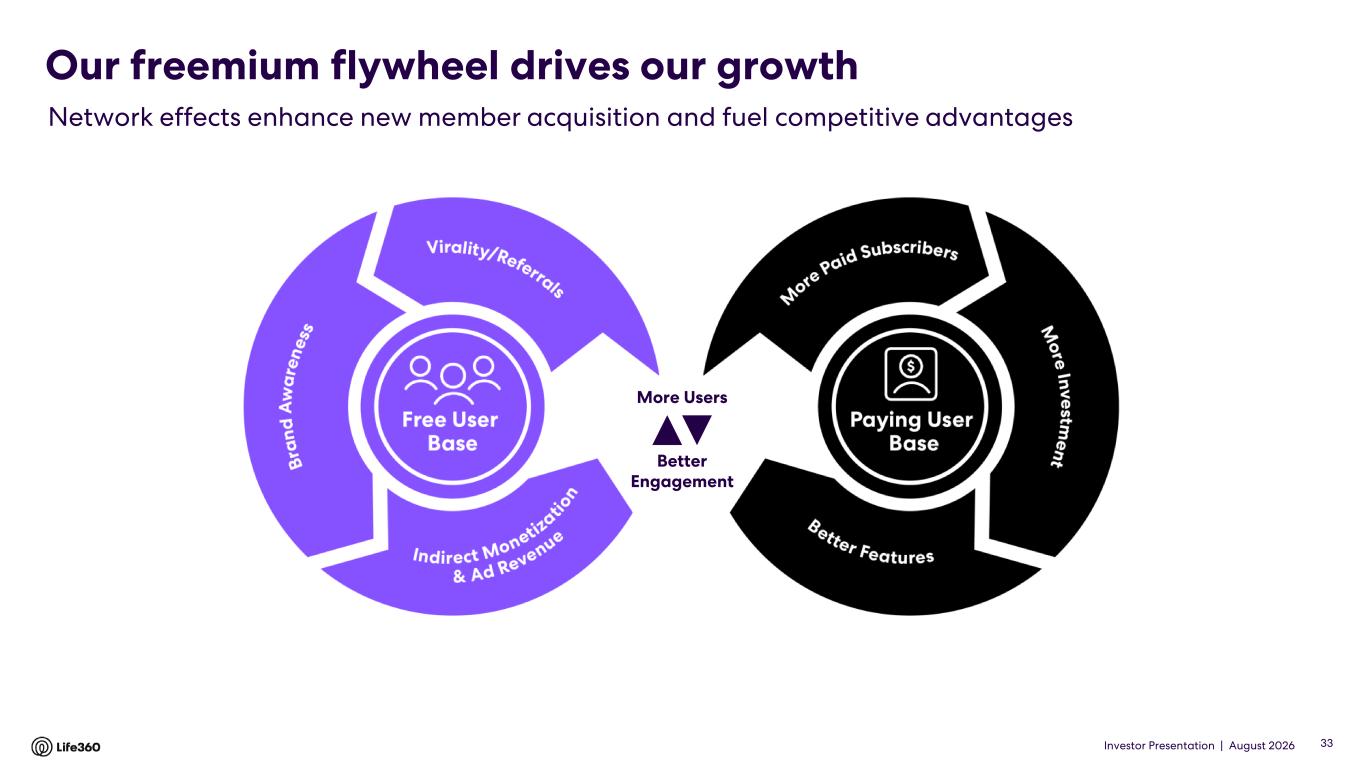
Investor Presentation | August 2026 Our freemium flywheel drives our growth Network effects enhance new member acquisition and fuel competitive advantages Better Engagement More Users 33
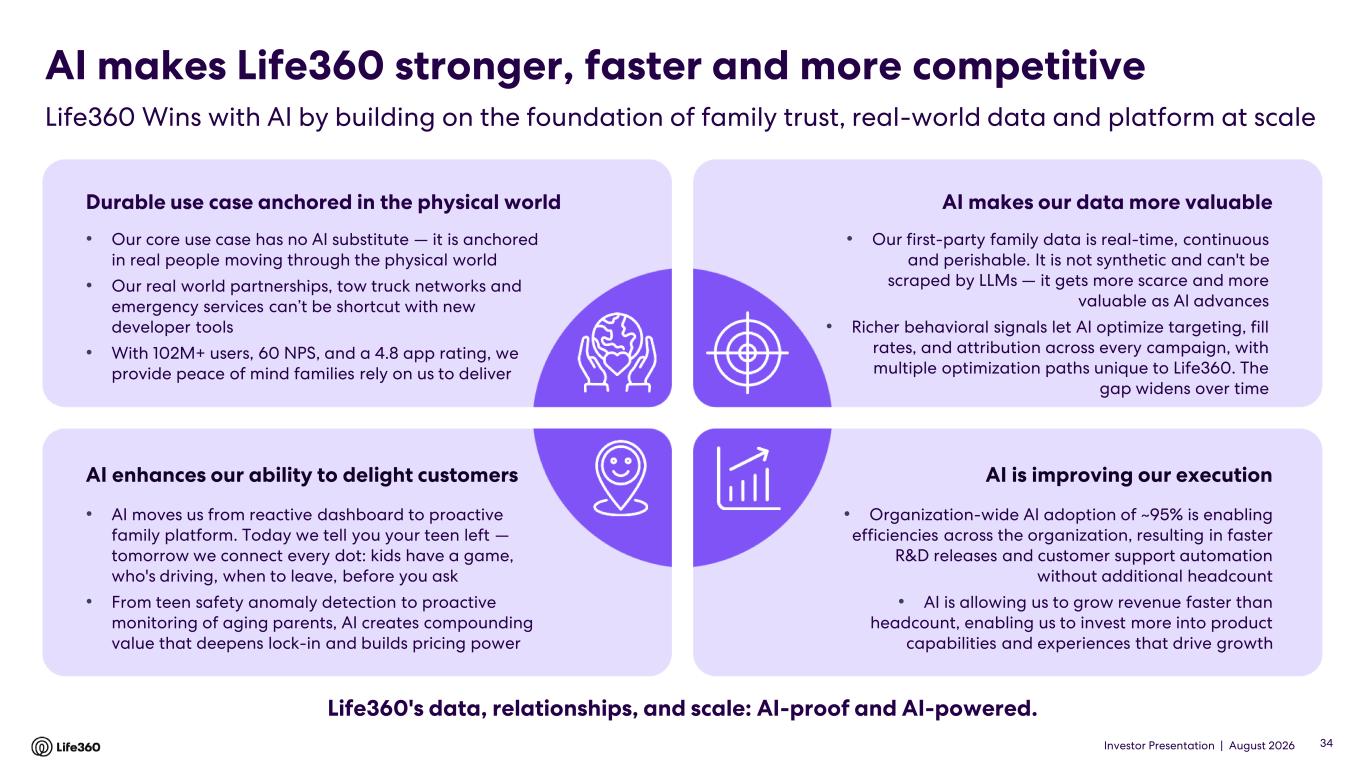
Investor Presentation | August 2026 AI makes Life360 stronger, faster and more competitive Life360 Wins with AI by building on the foundation of family trust, real-world data and platform at scale Durable use case anchored in the physical world • Our core use case has no AI substitute — it is anchored in real people moving through the physical world • Our real world partnerships, tow truck networks and emergency services can’t be shortcut with new developer tools • With 102M+ users, 60 NPS, and a 4.8 app rating, we provide peace of mind families rely on us to deliver AI makes our data more valuable • Our first-party family data is real-time, continuous and perishable. It is not synthetic and can't be scraped by LLMs — it gets more scarce and more valuable as AI advances • Richer behavioral signals let AI optimize targeting, fill rates, and attribution across every campaign, with multiple optimization paths unique to Life360. The gap widens over time AI enhances our ability to delight customers • AI moves us from reactive dashboard to proactive family platform. Today we tell you your teen left — tomorrow we connect every dot: kids have a game, who's driving, when to leave, before you ask • From teen safety anomaly detection to proactive monitoring of aging parents, AI creates compounding value that deepens lock-in and builds pricing power AI is improving our execution • Organization-wide AI adoption of ~95% is enabling efficiencies across the organization, resulting in faster R&D releases and customer support automation without additional headcount • AI is allowing us to grow revenue faster than headcount, enabling us to invest more into product capabilities and experiences that drive growth Life360's data, relationships, and scale: AI-proof and AI-powered. 34
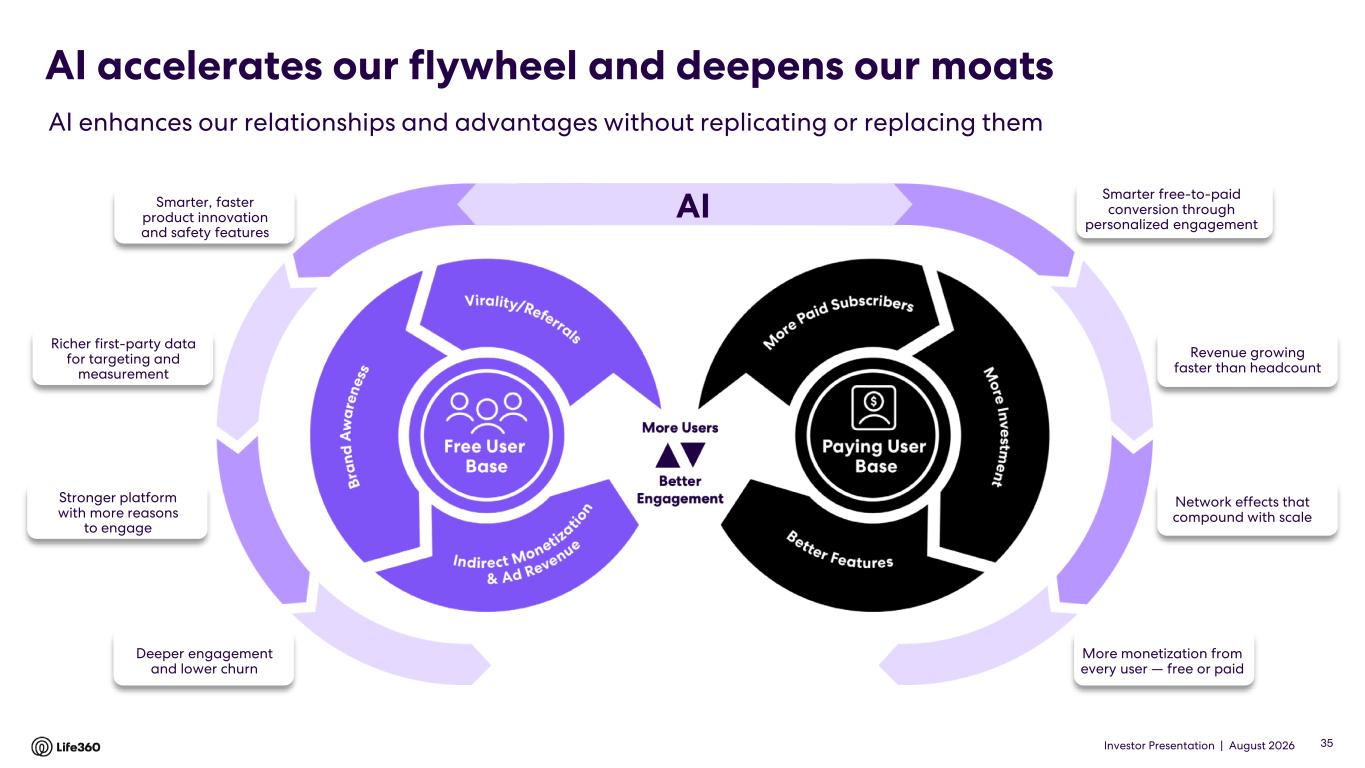
Investor Presentation | August 2026 AISmarter, faster product innovation and safety features AI accelerates our flywheel and deepens our moats AI enhances our relationships and advantages without replicating or replacing them 35 Richer first-party data for targeting and measurement Stronger platform with more reasons to engage Deeper engagement and lower churn Revenue growing faster than headcount Network effects that compound with scale More monetization from every user — free or paid Smarter free-to-paid conversion through personalized engagement
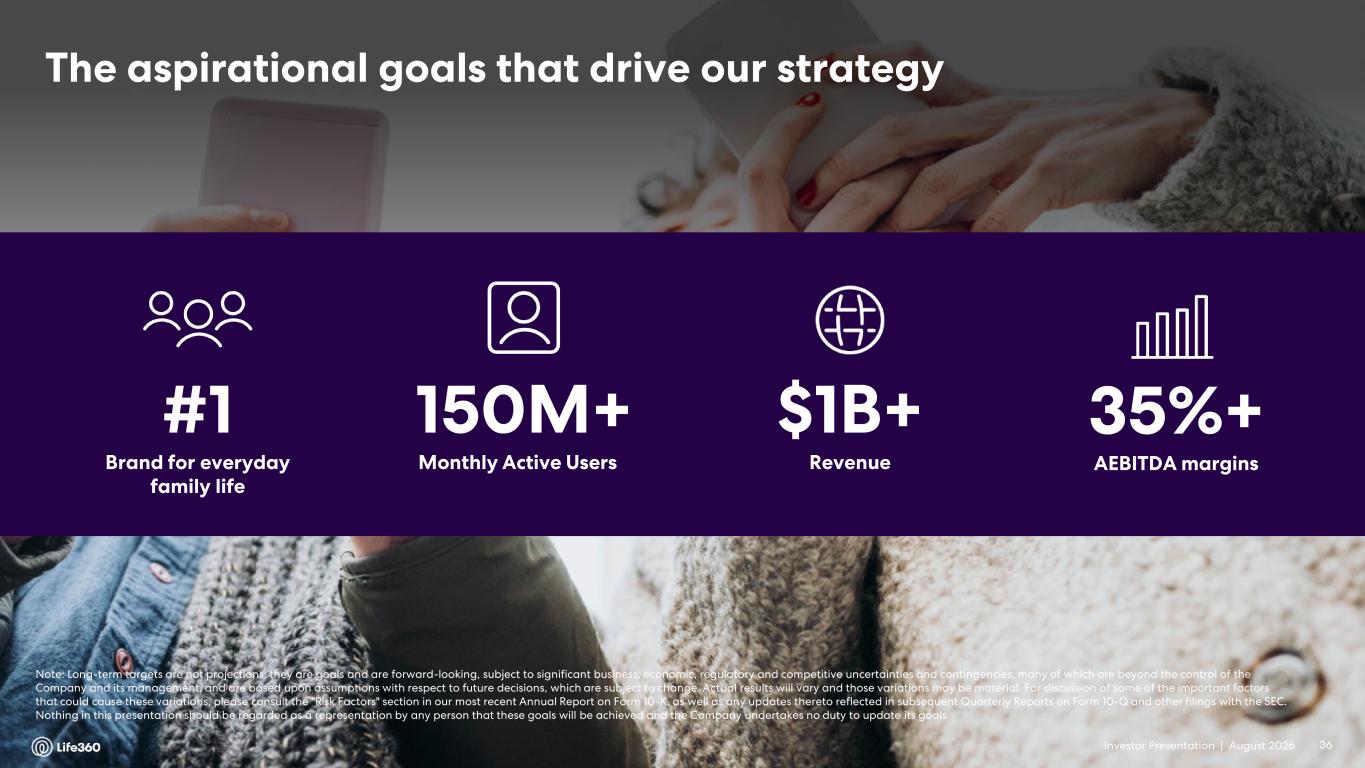
Investor Presentation | August 2026 The aspirational goals that drive our strategy #1 Brand for everyday family life 150M+ Monthly Active Users $1B+ Revenue 35%+ AEBITDA margins Note: Long-term targets are not projections; they are goals and are forward-looking, subject to significant business, economic, regulatory and competitive uncertainties and contingencies, many of which are beyond the control of the Company and its management, and are based upon assumptions with respect to future decisions, which are subject to change. Actual results will vary and those variations may be material. For discussion of some of the important factors that could cause these variations, please consult the "Risk Factors" section in our most recent Annual Report on Form 10-K, as well as any updates thereto reflected in subsequent Quarterly Reports on Form 10-Q and other filings with the SEC. Nothing in this presentation should be regarded as a representation by any person that these goals will be achieved and the Company undertakes no duty to update its goals. 36
Investor Presentation | August 2026 03 Financial Update Q2’26
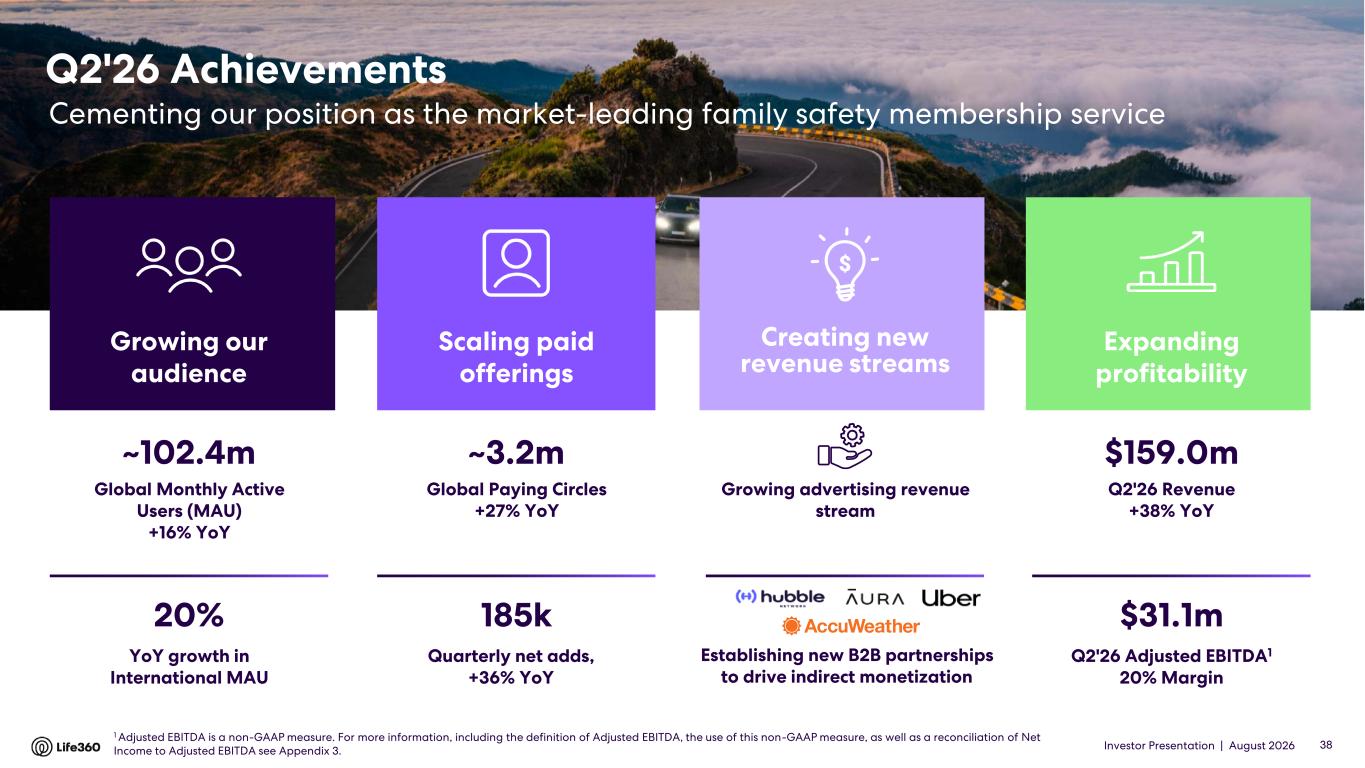
Investor Presentation | August 2026 Q2'26 Achievements Cementing our position as the market-leading family safety membership service $159.0m Q2'26 Revenue +38% YoY $31.1m Q2'26 Adjusted EBITDA1 20% Margin Expanding profitability ~3.2m Global Paying Circles +27% YoY 185k Quarterly net adds, +36% YoY Scaling paid offerings ~102.4m Global Monthly Active Users (MAU) +16% YoY 20% YoY growth in International MAU Growing our audience Establishing new B2B partnerships to drive indirect monetization Growing advertising revenue stream Creating new revenue streams 38 1 Adjusted EBITDA is a non-GAAP measure. For more information, including the definition of Adjusted EBITDA, the use of this non-GAAP measure, as well as a reconciliation of Net Income to Adjusted EBITDA see Appendix 3.
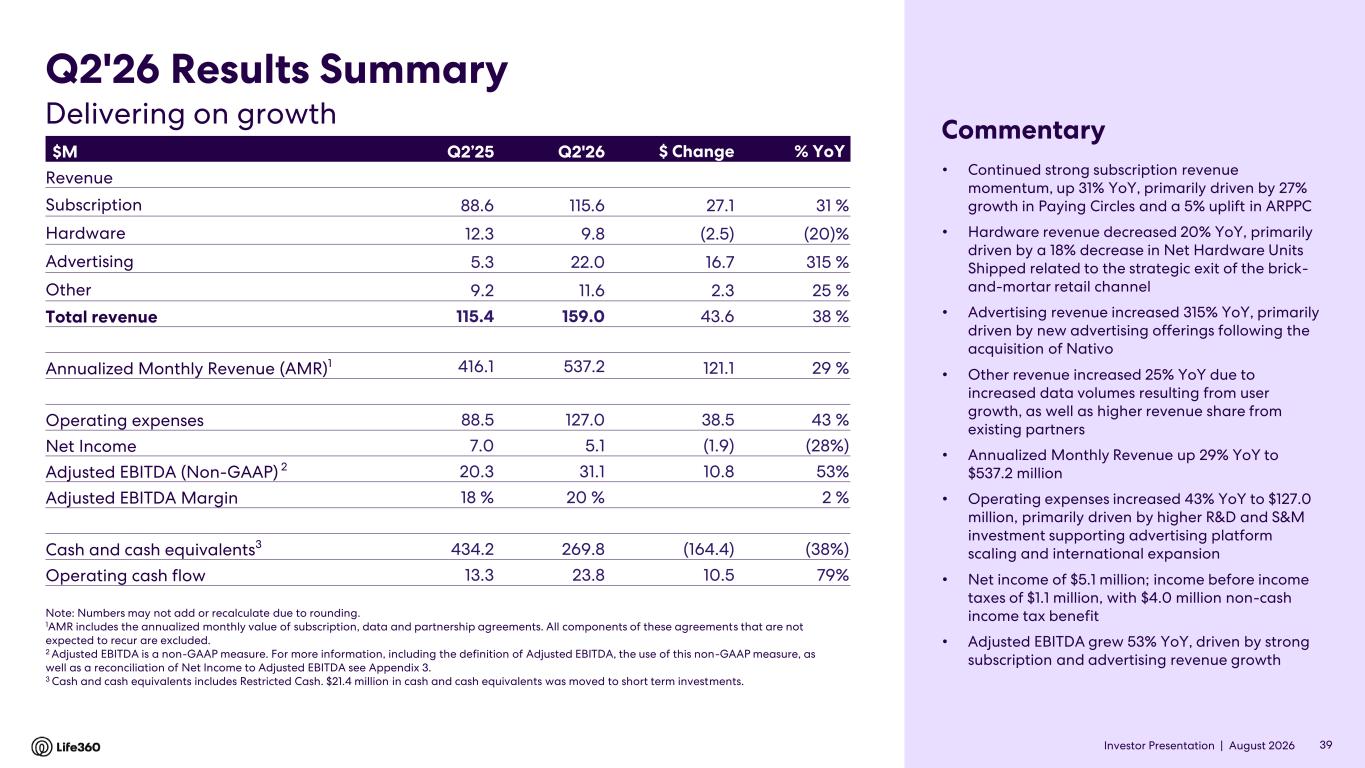
Investor Presentation | August 2026 • Continued strong subscription revenue momentum, up 31% YoY, primarily driven by 27% growth in Paying Circles and a 5% uplift in ARPPC • Hardware revenue decreased 20% YoY, primarily driven by a 18% decrease in Net Hardware Units Shipped related to the strategic exit of the brick- and-mortar retail channel • Advertising revenue increased 315% YoY, primarily driven by new advertising offerings following the acquisition of Nativo • Other revenue increased 25% YoY due to increased data volumes resulting from user growth, as well as higher revenue share from existing partners • Annualized Monthly Revenue up 29% YoY to $537.2 million • Operating expenses increased 43% YoY to $127.0 million, primarily driven by higher R&D and S&M investment supporting advertising platform scaling and international expansion • Net income of $5.1 million; income before income taxes of $1.1 million, with $4.0 million non-cash income tax benefit • Adjusted EBITDA grew 53% YoY, driven by strong subscription and advertising revenue growth $M Q2’25 Q2'26 $ Change % YoY Revenue Subscription 88.6 115.6 27.1 31 % Hardware 12.3 9.8 (2.5) (20)% Advertising 5.3 22.0 16.7 315 % Other 9.2 11.6 2.3 25 % Total revenue 115.4 159.0 43.6 38 % Annualized Monthly Revenue (AMR)1 416.1 537.2 121.1 29 % Operating expenses 88.5 127.0 38.5 43 % Net Income 7.0 5.1 (1.9) (28%) Adjusted EBITDA (Non-GAAP) 2 20.3 31.1 10.8 53% Adjusted EBITDA Margin 18 % 20 % 2 % Cash and cash equivalents3 434.2 269.8 (164.4) (38%) Operating cash flow 13.3 23.8 10.5 79% Note: Numbers may not add or recalculate due to rounding. 1AMR includes the annualized monthly value of subscription, data and partnership agreements. All components of these agreements that are not expected to recur are excluded. 2 Adjusted EBITDA is a non-GAAP measure. For more information, including the definition of Adjusted EBITDA, the use of this non-GAAP measure, as well as a reconciliation of Net Income to Adjusted EBITDA see Appendix 3. 3 Cash and cash equivalents includes Restricted Cash. $21.4 million in cash and cash equivalents was moved to short term investments. Q2'26 Results Summary Commentary Delivering on growth 39
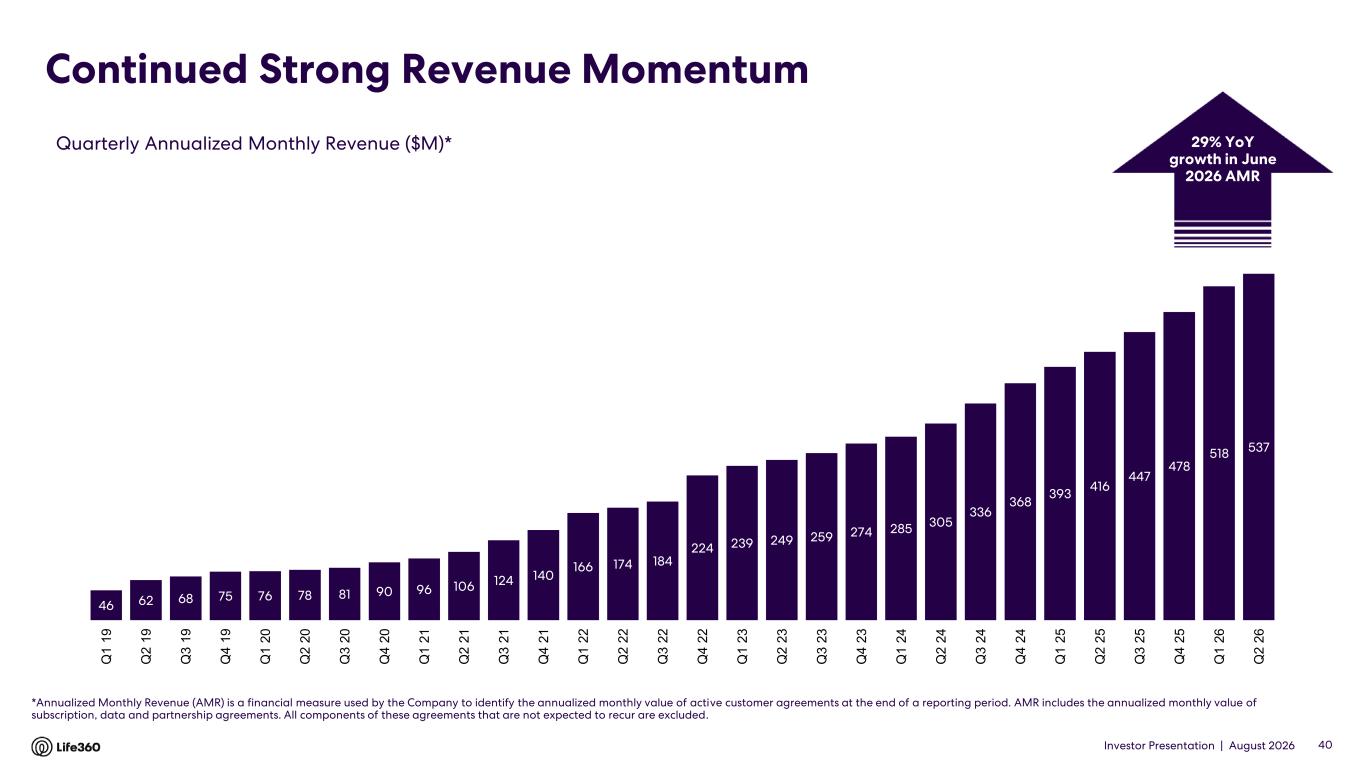
Investor Presentation | August 2026 Continued Strong Revenue Momentum *Annualized Monthly Revenue (AMR) is a financial measure used by the Company to identify the annualized monthly value of active customer agreements at the end of a reporting period. AMR includes the annualized monthly value of subscription, data and partnership agreements. All components of these agreements that are not expected to recur are excluded. Quarterly Annualized Monthly Revenue ($M)* 40 29% YoY growth in June 2026 AMR 46 62 68 75 76 78 81 90 96 106 124 140 166 174 184 224 239 249 259 274 285 305 336 368 393 416 447 478 518 537 Q 1 1 9 Q 2 1 9 Q 3 1 9 Q 4 1 9 Q 1 2 0 Q 2 2 0 Q 3 2 0 Q 4 2 0 Q 1 2 1 Q 2 2 1 Q 3 2 1 Q 4 2 1 Q 1 2 2 Q 2 2 2 Q 3 2 2 Q 4 2 2 Q 1 2 3 Q 2 2 3 Q 3 2 3 Q 4 2 3 Q 1 2 4 Q 2 2 4 Q 3 2 4 Q 4 2 4 Q 1 2 5 Q 2 2 5 Q 3 2 5 Q 4 2 5 Q 1 2 6 Q 2 2 6
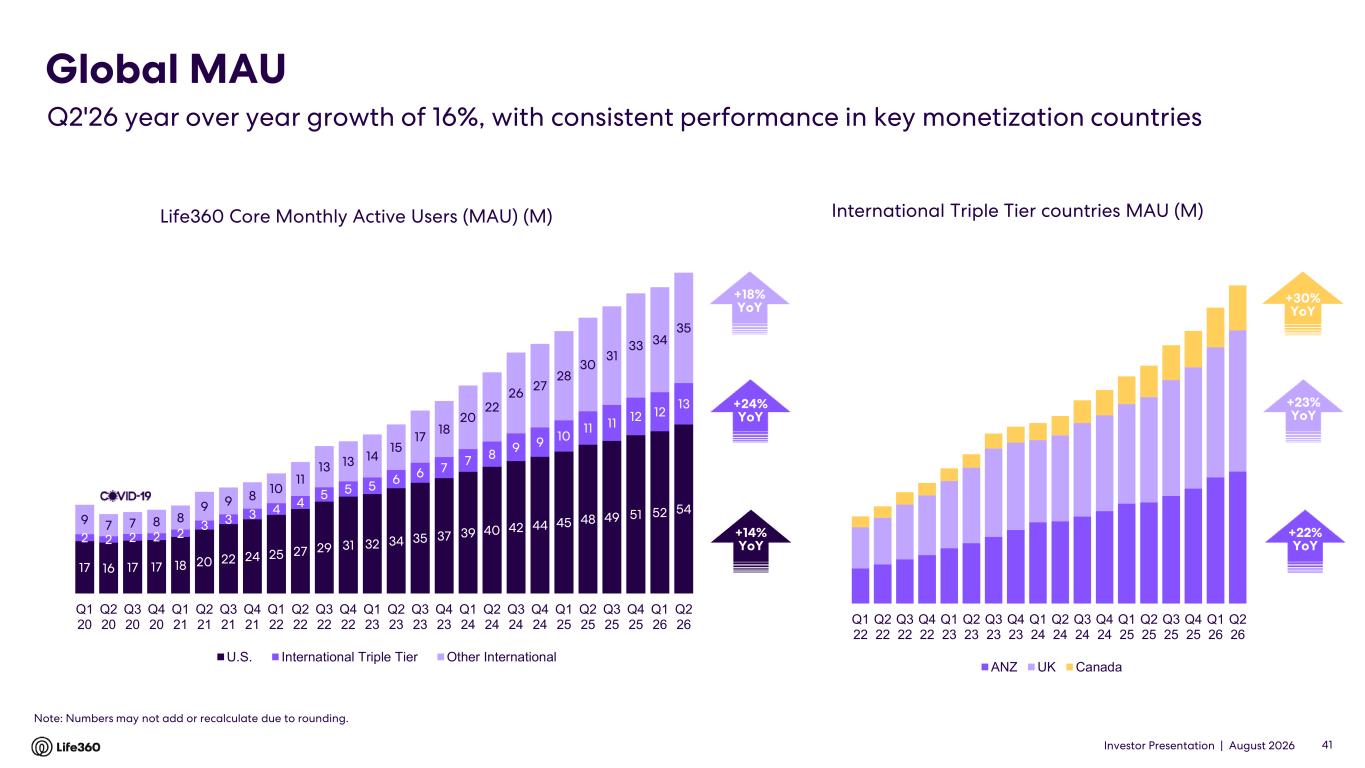
Investor Presentation | August 2026 Life360 Core Monthly Active Users (MAU) (M) Note: Numbers may not add or recalculate due to rounding. Global MAU Q2'26 year over year growth of 16%, with consistent performance in key monetization countries International Triple Tier countries MAU (M) +23% YoY +24% YoY +14% YoY +22% YoY 41 +30% YoY +18% YoY 17 16 17 17 18 20 22 24 25 27 29 31 32 34 35 37 39 40 42 44 45 48 49 51 52 54 2 2 2 2 2 3 3 3 4 4 5 5 5 6 6 7 7 8 9 9 10 11 11 12 12 13 9 7 7 8 8 9 9 8 10 11 13 13 14 15 17 18 20 22 26 27 28 30 31 33 34 35 Q1 20 Q2 20 Q3 20 Q4 20 Q1 21 Q2 21 Q3 21 Q4 21 Q1 22 Q2 22 Q3 22 Q4 22 Q1 23 Q2 23 Q3 23 Q4 23 Q1 24 Q2 24 Q3 24 Q4 24 Q1 25 Q2 25 Q3 25 Q4 25 Q1 26 Q2 26 U.S. International Triple Tier Other International Q1 22 Q2 22 Q3 22 Q4 22 Q1 23 Q2 23 Q3 23 Q4 23 Q1 24 Q2 24 Q3 24 Q4 24 Q1 25 Q2 25 Q3 25 Q4 25 Q1 26 Q2 26 ANZ UK Canada
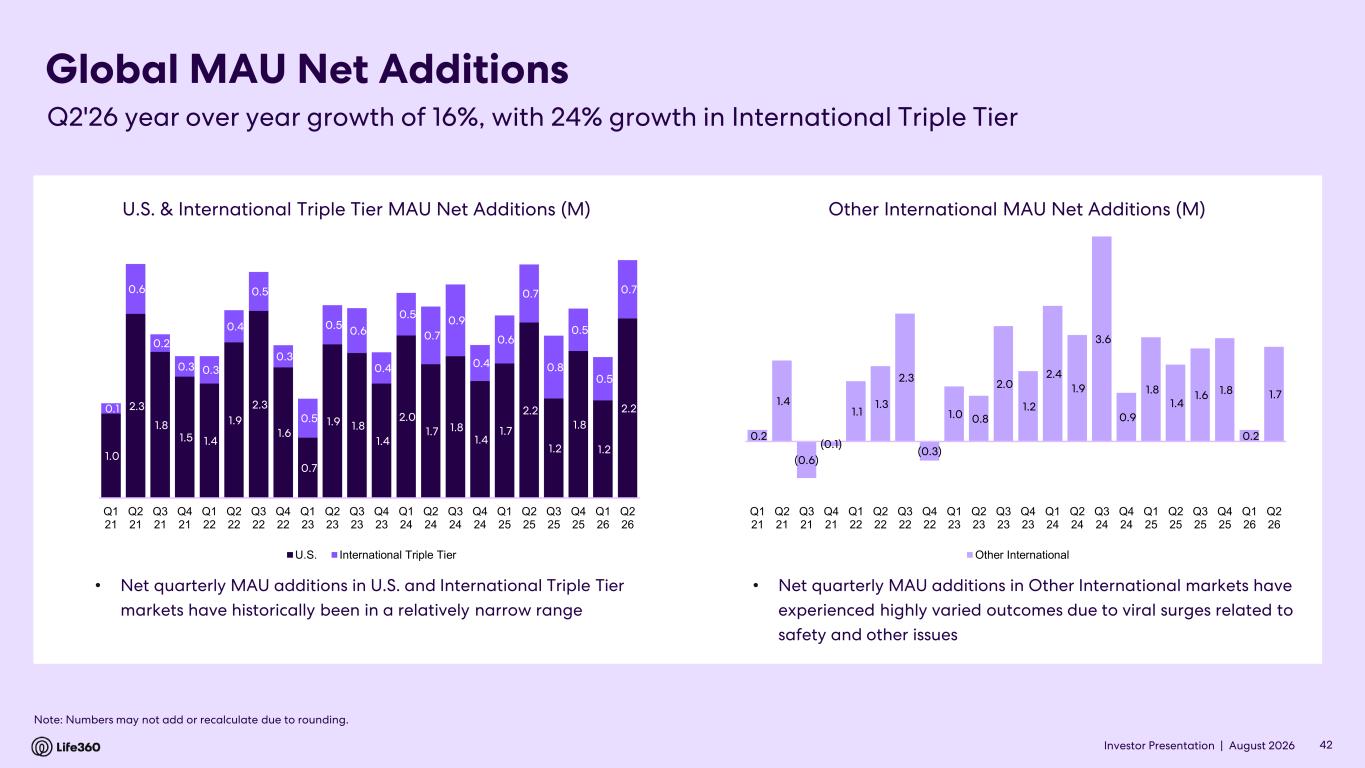
Investor Presentation | August 2026 Global MAU Net Additions • Net quarterly MAU additions in U.S. and International Triple Tier markets have historically been in a relatively narrow range 42 Note: Numbers may not add or recalculate due to rounding. Q2'26 year over year growth of 16%, with 24% growth in International Triple Tier • Net quarterly MAU additions in Other International markets have experienced highly varied outcomes due to viral surges related to safety and other issues 0.2 1.4 (0.6) (0.1) 1.1 1.3 2.3 (0.3) 1.0 0.8 2.0 1.2 2.4 1.9 3.6 0.9 1.8 1.4 1.6 1.8 0.2 1.7 Q1 21 Q2 21 Q3 21 Q4 21 Q1 22 Q2 22 Q3 22 Q4 22 Q1 23 Q2 23 Q3 23 Q4 23 Q1 24 Q2 24 Q3 24 Q4 24 Q1 25 Q2 25 Q3 25 Q4 25 Q1 26 Q2 26 Other International Other International MAU Net Additions (M) 1.0 2.3 1.8 1.5 1.4 1.9 2.3 1.6 0.7 1.9 1.8 1.4 2.0 1.7 1.8 1.4 1.7 2.2 1.2 1.8 1.2 2.2 0.1 0.6 0.2 0.3 0.3 0.4 0.5 0.3 0.5 0.5 0.6 0.4 0.5 0.7 0.9 0.4 0.6 0.7 0.8 0.5 0.5 0.7 Q1 21 Q2 21 Q3 21 Q4 21 Q1 22 Q2 22 Q3 22 Q4 22 Q1 23 Q2 23 Q3 23 Q4 23 Q1 24 Q2 24 Q3 24 Q4 24 Q1 25 Q2 25 Q3 25 Q4 25 Q1 26 Q2 26 U.S. International Triple Tier U.S. & International Triple Tier MAU Net Additions (M)
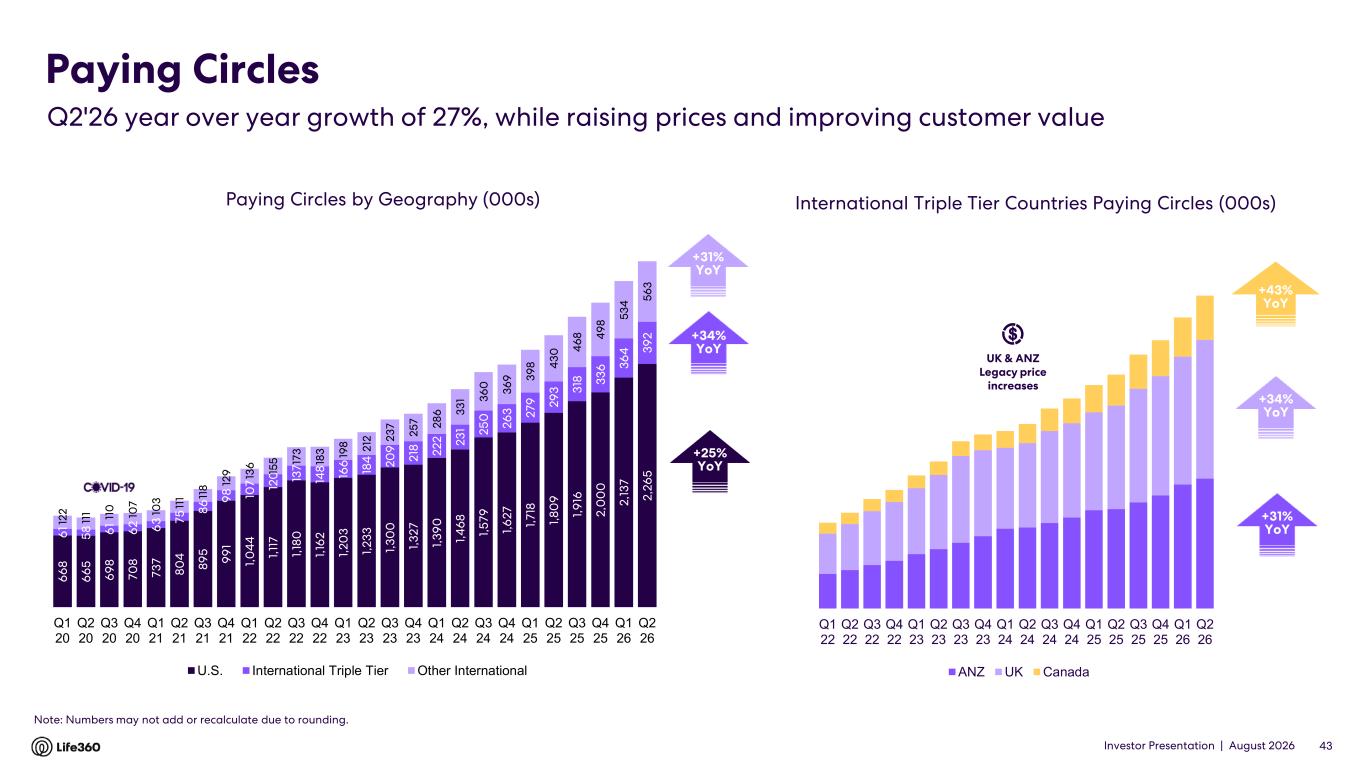
Investor Presentation | August 2026 Q1 22 Q2 22 Q3 22 Q4 22 Q1 23 Q2 23 Q3 23 Q4 23 Q1 24 Q2 24 Q3 24 Q4 24 Q1 25 Q2 25 Q3 25 Q4 25 Q1 26 Q2 26 ANZ UK Canada Paying Circles by Geography (000s) Paying Circles $1398 +42% YoY$38 +42% YoYInternational Triple Tier Countries Paying Circles (000s) +34% YoY +31% YoY +23% YoY 43 Note: Numbers may not add or recalculate due to rounding. Q2'26 year over year growth of 27%, while raising prices and improving customer value UK & ANZ Legacy price increases +43% YoY +34% YoY +25% YoY +31% YoY 6 6 8 6 6 5 6 9 8 7 0 8 7 3 7 8 0 4 8 9 5 9 9 1 1, 0 4 4 1, 11 7 1, 18 0 1, 16 2 1, 2 0 3 1, 2 3 3 1, 3 0 0 1, 3 2 7 1, 3 9 0 1, 4 6 8 1, 5 7 9 1, 6 2 7 1, 7 18 1, 8 0 9 1, 9 16 2 ,0 0 0 2 ,1 3 7 2 ,2 6 5 6 1 5 8 6 1 6 2 6 3 7 5 8 6 9 8 10 7 12 0 13 7 14 8 16 6 18 4 2 0 9 2 18 2 2 2 2 3 1 2 5 0 2 6 3 2 7 9 2 9 3 3 18 3 3 6 3 6 4 3 9 2 12 2 11 1 11 0 10 7 10 3 11 1 11 8 12 9 13 6 15 5 17 3 18 3 19 8 2 12 2 3 7 2 5 7 2 8 6 3 3 1 3 6 0 3 6 9 3 9 8 4 3 0 4 6 8 4 9 8 5 3 4 5 6 3 Q1 20 Q2 20 Q3 20 Q4 20 Q1 21 Q2 21 Q3 21 Q4 21 Q1 22 Q2 22 Q3 22 Q4 22 Q1 23 Q2 23 Q3 23 Q4 23 Q1 24 Q2 24 Q3 24 Q4 24 Q1 25 Q2 25 Q3 25 Q4 25 Q1 26 Q2 26 U.S. International Triple Tier Other International
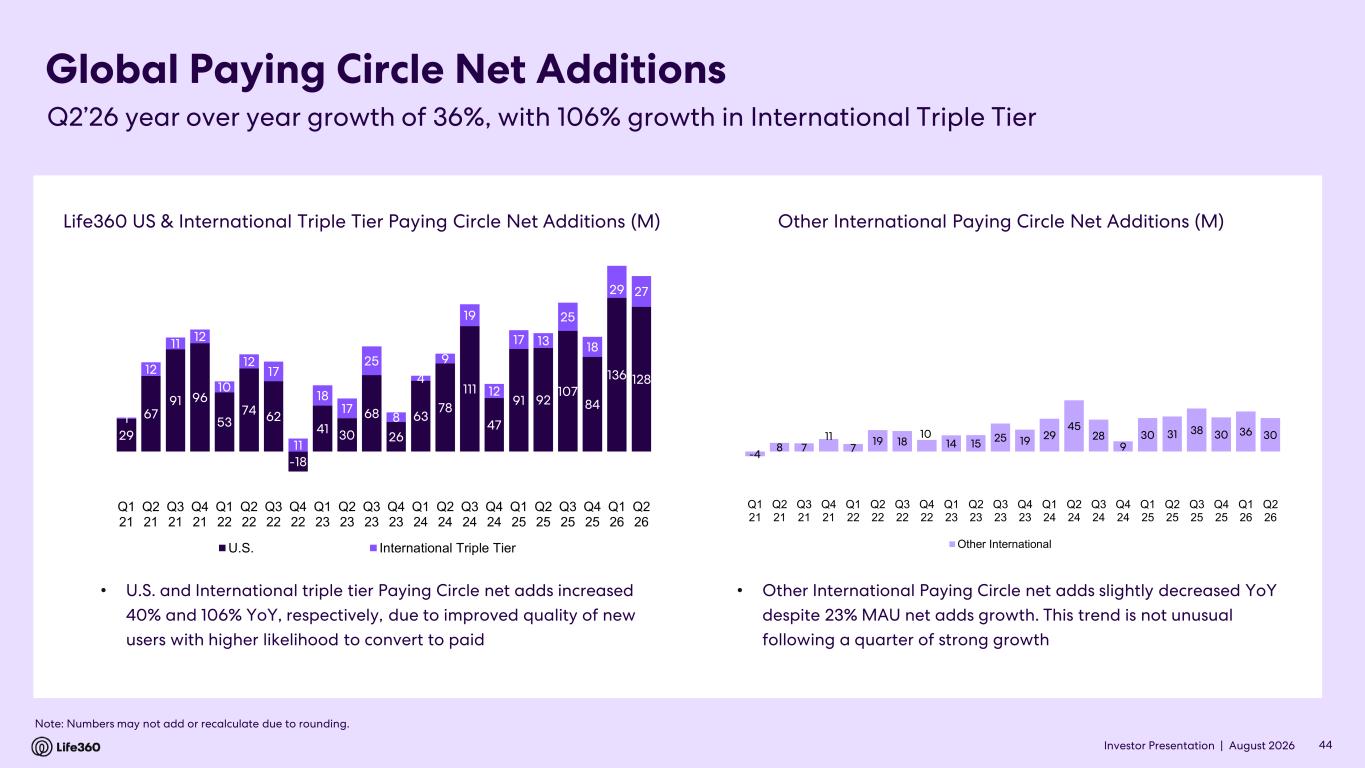
Investor Presentation | August 2026 Global Paying Circle Net Additions 44 Note: Numbers may not add or recalculate due to rounding. Q2’26 year over year growth of 36%, with 106% growth in International Triple Tier Life360 US & International Triple Tier Paying Circle Net Additions (M) Other International Paying Circle Net Additions (M) • U.S. and International triple tier Paying Circle net adds increased 40% and 106% YoY, respectively, due to improved quality of new users with higher likelihood to convert to paid • Other International Paying Circle net adds slightly decreased YoY despite 23% MAU net adds growth. This trend is not unusual following a quarter of strong growth -4 8 7 11 7 19 18 10 14 15 25 19 29 45 28 9 30 31 38 30 36 30 -40 10 60 110 160 Q1 21 Q2 21 Q3 21 Q4 21 Q1 22 Q2 22 Q3 22 Q4 22 Q1 23 Q2 23 Q3 23 Q4 23 Q1 24 Q2 24 Q3 24 Q4 24 Q1 25 Q2 25 Q3 25 Q4 25 Q1 26 Q2 26 Other International 29 67 91 96 53 74 62 -18 41 30 68 26 63 78 111 47 91 92 107 84 136 128 1 12 11 12 10 12 17 11 18 17 25 8 4 9 19 12 17 13 25 18 29 27 -40 -20 0 20 40 60 80 100 120 140 160 180 Q1 21 Q2 21 Q3 21 Q4 21 Q1 22 Q2 22 Q3 22 Q4 22 Q1 23 Q2 23 Q3 23 Q4 23 Q1 24 Q2 24 Q3 24 Q4 24 Q1 25 Q2 25 Q3 25 Q4 25 Q1 26 Q2 26 U.S. International Triple Tier
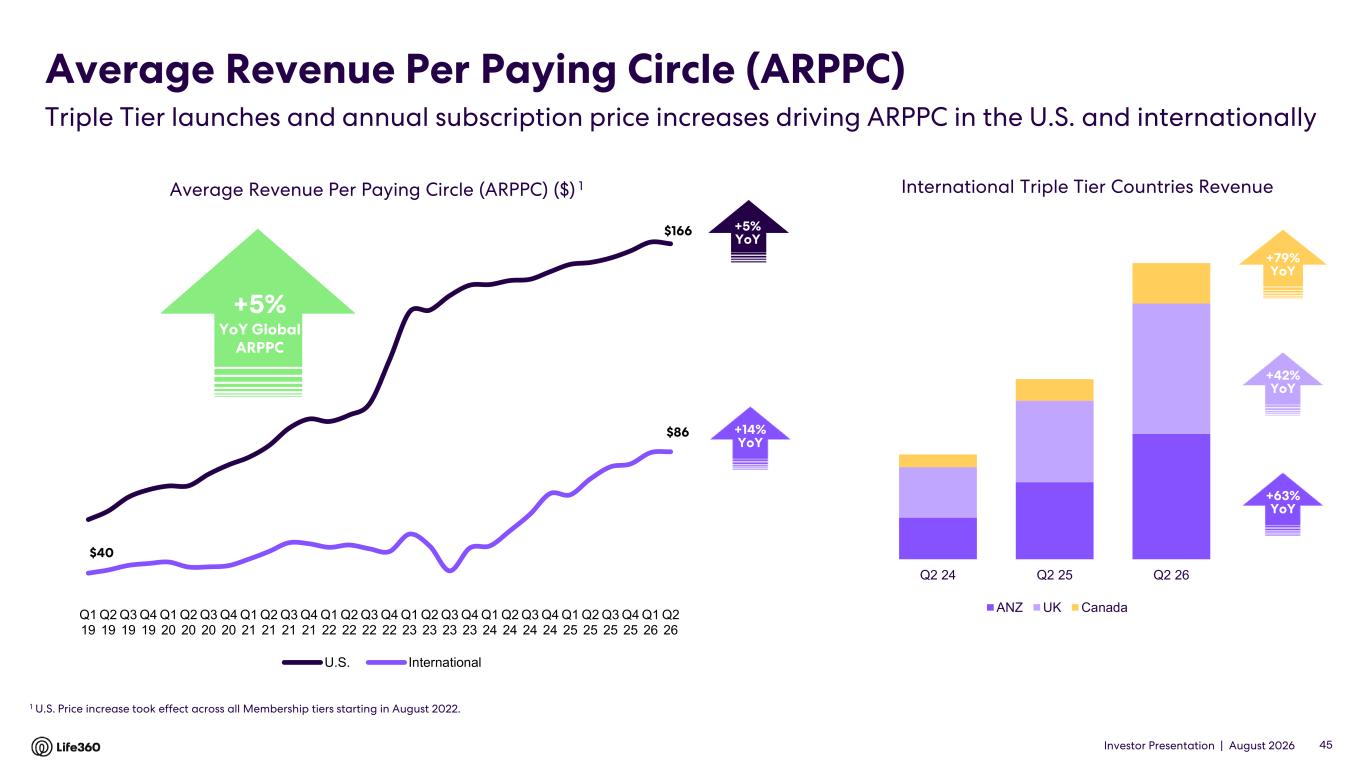
Investor Presentation | August 2026 $166 $40 $86 Q1 19 Q2 19 Q3 19 Q4 19 Q1 20 Q2 20 Q3 20 Q4 20 Q1 21 Q2 21 Q3 21 Q4 21 Q1 22 Q2 22 Q3 22 Q4 22 Q1 23 Q2 23 Q3 23 Q4 23 Q1 24 Q2 24 Q3 24 Q4 24 Q1 25 Q2 25 Q3 25 Q4 25 Q1 26 Q2 26 U.S. International Average Revenue Per Paying Circle (ARPPC) 1 U.S. Price increase took effect across all Membership tiers starting in August 2022. Average Revenue Per Paying Circle (ARPPC) ($) 1 +5% YoY 45 +14% YoY +42% YoY +63% YoY Triple Tier launches and annual subscription price increases driving ARPPC in the U.S. and internationally International Triple Tier Countries Revenue +79% YoY +5% YoY Global ARPPC Q2 24 Q2 25 Q2 26 ANZ UK Canada
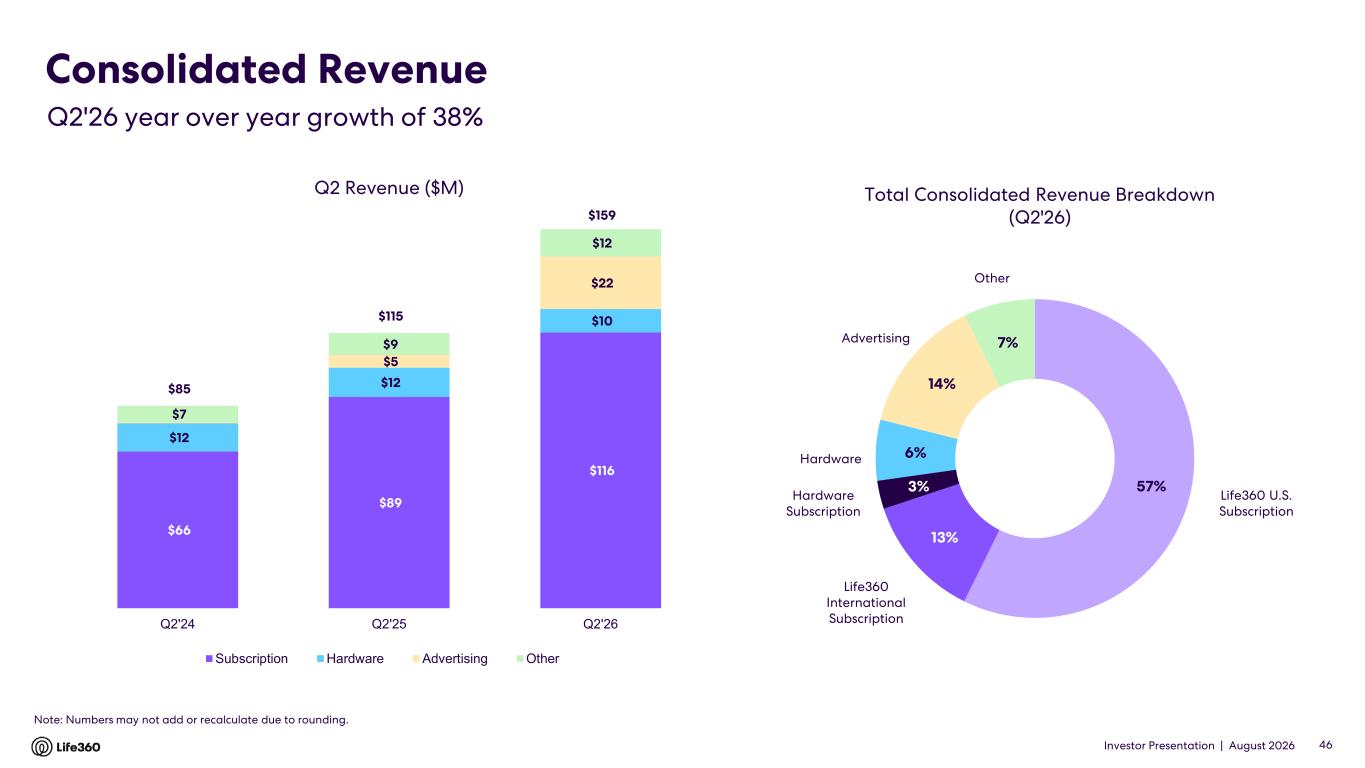
Investor Presentation | August 2026 Consolidated Revenue 46 Q2 Revenue ($M) Total Consolidated Revenue Breakdown (Q2'26) Hardware Life360 U.S. Subscription Life360 International Subscription Hardware Subscription Advertising Q2'26 year over year growth of 38% Note: Numbers may not add or recalculate due to rounding. Other $66 $89 $116 $12 $12 $10 $5 $22 $7 $9 $12 $85 $115 $159 Q2'24 Q2'25 Q2'26 Subscription Hardware Advertising Other 57% 13% 3% 6% 14% 7%
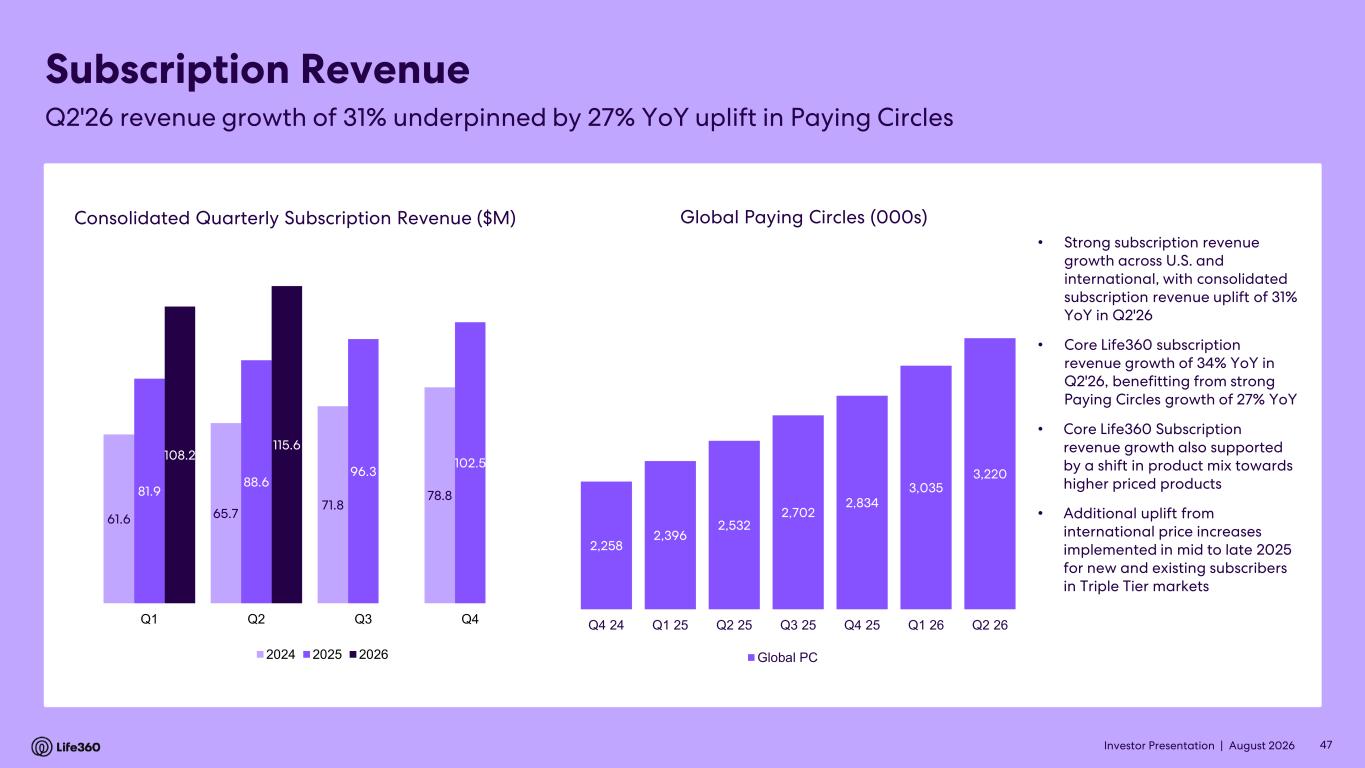
Investor Presentation | August 2026 47 Consolidated Quarterly Subscription Revenue ($M) Global Paying Circles (000s) Subscription Revenue Q2'26 revenue growth of 31% underpinned by 27% YoY uplift in Paying Circles 61.6 65.7 71.8 78.881.9 88.6 96.3 102.5 108.2 115.6 Q1 Q2 Q3 Q4 2024 2025 2026 2,258 2,396 2,532 2,702 2,834 3,035 3,220 1,400 1,600 1,800 2,000 2,200 2,400 2,600 2,800 3,000 3,200 3,400 Q4 24 Q1 25 Q2 25 Q3 25 Q4 25 Q1 26 Q2 26 Global PC • Strong subscription revenue growth across U.S. and international, with consolidated subscription revenue uplift of 31% YoY in Q2'26 • Core Life360 subscription revenue growth of 34% YoY in Q2'26, benefitting from strong Paying Circles growth of 27% YoY • Core Life360 Subscription revenue growth also supported by a shift in product mix towards higher priced products • Additional uplift from international price increases implemented in mid to late 2025 for new and existing subscribers in Triple Tier markets
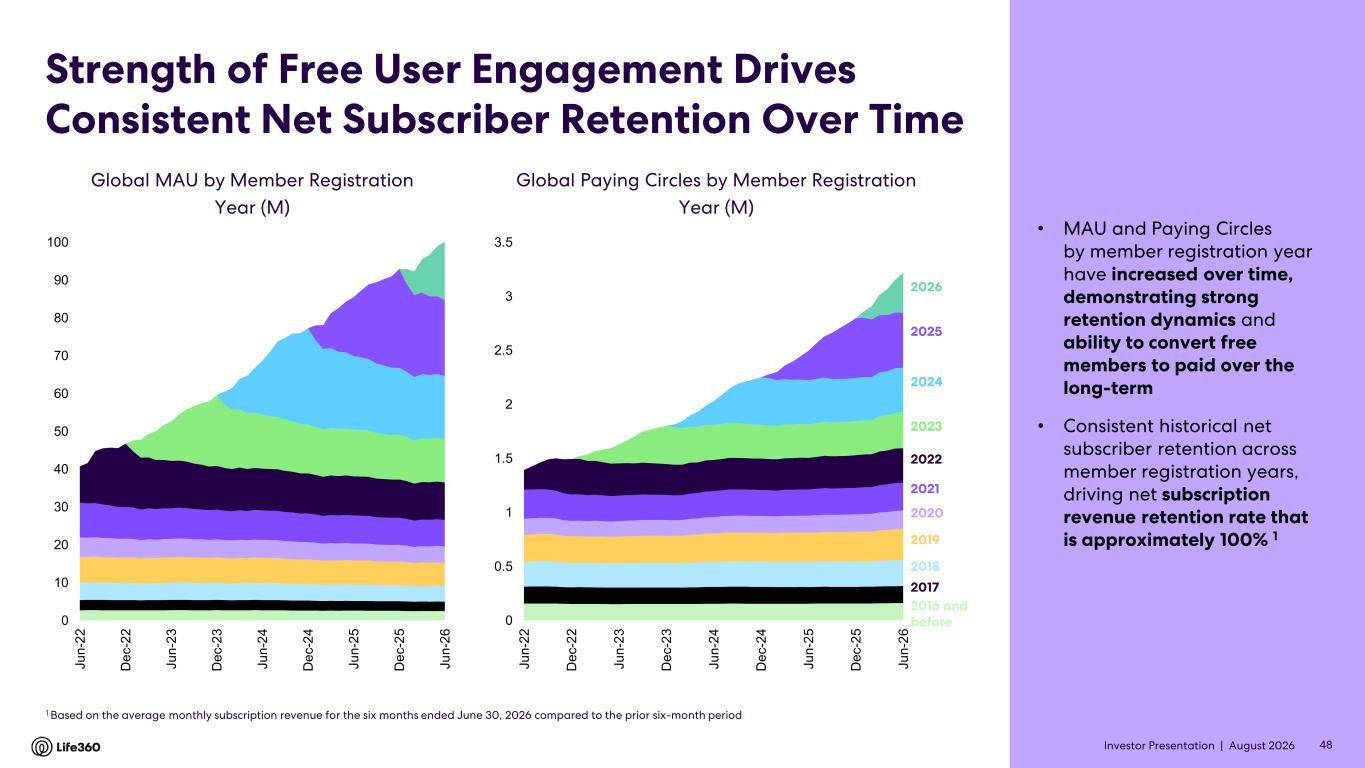
Investor Presentation | August 2026 Strength of Free User Engagement Drives Consistent Net Subscriber Retention Over Time • MAU and Paying Circles by member registration year have increased over time, demonstrating strong retention dynamics and ability to convert free members to paid over the long-term • Consistent historical net subscriber retention across member registration years, driving net subscription revenue retention rate that is approximately 100% 1 Global Paying Circles by Member Registration Year (M) Global MAU by Member Registration Year (M) 1 Based on the average monthly subscription revenue for the six months ended June 30, 2026 compared to the prior six-month period 48 2023 2022 2021 2020 2019 2018 2017 2016 and before 2024 2025 2026 0 0.5 1 1.5 2 2.5 3 3.5 J u n -2 2 D e c -2 2 J u n -2 3 D e c -2 3 J u n -2 4 D e c -2 4 J u n -2 5 D e c -2 5 J u n -2 6 0 10 20 30 40 50 60 70 80 90 100 J u n -2 2 D e c -2 2 J u n -2 3 D e c -2 3 J u n -2 4 D e c -2 4 J u n -2 5 D e c -2 5 J u n -2 6
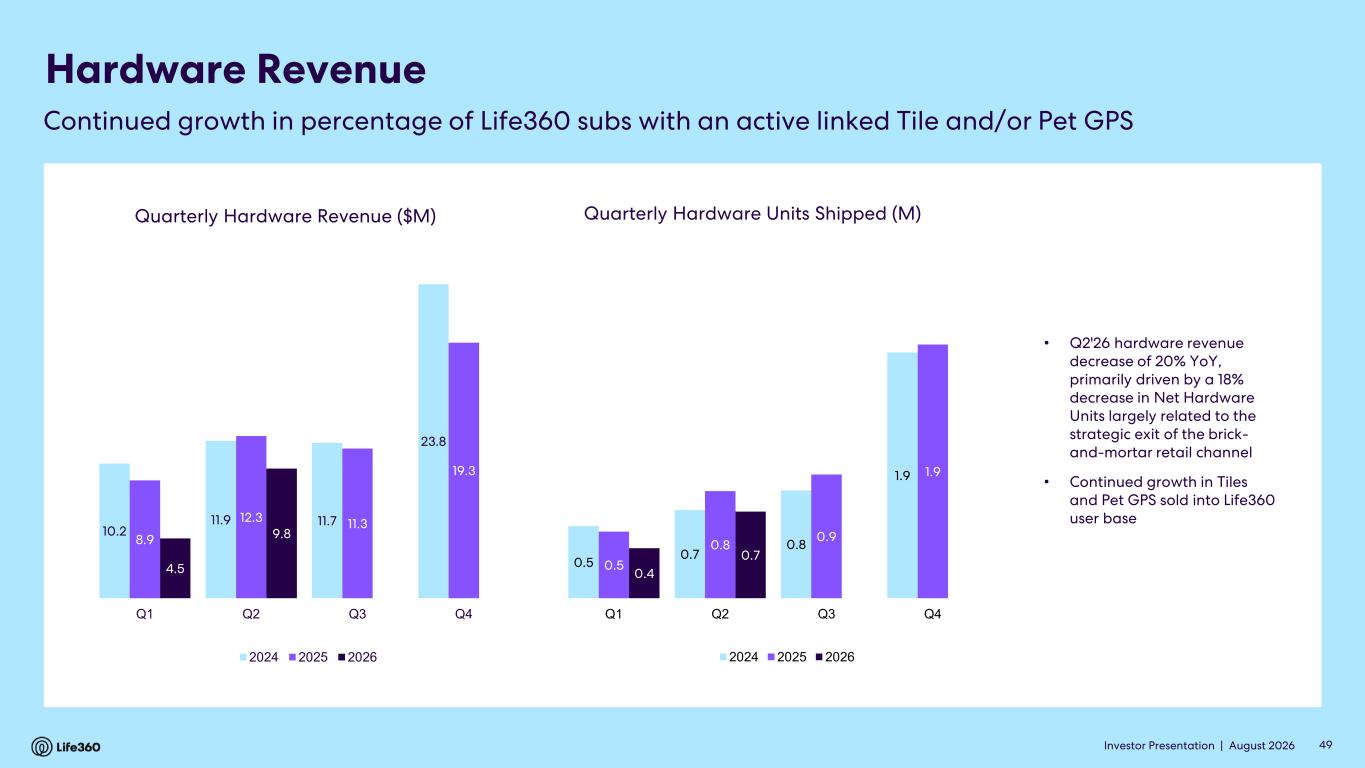
Investor Presentation | August 2026 Hardware Revenue Quarterly Hardware Revenue ($M) • Q2'26 hardware revenue decrease of 20% YoY, primarily driven by a 18% decrease in Net Hardware Units largely related to the strategic exit of the brick- and-mortar retail channel • Continued growth in Tiles and Pet GPS sold into Life360 user base Quarterly Hardware Units Shipped (M) Continued growth in percentage of Life360 subs with an active linked Tile and/or Pet GPS 49 10.2 11.9 11.7 23.8 8.9 12.3 11.3 19.3 4.5 9.8 Q1 Q2 Q3 Q4 2024 2025 2026 0.5 0.7 0.8 1.9 0.5 0.8 0.9 1.9 0.4 0.7 Q1 Q2 Q3 Q4 2024 2025 2026
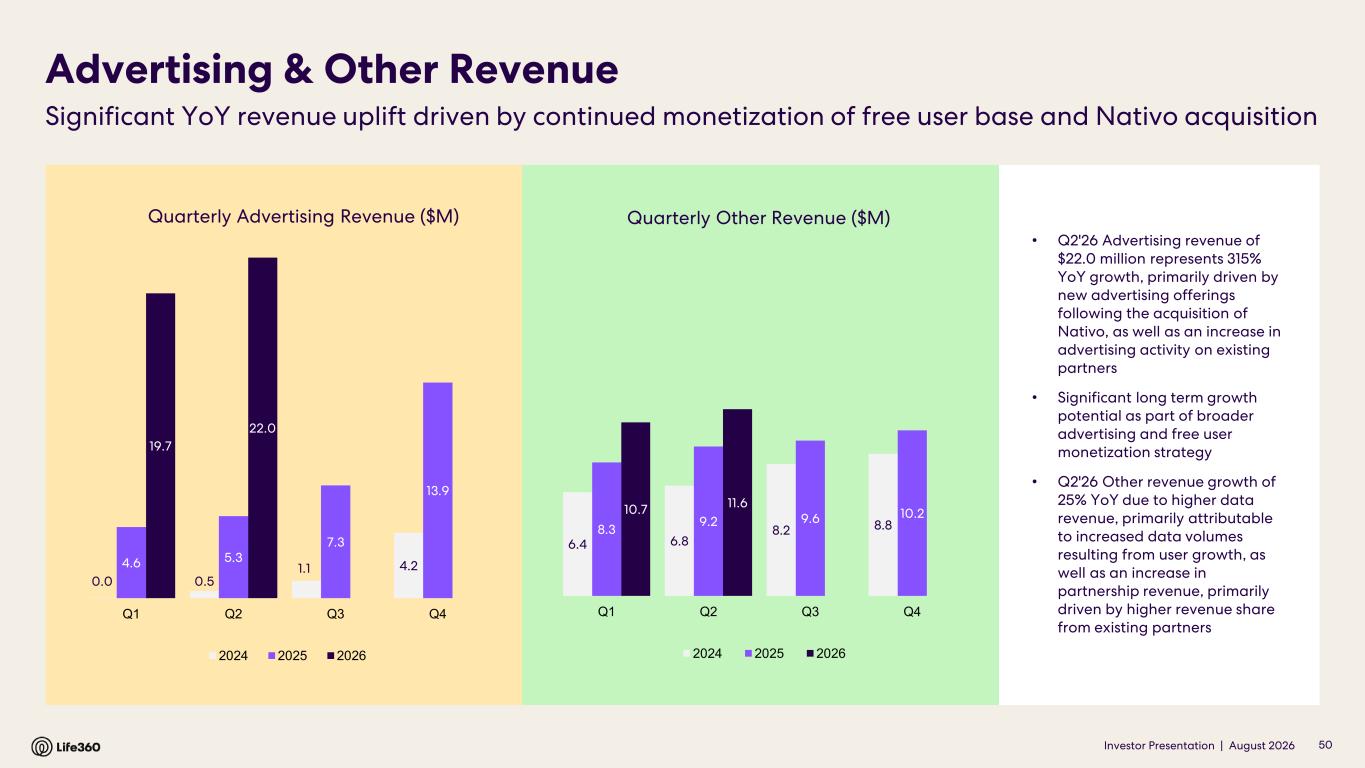
Investor Presentation | August 2026 Quarterly Advertising Revenue ($M) Advertising & Other Revenue Significant YoY revenue uplift driven by continued monetization of free user base and Nativo acquisition • Q2'26 Advertising revenue of $22.0 million represents 315% YoY growth, primarily driven by new advertising offerings following the acquisition of Nativo, as well as an increase in advertising activity on existing partners • Significant long term growth potential as part of broader advertising and free user monetization strategy • Q2'26 Other revenue growth of 25% YoY due to higher data revenue, primarily attributable to increased data volumes resulting from user growth, as well as an increase in partnership revenue, primarily driven by higher revenue share from existing partners 50 Quarterly Other Revenue ($M) 0.0 0.5 1.1 4.24.6 5.3 7.3 13.9 19.7 22.0 Q1 Q2 Q3 Q4 2024 2025 2026 6.4 6.8 8.2 8.88.3 9.2 9.6 10.210.7 11.6 Q1 Q2 Q3 Q4 2024 2025 2026
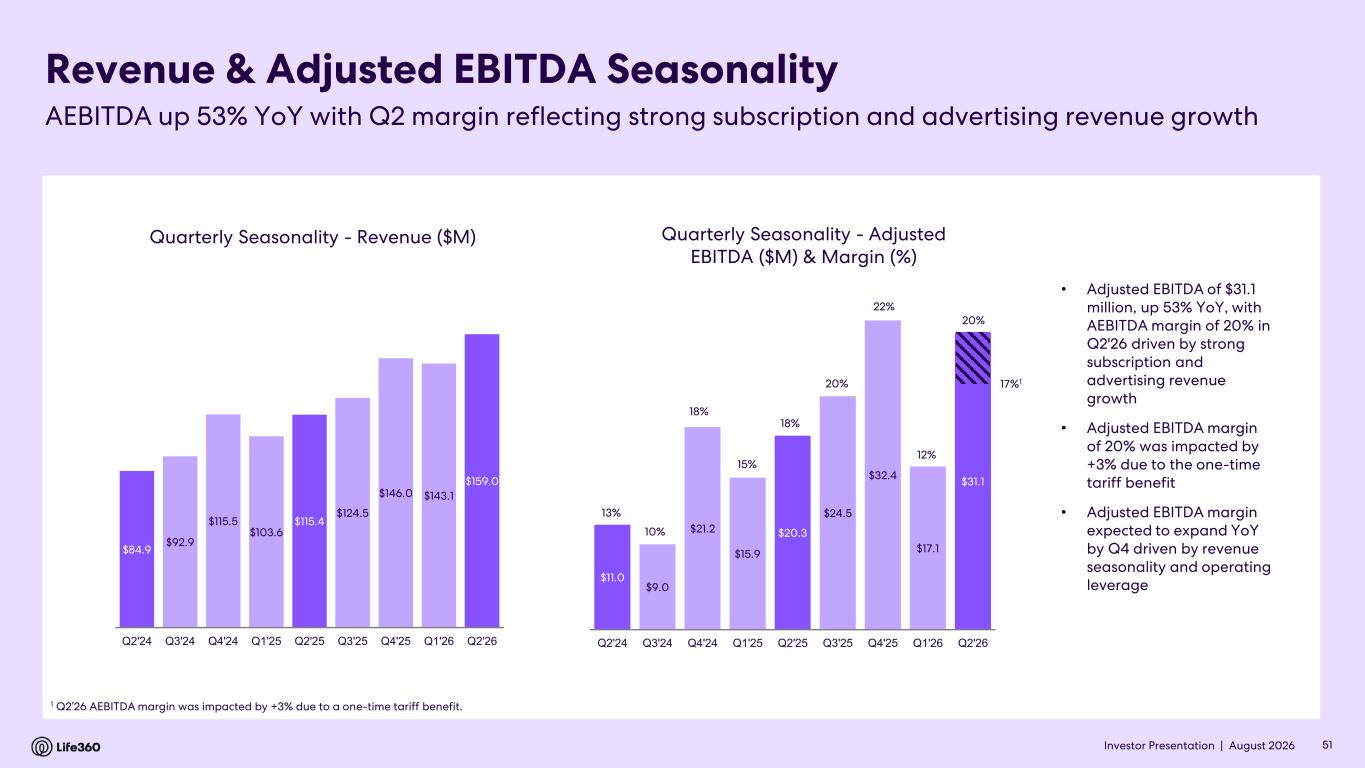
Investor Presentation | August 2026 Quarterly Seasonality - Revenue ($M) Revenue & Adjusted EBITDA Seasonality AEBITDA up 53% YoY with Q2 margin reflecting strong subscription and advertising revenue growth 51 Quarterly Seasonality - Adjusted EBITDA ($M) & Margin (%) $84.9 $92.9 $115.5 $103.6 $115.4 $124.5 $146.0 $143.1 $159.0 Q2'24 Q3'24 Q4'24 Q1'25 Q2'25 Q3'25 Q4'25 Q1'26 Q2'26 $11.0 $9.0 $21.2 $15.9 $20.3 $24.5 $32.4 $17.1 $31.1 13% 10% 18% 15% 18% 20% 22% 12% 20% 0% 5% 10% 15% 20% 25% $0.0 $5.0 $10.0 $15.0 $20.0 $25.0 $30.0 $35.0 Q2'24 Q3'24 Q4'24 Q1'25 Q2'25 Q3'25 Q4'25 Q1'26 Q2'26 • Adjusted EBITDA of $31.1 million, up 53% YoY, with AEBITDA margin of 20% in Q2'26 driven by strong subscription and advertising revenue growth • Adjusted EBITDA margin of 20% was impacted by +3% due to the one-time tariff benefit • Adjusted EBITDA margin expected to expand YoY by Q4 driven by revenue seasonality and operating leverage 1 Q2’26 AEBITDA margin was impacted by +3% due to a one-time tariff benefit. 17%1

Investor Presentation | August 2026 04 FY2026 Outlook
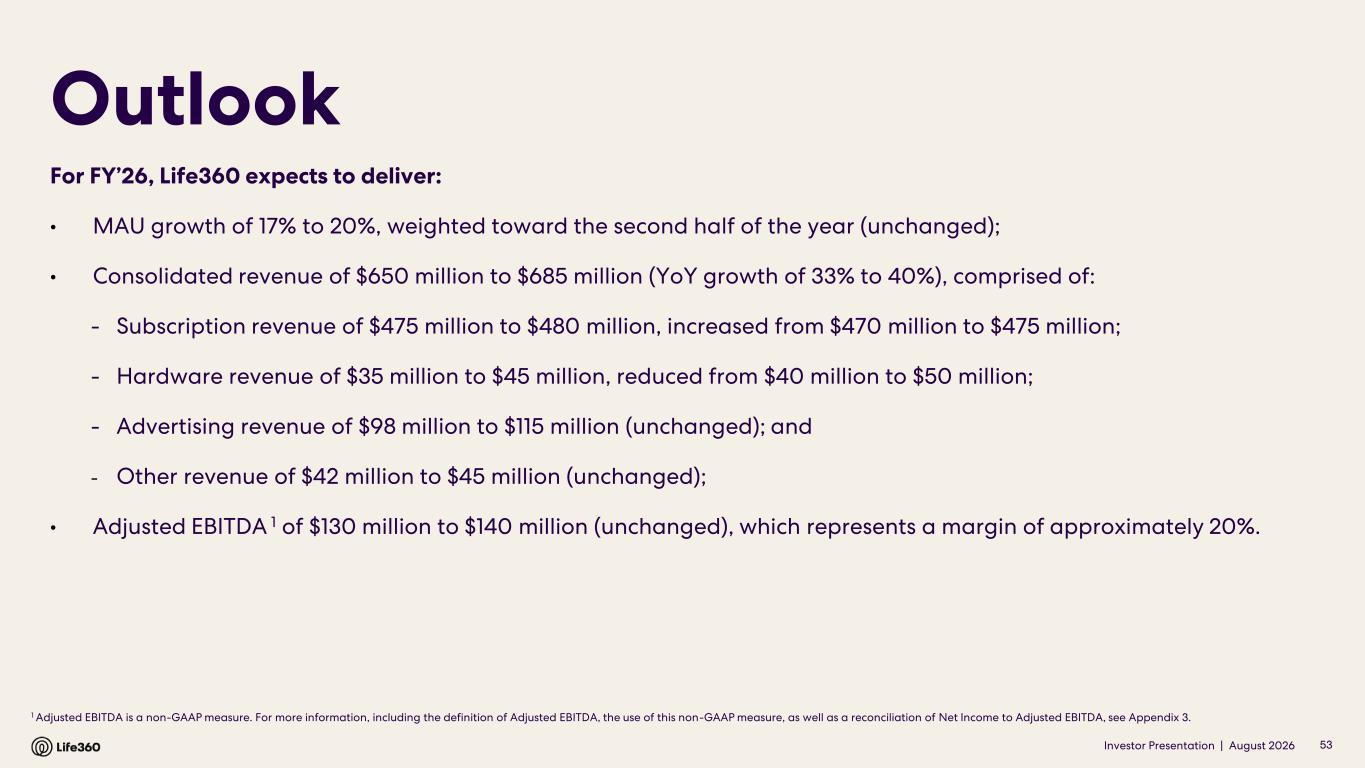
Investor Presentation | August 2026 1 Adjusted EBITDA is a non-GAAP measure. For more information, including the definition of Adjusted EBITDA, the use of this non-GAAP measure, as well as a reconciliation of Net Income to Adjusted EBITDA, see Appendix 3. Outlook 53 For FY’26, Life360 expects to deliver: • MAU growth of 17% to 20%, weighted toward the second half of the year (unchanged); • Consolidated revenue of $650 million to $685 million (YoY growth of 33% to 40%), comprised of: - Subscription revenue of $475 million to $480 million, increased from $470 million to $475 million; - Hardware revenue of $35 million to $45 million, reduced from $40 million to $50 million; - Advertising revenue of $98 million to $115 million (unchanged); and - Other revenue of $42 million to $45 million (unchanged); • Adjusted EBITDA 1 of $130 million to $140 million (unchanged), which represents a margin of approximately 20%.

Investor Presentation | August 2026 05 Appendix
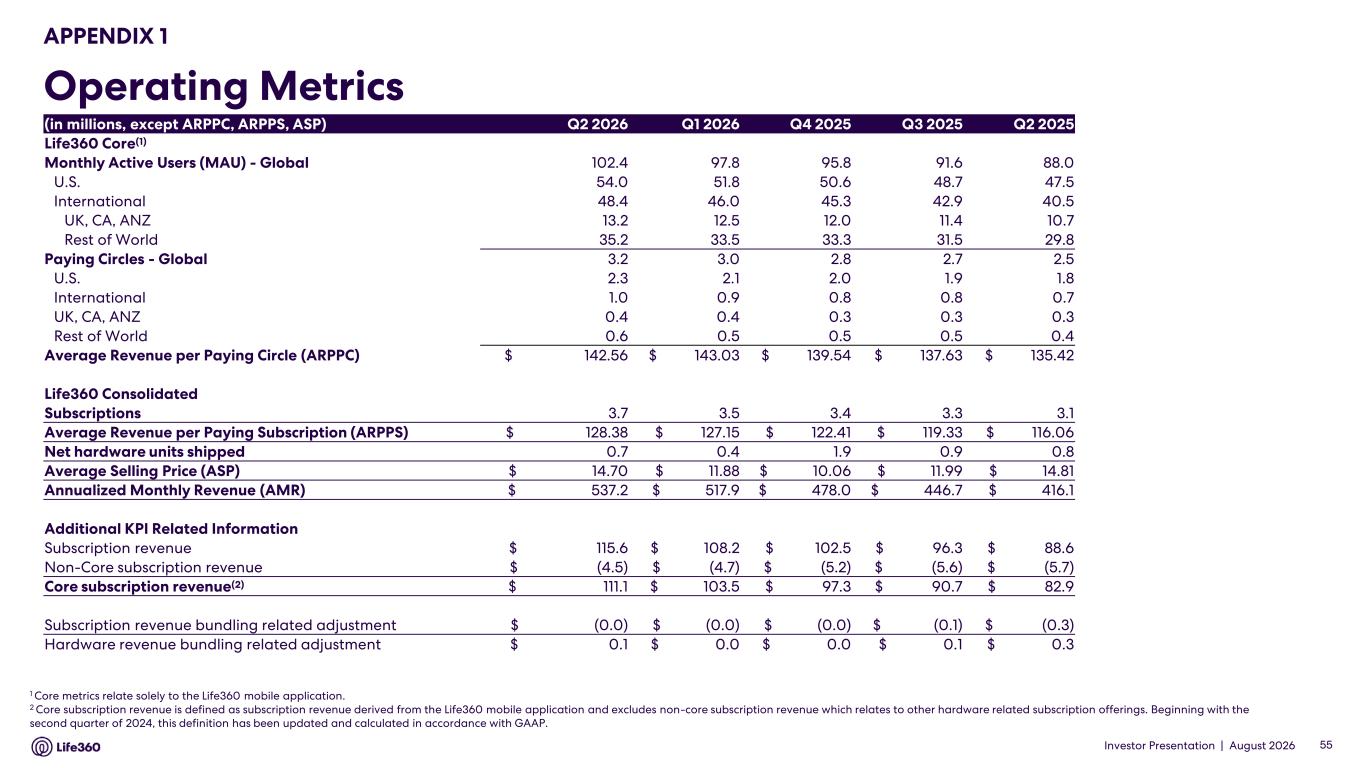
Investor Presentation | August 2026 APPENDIX 1 Operating Metrics 1 Core metrics relate solely to the Life360 mobile application. 2 Core subscription revenue is defined as subscription revenue derived from the Life360 mobile application and excludes non-core subscription revenue which relates to other hardware related subscription offerings. Beginning with the second quarter of 2024, this definition has been updated and calculated in accordance with GAAP. 55 (in millions, except ARPPC, ARPPS, ASP) Q2 2026 Q1 2026 Q4 2025 Q3 2025 Q2 2025 Life360 Core(1) Monthly Active Users (MAU) - Global 102.4 97.8 95.8 91.6 88.0 U.S. 54.0 51.8 50.6 48.7 47.5 International 48.4 46.0 45.3 42.9 40.5 UK, CA, ANZ 13.2 12.5 12.0 11.4 10.7 Rest of World 35.2 33.5 33.3 31.5 29.8 Paying Circles - Global 3.2 3.0 2.8 2.7 2.5 U.S. 2.3 2.1 2.0 1.9 1.8 International 1.0 0.9 0.8 0.8 0.7 UK, CA, ANZ 0.4 0.4 0.3 0.3 0.3 Rest of World 0.6 0.5 0.5 0.5 0.4 Average Revenue per Paying Circle (ARPPC) $ 142.56 $ 143.03 $ 139.54 $ 137.63 $ 135.42 Life360 Consolidated Subscriptions 3.7 3.5 3.4 3.3 3.1 Average Revenue per Paying Subscription (ARPPS) $ 128.38 $ 127.15 $ 122.41 $ 119.33 $ 116.06 Net hardware units shipped 0.7 0.4 1.9 0.9 0.8 Average Selling Price (ASP) $ 14.70 $ 11.88 $ 10.06 $ 11.99 $ 14.81 Annualized Monthly Revenue (AMR) $ 537.2 $ 517.9 $ 478.0 $ 446.7 $ 416.1 Additional KPI Related Information Subscription revenue $ 115.6 $ 108.2 $ 102.5 $ 96.3 $ 88.6 Non-Core subscription revenue $ (4.5) $ (4.7) $ (5.2) $ (5.6) $ (5.7) Core subscription revenue(2) $ 111.1 $ 103.5 $ 97.3 $ 90.7 $ 82.9 Subscription revenue bundling related adjustment $ (0.0) $ (0.0) $ (0.0) $ (0.1) $ (0.3) Hardware revenue bundling related adjustment $ 0.1 $ 0.0 $ 0.0 $ 0.1 $ 0.3
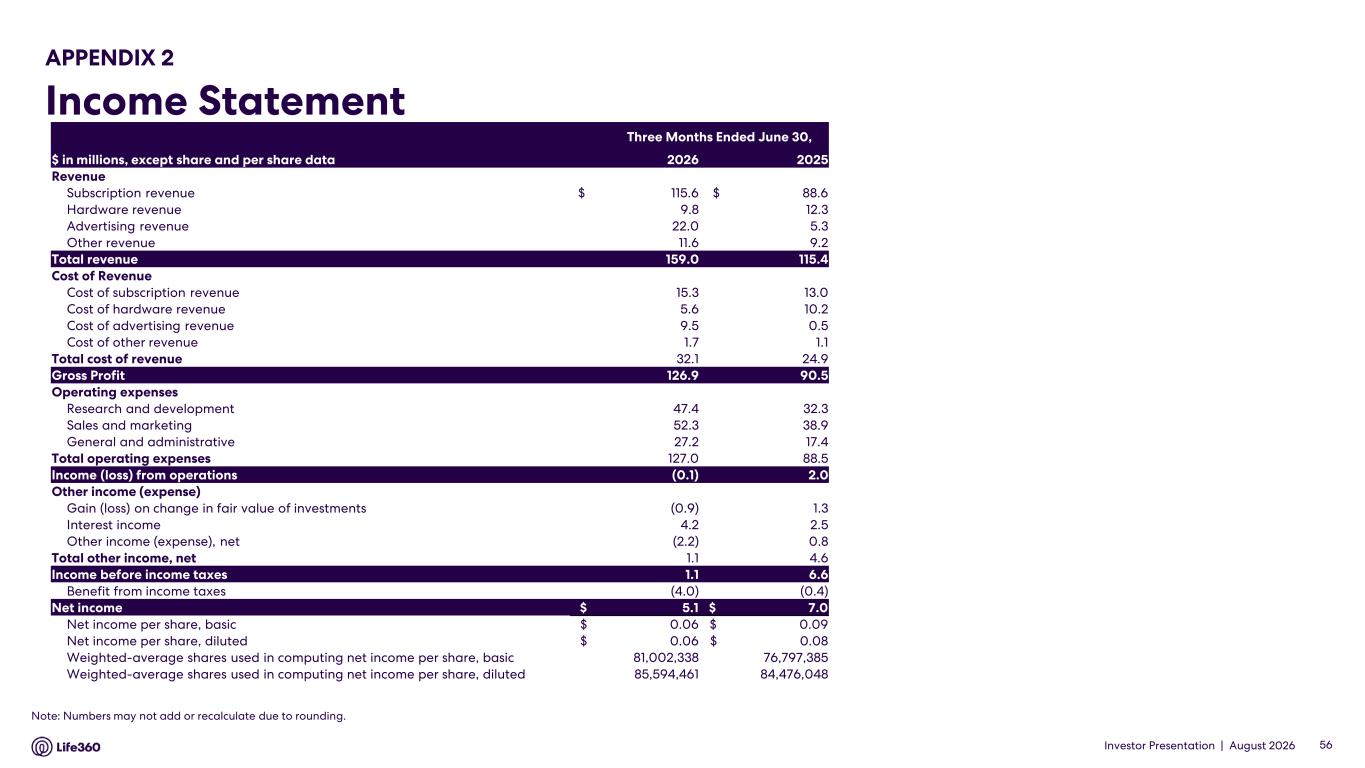
Investor Presentation | August 2026 APPENDIX 2 Income Statement 56 Note: Numbers may not add or recalculate due to rounding. Three Months Ended June 30, $ in millions, except share and per share data 2026 2025 Revenue Subscription revenue $ 115.6 $ 88.6 Hardware revenue 9.8 12.3 Advertising revenue 22.0 5.3 Other revenue 11.6 9.2 Total revenue 159.0 115.4 Cost of Revenue Cost of subscription revenue 15.3 13.0 Cost of hardware revenue 5.6 10.2 Cost of advertising revenue 9.5 0.5 Cost of other revenue 1.7 1.1 Total cost of revenue 32.1 24.9 Gross Profit 126.9 90.5 Operating expenses Research and development 47.4 32.3 Sales and marketing 52.3 38.9 General and administrative 27.2 17.4 Total operating expenses 127.0 88.5 Income (loss) from operations (0.1) 2.0 Other income (expense) Gain (loss) on change in fair value of investments (0.9) 1.3 Interest income 4.2 2.5 Other income (expense), net (2.2) 0.8 Total other income, net 1.1 4.6 Income before income taxes 1.1 6.6 Benefit from income taxes (4.0) (0.4) Net income $ 5.1 $ 7.0 Net income per share, basic $ 0.06 $ 0.09 Net income per share, diluted $ 0.06 $ 0.08 Weighted-average shares used in computing net income per share, basic 81,002,338 76,797,385 Weighted-average shares used in computing net income per share, diluted 85,594,461 84,476,048
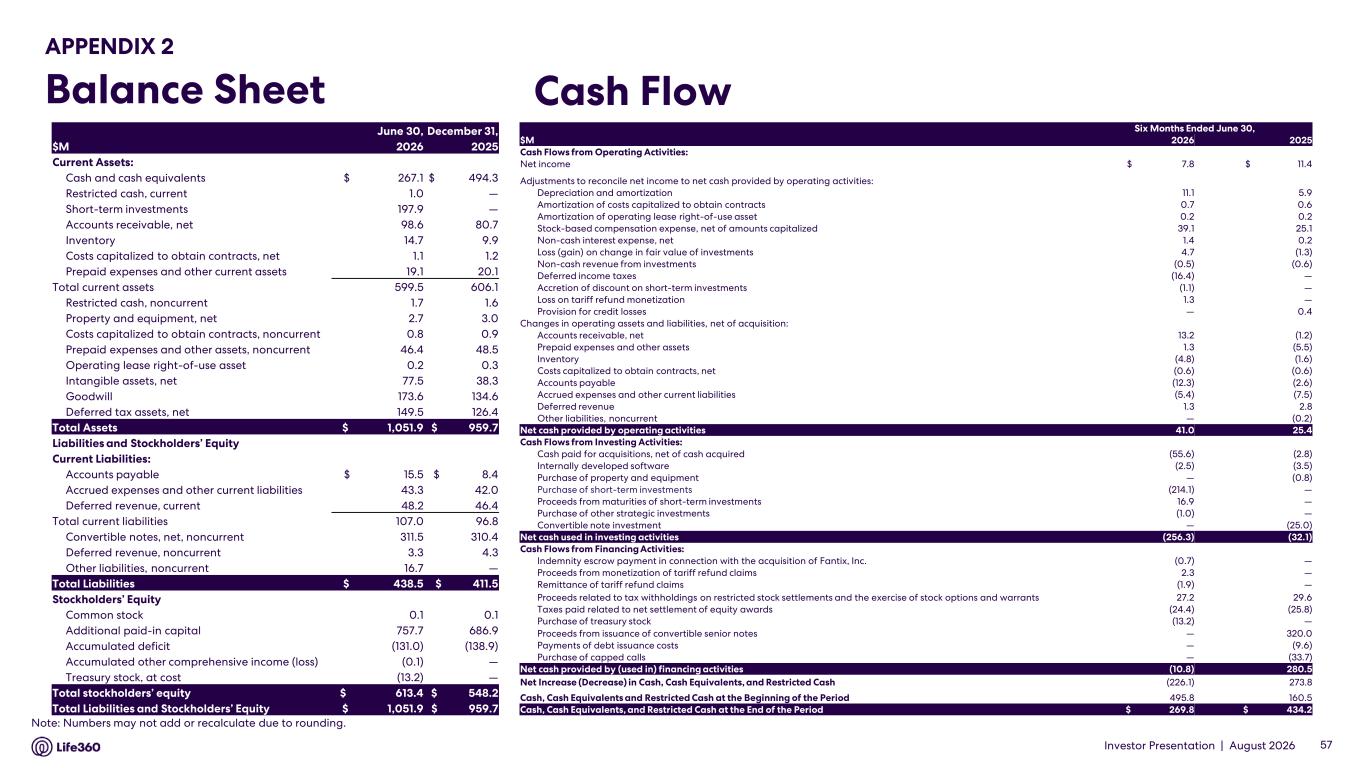
Investor Presentation | August 2026 APPENDIX 2 Balance Sheet Cash Flow 57 Note: Numbers may not add or recalculate due to rounding. June 30, December 31, $M 2026 2025 Current Assets: Cash and cash equivalents $ 267.1 $ 494.3 Restricted cash, current 1.0 — Short-term investments 197.9 — Accounts receivable, net 98.6 80.7 Inventory 14.7 9.9 Costs capitalized to obtain contracts, net 1.1 1.2 Prepaid expenses and other current assets 19.1 20.1 Total current assets 599.5 606.1 Restricted cash, noncurrent 1.7 1.6 Property and equipment, net 2.7 3.0 Costs capitalized to obtain contracts, noncurrent 0.8 0.9 Prepaid expenses and other assets, noncurrent 46.4 48.5 Operating lease right-of-use asset 0.2 0.3 Intangible assets, net 77.5 38.3 Goodwill 173.6 134.6 Deferred tax assets, net 149.5 126.4 Total Assets $ 1,051.9 $ 959.7 Liabilities and Stockholders’ Equity Current Liabilities: Accounts payable $ 15.5 $ 8.4 Accrued expenses and other current liabilities 43.3 42.0 Deferred revenue, current 48.2 46.4 Total current liabilities 107.0 96.8 Convertible notes, net, noncurrent 311.5 310.4 Deferred revenue, noncurrent 3.3 4.3 Other liabilities, noncurrent 16.7 — Total Liabilities $ 438.5 $ 411.5 Stockholders’ Equity Common stock 0.1 0.1 Additional paid-in capital 757.7 686.9 Accumulated deficit (131.0) (138.9) Accumulated other comprehensive income (loss) (0.1) — Treasury stock, at cost (13.2) — Total stockholders’ equity $ 613.4 $ 548.2 Total Liabilities and Stockholders’ Equity $ 1,051.9 $ 959.7 Six Months Ended June 30, $M 2026 2025 Cash Flows from Operating Activities: Net income $ 7.8 $ 11.4 Adjustments to reconcile net income to net cash provided by operating activities: Depreciation and amortization 11.1 5.9 Amortization of costs capitalized to obtain contracts 0.7 0.6 Amortization of operating lease right-of-use asset 0.2 0.2 Stock-based compensation expense, net of amounts capitalized 39.1 25.1 Non-cash interest expense, net 1.4 0.2 Loss (gain) on change in fair value of investments 4.7 (1.3) Non-cash revenue from investments (0.5) (0.6) Deferred income taxes (16.4) — Accretion of discount on short-term investments (1.1) — Loss on tariff refund monetization 1.3 — Provision for credit losses — 0.4 Changes in operating assets and liabilities, net of acquisition: Accounts receivable, net 13.2 (1.2) Prepaid expenses and other assets 1.3 (5.5) Inventory (4.8) (1.6) Costs capitalized to obtain contracts, net (0.6) (0.6) Accounts payable (12.3) (2.6) Accrued expenses and other current liabilities (5.4) (7.5) Deferred revenue 1.3 2.8 Other liabilities, noncurrent — (0.2) Net cash provided by operating activities 41.0 25.4 Cash Flows from Investing Activities: Cash paid for acquisitions, net of cash acquired (55.6) (2.8) Internally developed software (2.5) (3.5) Purchase of property and equipment — (0.8) Purchase of short-term investments (214.1) — Proceeds from maturities of short-term investments 16.9 — Purchase of other strategic investments (1.0) — Convertible note investment — (25.0) Net cash used in investing activities (256.3) (32.1) Cash Flows from Financing Activities: Indemnity escrow payment in connection with the acquisition of Fantix, Inc. (0.7) — Proceeds from monetization of tariff refund claims 2.3 — Remittance of tariff refund claims (1.9) — Proceeds related to tax withholdings on restricted stock settlements and the exercise of stock options and warrants 27.2 29.6 Taxes paid related to net settlement of equity awards (24.4) (25.8) Purchase of treasury stock (13.2) — Proceeds from issuance of convertible senior notes — 320.0 Payments of debt issuance costs — (9.6) Purchase of capped calls — (33.7) Net cash provided by (used in) financing activities (10.8) 280.5 Net Increase (Decrease) in Cash, Cash Equivalents, and Restricted Cash (226.1) 273.8 Cash, Cash Equivalents and Restricted Cash at the Beginning of the Period 495.8 160.5 Cash, Cash Equivalents, and Restricted Cash at the End of the Period $ 269.8 $ 434.2
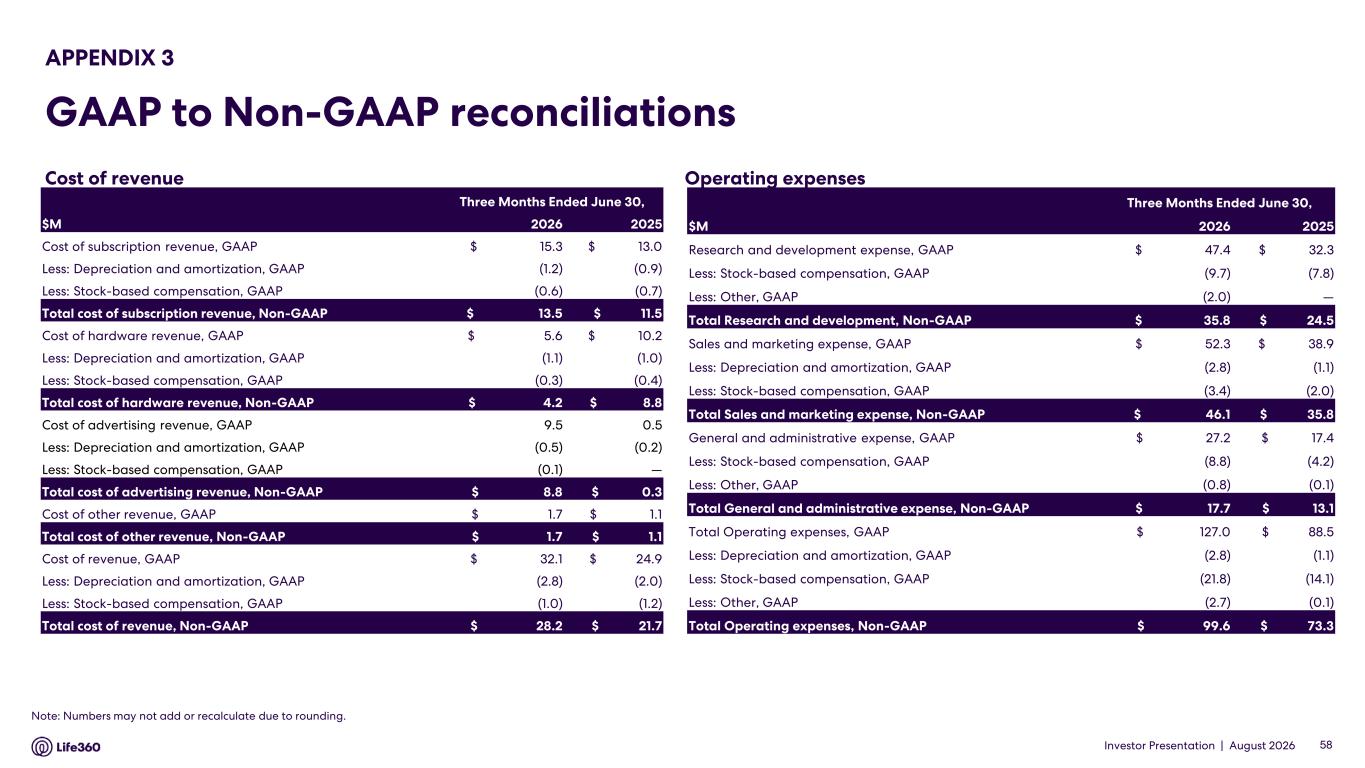
Investor Presentation | August 2026 Operating expenses APPENDIX 3 GAAP to Non-GAAP reconciliations 58 Note: Numbers may not add or recalculate due to rounding. Cost of revenue Three Months Ended June 30, $M 2026 2025 Cost of subscription revenue, GAAP $ 15.3 $ 13.0 Less: Depreciation and amortization, GAAP (1.2) (0.9) Less: Stock-based compensation, GAAP (0.6) (0.7) Total cost of subscription revenue, Non-GAAP $ 13.5 $ 11.5 Cost of hardware revenue, GAAP $ 5.6 $ 10.2 Less: Depreciation and amortization, GAAP (1.1) (1.0) Less: Stock-based compensation, GAAP (0.3) (0.4) Total cost of hardware revenue, Non-GAAP $ 4.2 $ 8.8 Cost of advertising revenue, GAAP 9.5 0.5 Less: Depreciation and amortization, GAAP (0.5) (0.2) Less: Stock-based compensation, GAAP (0.1) — Total cost of advertising revenue, Non-GAAP $ 8.8 $ 0.3 Cost of other revenue, GAAP $ 1.7 $ 1.1 Total cost of other revenue, Non-GAAP $ 1.7 $ 1.1 Cost of revenue, GAAP $ 32.1 $ 24.9 Less: Depreciation and amortization, GAAP (2.8) (2.0) Less: Stock-based compensation, GAAP (1.0) (1.2) Total cost of revenue, Non-GAAP $ 28.2 $ 21.7 Three Months Ended June 30, $M 2026 2025 Research and development expense, GAAP $ 47.4 $ 32.3 Less: Stock-based compensation, GAAP (9.7) (7.8) Less: Other, GAAP (2.0) — Total Research and development, Non-GAAP $ 35.8 $ 24.5 Sales and marketing expense, GAAP $ 52.3 $ 38.9 Less: Depreciation and amortization, GAAP (2.8) (1.1) Less: Stock-based compensation, GAAP (3.4) (2.0) Total Sales and marketing expense, Non-GAAP $ 46.1 $ 35.8 General and administrative expense, GAAP $ 27.2 $ 17.4 Less: Stock-based compensation, GAAP (8.8) (4.2) Less: Other, GAAP (0.8) (0.1) Total General and administrative expense, Non-GAAP $ 17.7 $ 13.1 Total Operating expenses, GAAP $ 127.0 $ 88.5 Less: Depreciation and amortization, GAAP (2.8) (1.1) Less: Stock-based compensation, GAAP (21.8) (14.1) Less: Other, GAAP (2.7) (0.1) Total Operating expenses, Non-GAAP $ 99.6 $ 73.3
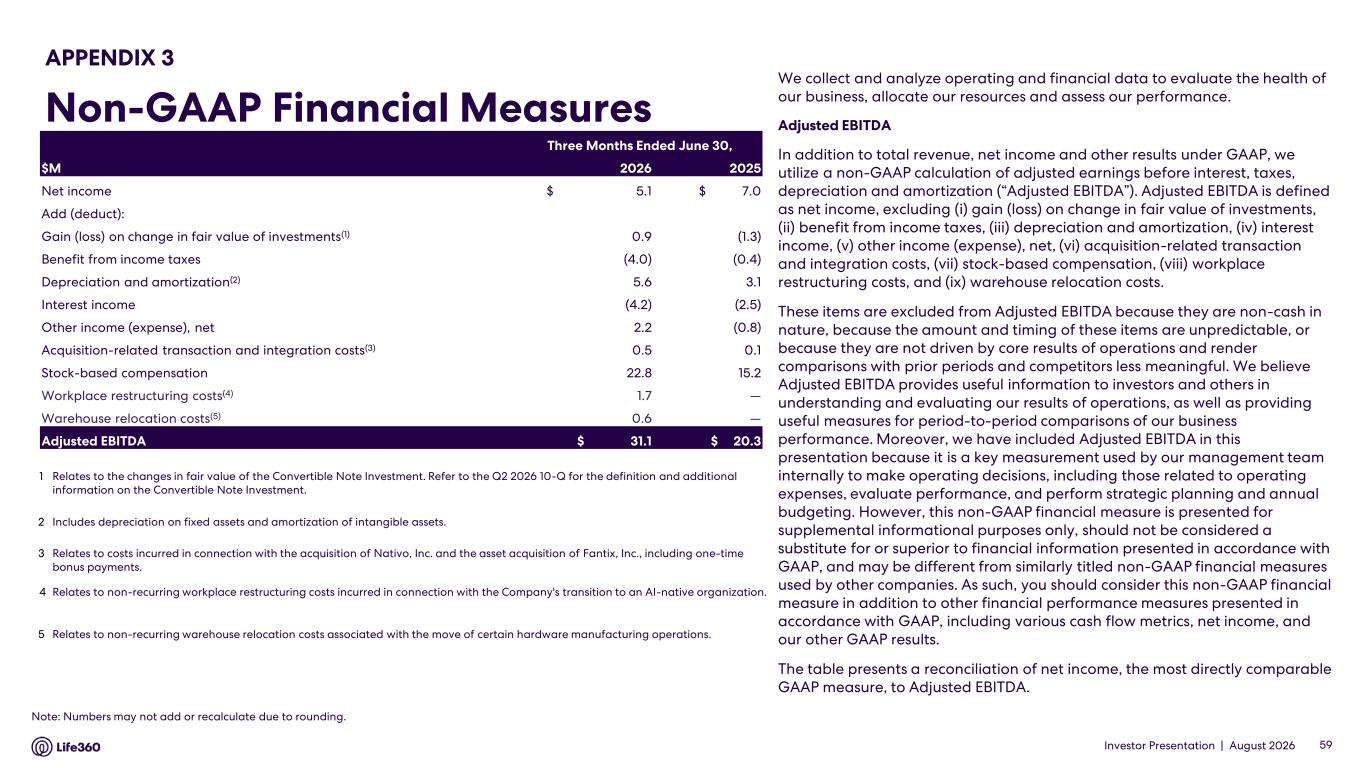
Investor Presentation | August 2026 We collect and analyze operating and financial data to evaluate the health of our business, allocate our resources and assess our performance. Adjusted EBITDA In addition to total revenue, net income and other results under GAAP, we utilize a non-GAAP calculation of adjusted earnings before interest, taxes, depreciation and amortization (“Adjusted EBITDA”). Adjusted EBITDA is defined as net income, excluding (i) gain (loss) on change in fair value of investments, (ii) benefit from income taxes, (iii) depreciation and amortization, (iv) interest income, (v) other income (expense), net, (vi) acquisition-related transaction and integration costs, (vii) stock-based compensation, (viii) workplace restructuring costs, and (ix) warehouse relocation costs. These items are excluded from Adjusted EBITDA because they are non-cash in nature, because the amount and timing of these items are unpredictable, or because they are not driven by core results of operations and render comparisons with prior periods and competitors less meaningful. We believe Adjusted EBITDA provides useful information to investors and others in understanding and evaluating our results of operations, as well as providing useful measures for period-to-period comparisons of our business performance. Moreover, we have included Adjusted EBITDA in this presentation because it is a key measurement used by our management team internally to make operating decisions, including those related to operating expenses, evaluate performance, and perform strategic planning and annual budgeting. However, this non-GAAP financial measure is presented for supplemental informational purposes only, should not be considered a substitute for or superior to financial information presented in accordance with GAAP, and may be different from similarly titled non-GAAP financial measures used by other companies. As such, you should consider this non-GAAP financial measure in addition to other financial performance measures presented in accordance with GAAP, including various cash flow metrics, net income, and our other GAAP results. The table presents a reconciliation of net income, the most directly comparable GAAP measure, to Adjusted EBITDA. 59 APPENDIX 3 Non-GAAP Financial Measures Note: Numbers may not add or recalculate due to rounding. Three Months Ended June 30, $M 2026 2025 Net income $ 5.1 $ 7.0 Add (deduct): Gain (loss) on change in fair value of investments(1) 0.9 (1.3) Benefit from income taxes (4.0) (0.4) Depreciation and amortization(2) 5.6 3.1 Interest income (4.2) (2.5) Other income (expense), net 2.2 (0.8) Acquisition-related transaction and integration costs(3) 0.5 0.1 Stock-based compensation 22.8 15.2 Workplace restructuring costs(4) 1.7 — Warehouse relocation costs(5) 0.6 — Adjusted EBITDA $ 31.1 $ 20.3 1 Relates to the changes in fair value of the Convertible Note Investment. Refer to the Q2 2026 10-Q for the definition and additional information on the Convertible Note Investment. 2 Includes depreciation on fixed assets and amortization of intangible assets. 3 Relates to costs incurred in connection with the acquisition of Nativo, Inc. and the asset acquisition of Fantix, Inc., including one-time bonus payments. 4 Relates to non-recurring workplace restructuring costs incurred in connection with the Company's transition to an AI-native organization. 5 Relates to non-recurring warehouse relocation costs associated with the move of certain hardware manufacturing operations.
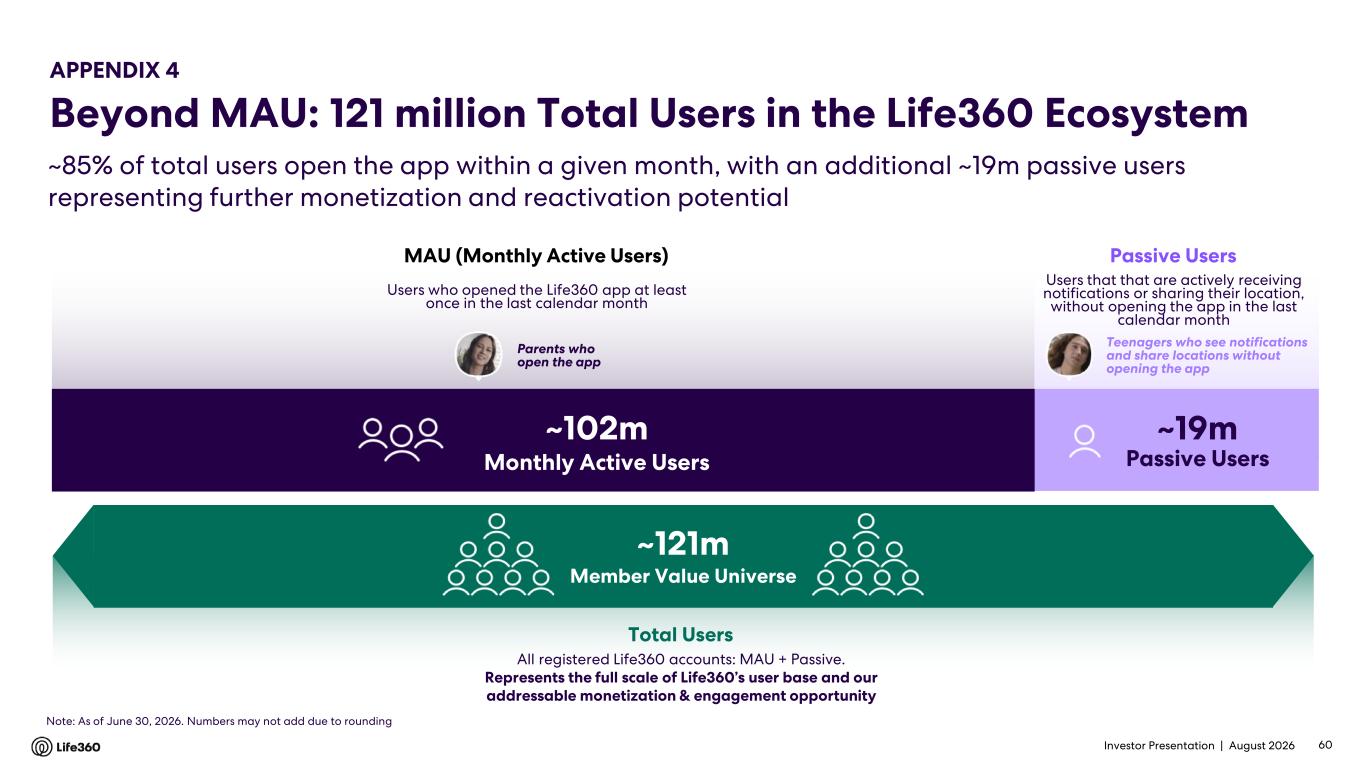
Investor Presentation | August 2026 ~85% of total users open the app within a given month, with an additional ~19m passive users representing further monetization and reactivation potential All registered Life360 accounts: MAU + Passive. Represents the full scale of Life360’s user base and our addressable monetization & engagement opportunity Total Users APPENDIX 4 Beyond MAU: 121 million Total Users in the Life360 Ecosystem ~121m Member Value Universe Users that that are actively receiving notifications or sharing their location, without opening the app in the last calendar month Passive Users Teenagers who see notifications and share locations without opening the app ~19m Passive Users Users who opened the Life360 app at least once in the last calendar month MAU (Monthly Active Users) ~102m Monthly Active Users Parents who open the app 60 Note: As of June 30, 2026. Numbers may not add due to rounding
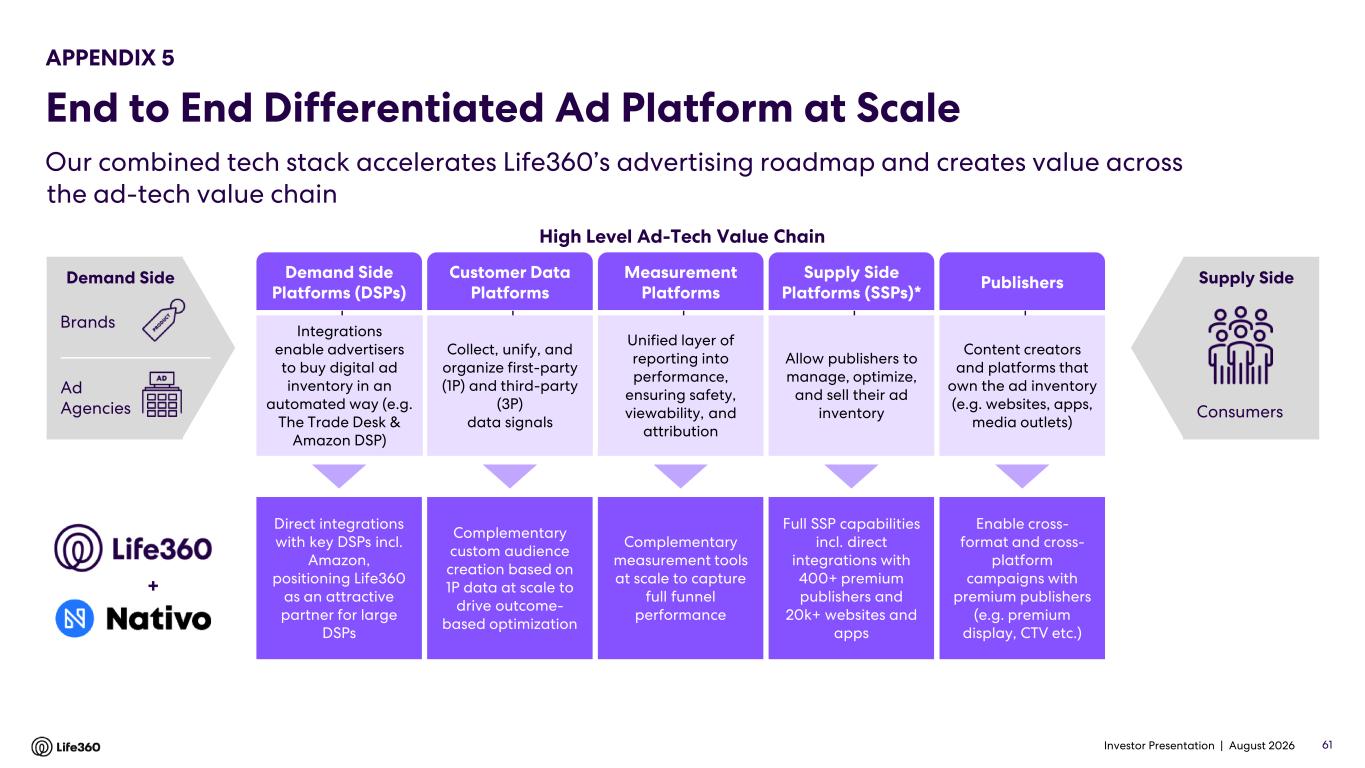
Investor Presentation | August 2026 Our combined tech stack accelerates Life360’s advertising roadmap and creates value across the ad-tech value chain 61 Demand Side Platforms (DSPs) Customer Data Platforms Measurement Platforms Supply Side Platforms (SSPs)* Publishers High Level Ad-Tech Value Chain Allow publishers to manage, optimize, and sell their ad inventory Collect, unify, and organize first-party (1P) and third-party (3P) data signals Unified layer of reporting into performance, ensuring safety, viewability, and attribution Content creators and platforms that own the ad inventory (e.g. websites, apps, media outlets) Integrations enable advertisers to buy digital ad inventory in an automated way (e.g. The Trade Desk & Amazon DSP) Consumers Supply Side Enable cross- format and cross- platform campaigns with premium publishers (e.g. premium display, CTV etc.) Complementary custom audience creation based on 1P data at scale to drive outcome- based optimization Direct integrations with key DSPs incl. Amazon, positioning Life360 as an attractive partner for large DSPs Full SSP capabilities incl. direct integrations with 400+ premium publishers and 20k+ websites and apps Complementary measurement tools at scale to capture full funnel performance + Brands Ad Agencies Demand Side APPENDIX 5 End to End Differentiated Ad Platform at Scale
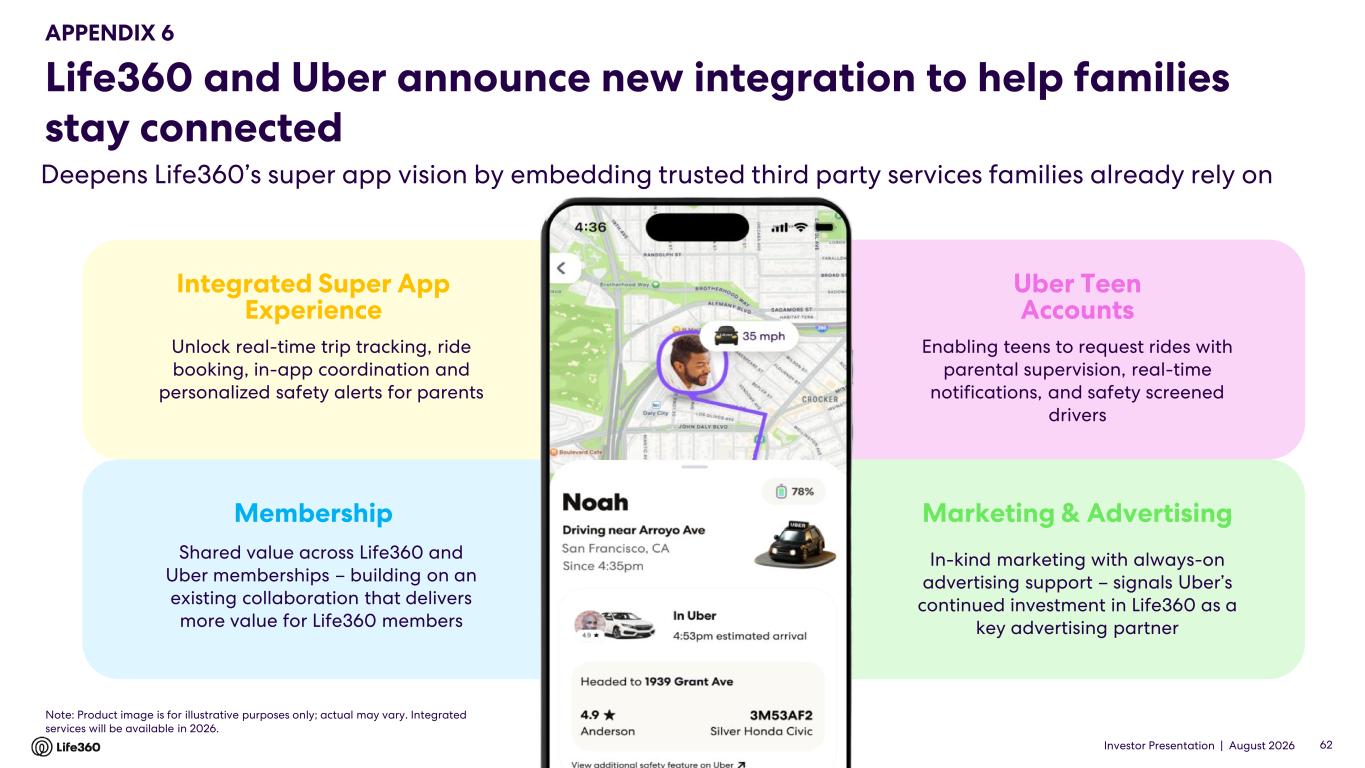
Investor Presentation | August 2026 Life360 and Uber announce new integration to help families stay connected Deepens Life360’s super app vision by embedding trusted third party services families already rely on 62 Integrated Super App Experience Membership Uber Teen Accounts Marketing & Advertising Shared value across Life360 and Uber memberships – building on an existing collaboration that delivers more value for Life360 members Unlock real-time trip tracking, ride booking, in-app coordination and personalized safety alerts for parents In-kind marketing with always-on advertising support – signals Uber’s continued investment in Life360 as a key advertising partner Enabling teens to request rides with parental supervision, real-time notifications, and safety screened drivers Note: Product image is for illustrative purposes only; actual may vary. Integrated services will be available in 2026. APPENDIX 6
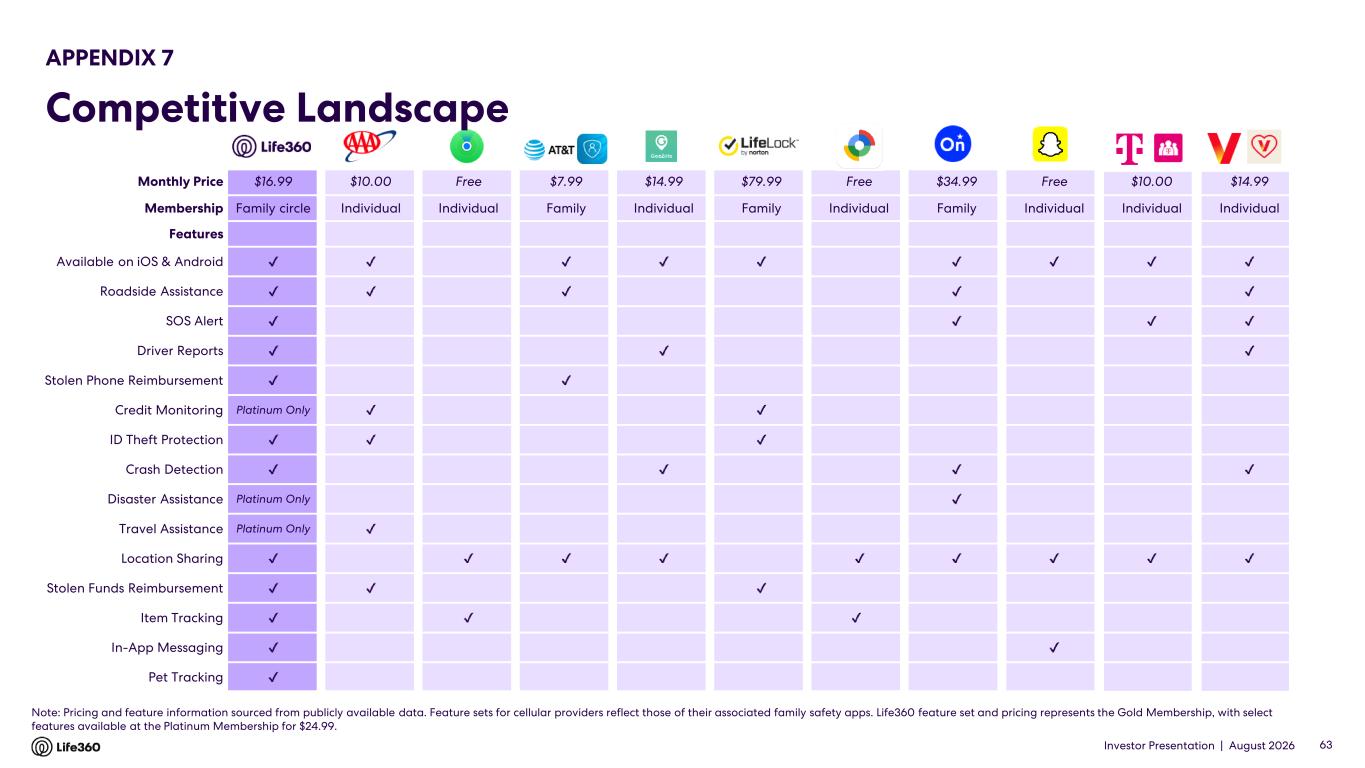
Investor Presentation | August 2026 Note: Pricing and feature information sourced from publicly available data. Feature sets for cellular providers reflect those of their associated family safety apps. Life360 feature set and pricing represents the Gold Membership, with select features available at the Platinum Membership for $24.99. APPENDIX 7 Competitive Landscape 63 Monthly Price $16.99 $10.00 Free $7.99 $14.99 $79.99 Free $34.99 Free $10.00 $14.99 Membership Family circle Individual Individual Family Individual Family Individual Family Individual Individual Individual Features Available on iOS & Android Roadside Assistance SOS Alert Driver Reports Stolen Phone Reimbursement Credit Monitoring Platinum Only ID Theft Protection Crash Detection Disaster Assistance Platinum Only Travel Assistance Platinum Only Location Sharing Stolen Funds Reimbursement Item Tracking In-App Messaging Pet Tracking

Investor Presentation | August 2026 Thank you.