
UNITED STATES
SECURITIES AND EXCHANGE COMMISSION
Washington, D.C. 20549
______________
FORM 8-K
CURRENT REPORT
Pursuant to Section 13 or 15(d) of the
Securities Exchange Act of 1934
Date of Report (Date of earliest event reported): November 9, 2026
(Exact name of registrant as specified in its charter)
(State or other jurisdiction of incorporation or organization) | (Commission File Number) | (I.R.S. Employer Identification No.) | ||||||
2261 Market Street, Suite 82184 San Francisco, CA 94114 | ||
(Address of principal executive office, including zip code)(1) | ||
( | ||
| (Registrant’s telephone number, including area code) | ||
1900 South Norfolk Street, Suite 310 San Mateo, CA 94403 | ||
| (Former name or former address, if changed since last report) | ||
______________
Check the appropriate box below if the Form 8-K filing is intended to simultaneously satisfy the filing obligation of the registrant under any of the following provisions:
| Written communications pursuant to Rule 425 under the Securities Act (17 CFR 230.425) | |||||
| Soliciting material pursuant to Rule 14a-12 under the Exchange Act (17 CFR 240.14a-12) | |||||
| Pre-commencement communications pursuant to Rule 14d-2(b) under the Exchange Act (17 CFR 240.14d-2(b)) | |||||
| Pre-commencement communications pursuant to Rule 13e-4(c) under the Exchange Act (17 CFR 240.13e-4(c)) | |||||
| Title of each class | Trading Symbol(s) | Name of each exchange on which registered | ||||||
Common Stock, $0.001 par value per share | LIF | The Nasdaq Stock Market LLC | ||||||
Indicate by check mark whether the registrant is an emerging growth company as defined in Rule 405 of the Securities Act of 1933 (§230.405 of this chapter) or Rule 12b-2 of the Securities Exchange Act of 1934 (§240.12b-2 of this chapter).
Emerging growth company | ||
If an emerging growth company, indicate by check mark if the registrant has elected not to use the extended transition period for complying with any new or revised financial accounting standards provided pursuant to Section 13(a) of the Exchange Act. ☐ | ||
____________________
(1)We are a Delaware corporation with a globally distributed workforce and no corporate headquarters. Under the Securities and Exchange Commission's rules, we are required to designate a “principal executive office.” For purposes of this report, we have designated our mailing address in San Francisco, California as our principal executive office.
Item 2.02 Results of Operations and Financial Condition.
Life360, Inc., a Delaware corporation (“the Company”) is furnishing this Current Report on Form 8-K in connection with the disclosure of information, in the form of a media release and shareholder letter issued on November 9, 2026 . A copy of the media release and shareholder letter are furnished as Exhibits 99.1 and 99.2, respectively to this Current Report on Form 8-K. A conference call to discuss the Company’s financial results will be held on November 9, 2026 at 5:00 p.m. Eastern Time.
Item 7.01 Regulation FD Disclosure.
The Company is furnishing this Item 7.01 of this Current Report on Form 8-K in connection with the disclosure of information, in the form of an investor presentation issued on November 9, 2026 . A copy of the investor presentation is furnished herewith as Exhibit 99.3 to this Current Report on Form 8-K.
The information in Item 2.02 (including Exhibits 99.1 and 99.2) and Item 7.01 (including Exhibit 99.3) of this Current Report on Form 8-K is furnished and shall not be deemed to be “filed” for the purpose of Section 18 of the Securities Exchange Act of 1934, as amended (the “Exchange Act”) or otherwise subject to the liabilities of that section, nor shall it be deemed incorporated by reference into any filing under the Securities Act of 1933, as amended, or the Exchange Act, except as shall be expressly set forth by specific reference in such a filing.
The replay of the conference call and webcast will be available on the Company’s website located at www.investors.life360.com, although the Company reserves the right to discontinue that availability at any time.
Item 9.01 Financial Statements and Exhibits.
(d) Exhibits
| Exhibit No. | Description | ||||
| 99.1 | |||||
| 99.2 | |||||
| 99.3 | |||||
| 104 | Cover Page Interactive Data File - the cover page XBRL tags are embedded within the Inline XBRL document | ||||
SIGNATURES
Pursuant to the requirements of the Securities Exchange Act of 1934, the registrant has duly caused this report to be signed on its behalf by the undersigned hereunto duly authorized.
| LIFE360, INC. | |||||||||||
| Dated: | By: | /s/ Russell Burke | |||||||||
| Russell Burke | |||||||||||
| Chief Financial Officer | |||||||||||
(Principal Financial and Accounting Officer) | |||||||||||
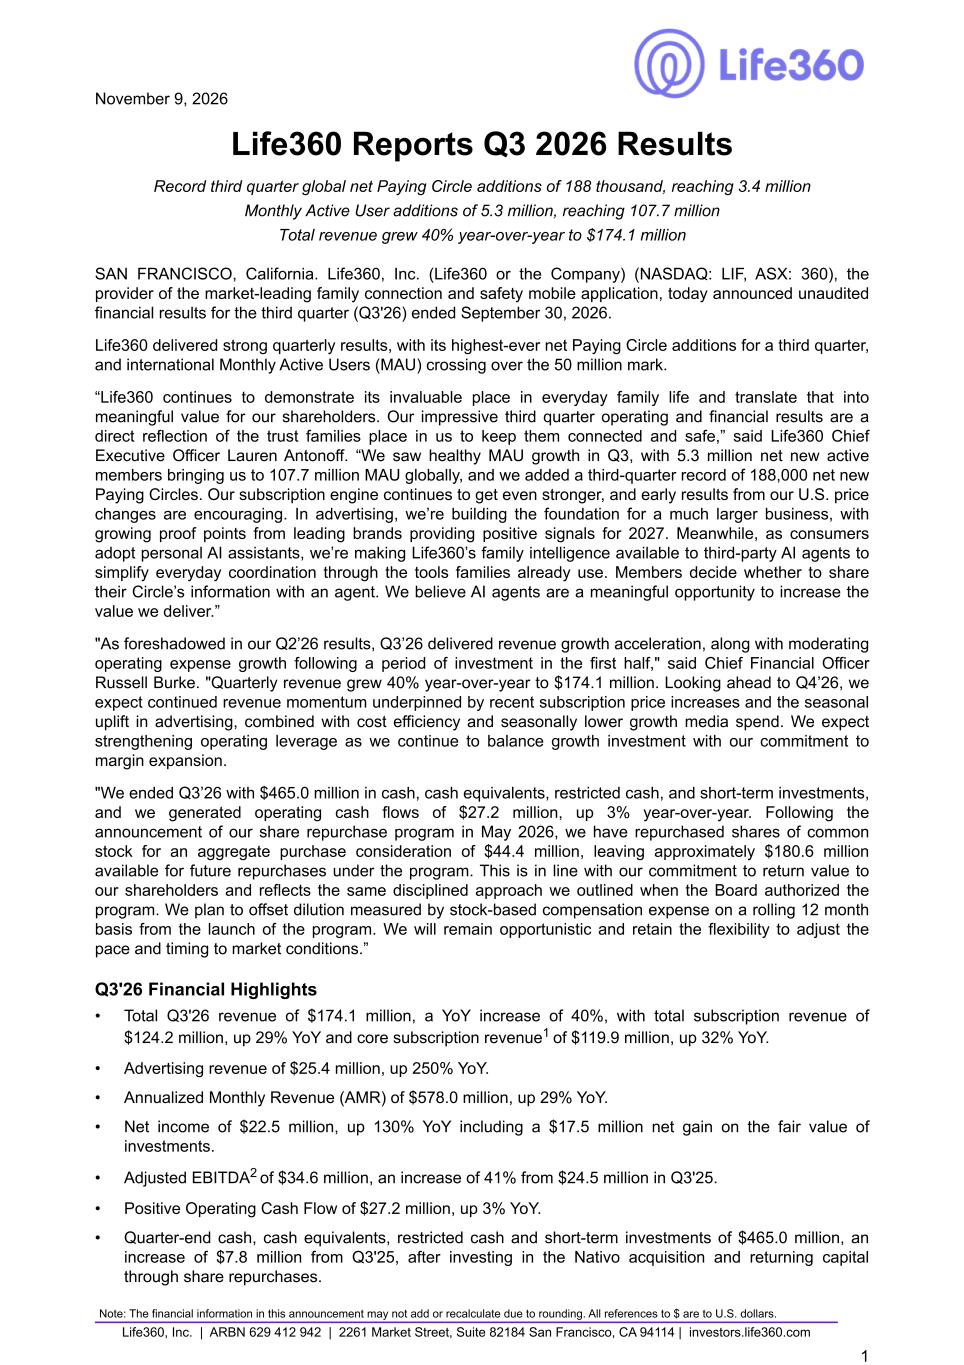
November 9, 2026 Life360 Reports Q3 2026 Results Record third quarter global net Paying Circle additions of 188 thousand, reaching 3.4 million Monthly Active User additions of 5.3 million, reaching 107.7 million Total revenue grew 40% year-over-year to $174.1 million SAN FRANCISCO, California. Life360, Inc. (Life360 or the Company) (NASDAQ: LIF, ASX: 360), the provider of the market-leading family connection and safety mobile application, today announced unaudited financial results for the third quarter (Q3'26) ended September 30, 2026. Life360 delivered strong quarterly results, with its highest-ever net Paying Circle additions for a third quarter, and international Monthly Active Users (MAU) crossing over the 50 million mark. “Life360 continues to demonstrate its invaluable place in everyday family life and translate that into meaningful value for our shareholders. Our impressive third quarter operating and financial results are a direct reflection of the trust families place in us to keep them connected and safe,” said Life360 Chief Executive Officer Lauren Antonoff. “We saw healthy MAU growth in Q3, with 5.3 million net new active members bringing us to 107.7 million MAU globally, and we added a third-quarter record of 188,000 net new Paying Circles. Our subscription engine continues to get even stronger, and early results from our U.S. price changes are encouraging. In advertising, we’re building the foundation for a much larger business, with growing proof points from leading brands providing positive signals for 2027. Meanwhile, as consumers adopt personal AI assistants, we’re making Life360’s family intelligence available to third-party AI agents to simplify everyday coordination through the tools families already use. Members decide whether to share their Circle’s information with an agent. We believe AI agents are a meaningful opportunity to increase the value we deliver.” "As foreshadowed in our Q2’26 results, Q3’26 delivered revenue growth acceleration, along with moderating operating expense growth following a period of investment in the first half," said Chief Financial Officer Russell Burke. "Quarterly revenue grew 40% year-over-year to $174.1 million. Looking ahead to Q4’26, we expect continued revenue momentum underpinned by recent subscription price increases and the seasonal uplift in advertising, combined with cost efficiency and seasonally lower growth media spend. We expect strengthening operating leverage as we continue to balance growth investment with our commitment to margin expansion. "We ended Q3’26 with $465.0 million in cash, cash equivalents, restricted cash, and short-term investments, and we generated operating cash flows of $27.2 million, up 3% year-over-year. Following the announcement of our share repurchase program in May 2026, we have repurchased shares of common stock for an aggregate purchase consideration of $44.4 million, leaving approximately $180.6 million available for future repurchases under the program. This is in line with our commitment to return value to our shareholders and reflects the same disciplined approach we outlined when the Board authorized the program. We plan to offset dilution measured by stock-based compensation expense on a rolling 12 month basis from the launch of the program. We will remain opportunistic and retain the flexibility to adjust the pace and timing to market conditions.” Q3'26 Financial Highlights • Total Q3'26 revenue of $174.1 million, a YoY increase of 40%, with total subscription revenue of $124.2 million, up 29% YoY and core subscription revenue1 of $119.9 million, up 32% YoY. • Advertising revenue of $25.4 million, up 250% YoY. • Annualized Monthly Revenue (AMR) of $578.0 million, up 29% YoY. • Net income of $22.5 million, up 130% YoY including a $17.5 million net gain on the fair value of investments. • Adjusted EBITDA2 of $34.6 million, an increase of 41% from $24.5 million in Q3'25. • Positive Operating Cash Flow of $27.2 million, up 3% YoY. • Quarter-end cash, cash equivalents, restricted cash and short-term investments of $465.0 million, an increase of $7.8 million from Q3'25, after investing in the Nativo acquisition and returning capital through share repurchases. Note: The financial information in this announcement may not add or recalculate due to rounding. All references to $ are to U.S. dollars. Life360, Inc. | ARBN 629 412 942 | 2261 Market Street, Suite 82184 San Francisco, CA 94114 | investors.life360.com 1
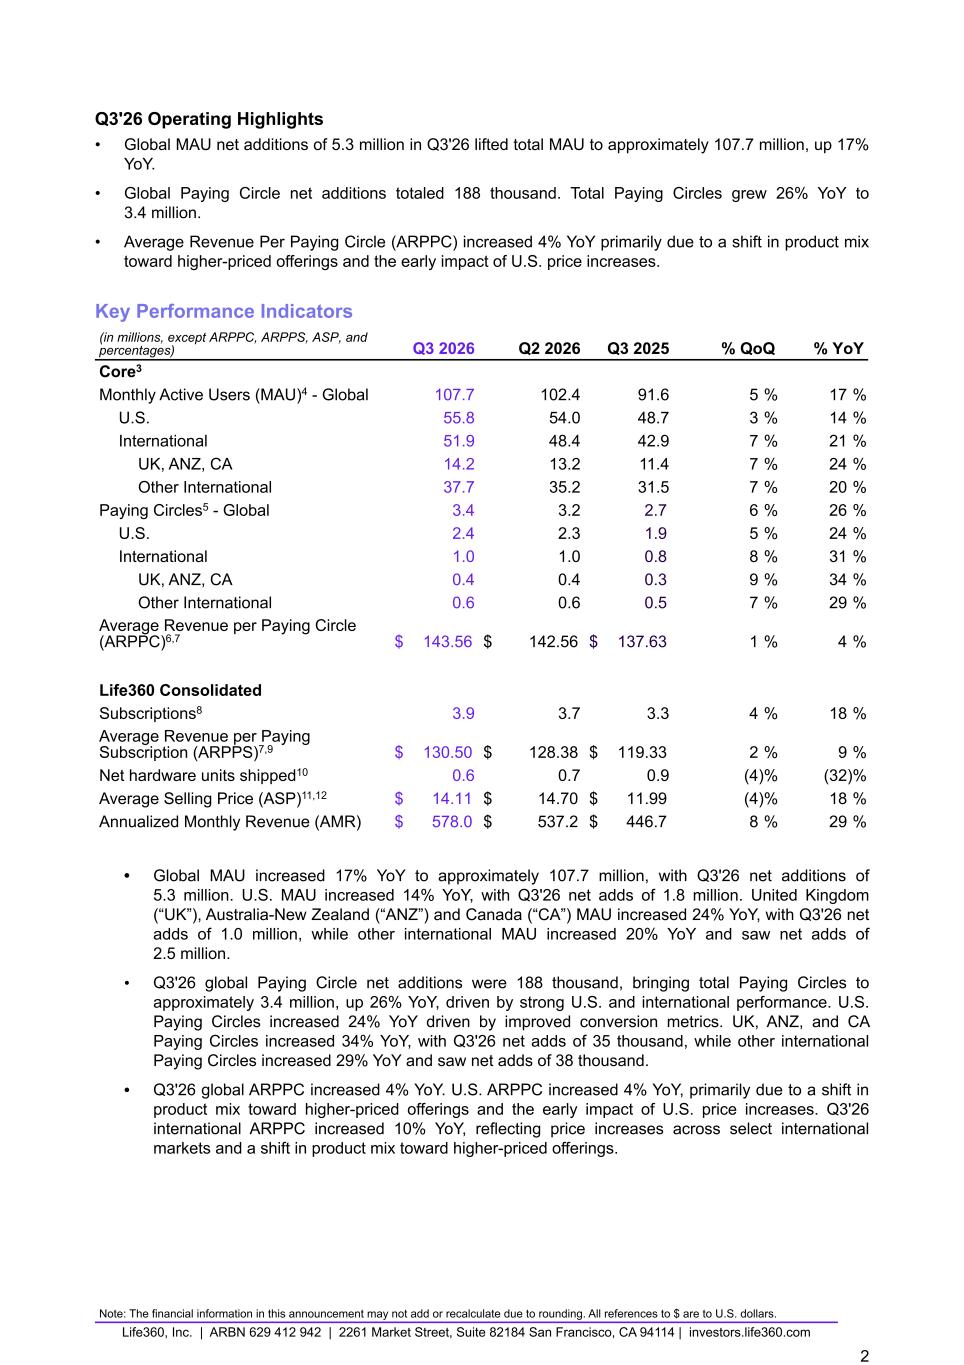
Q3'26 Operating Highlights • Global MAU net additions of 5.3 million in Q3'26 lifted total MAU to approximately 107.7 million, up 17% YoY. • Global Paying Circle net additions totaled 188 thousand. Total Paying Circles grew 26% YoY to 3.4 million. • Average Revenue Per Paying Circle (ARPPC) increased 4% YoY primarily due to a shift in product mix toward higher-priced offerings and the early impact of U.S. price increases. Key Performance Indicators (in millions, except ARPPC, ARPPS, ASP, and percentages) Q3 2026 Q2 2026 Q3 2025 % QoQ % YoY Core3 Monthly Active Users (MAU)4 - Global 107.7 102.4 91.6 5 % 17 % U.S. 55.8 54.0 48.7 3 % 14 % International 51.9 48.4 42.9 7 % 21 % UK, ANZ, CA 14.2 13.2 11.4 7 % 24 % Other International 37.7 35.2 31.5 7 % 20 % Paying Circles5 - Global 3.4 3.2 2.7 6 % 26 % U.S. 2.4 2.3 1.9 5 % 24 % International 1.0 1.0 0.8 8 % 31 % UK, ANZ, CA 0.4 0.4 0.3 9 % 34 % Other International 0.6 0.6 0.5 7 % 29 % Average Revenue per Paying Circle (ARPPC)6,7 $ 143.56 $ 142.56 $ 137.63 1 % 4 % Life360 Consolidated Subscriptions8 3.9 3.7 3.3 4 % 18 % Average Revenue per Paying Subscription (ARPPS)7,9 $ 130.50 $ 128.38 $ 119.33 2 % 9 % Net hardware units shipped10 0.6 0.7 0.9 (4) % (32) % Average Selling Price (ASP)11,12 $ 14.11 $ 14.70 $ 11.99 (4) % 18 % Annualized Monthly Revenue (AMR) $ 578.0 $ 537.2 $ 446.7 8 % 29 % • Global MAU increased 17% YoY to approximately 107.7 million, with Q3'26 net additions of 5.3 million. U.S. MAU increased 14% YoY, with Q3'26 net adds of 1.8 million. United Kingdom (“UK”), Australia-New Zealand (“ANZ”) and Canada (“CA”) MAU increased 24% YoY, with Q3'26 net adds of 1.0 million, while other international MAU increased 20% YoY and saw net adds of 2.5 million. • Q3'26 global Paying Circle net additions were 188 thousand, bringing total Paying Circles to approximately 3.4 million, up 26% YoY, driven by strong U.S. and international performance. U.S. Paying Circles increased 24% YoY driven by improved conversion metrics. UK, ANZ, and CA Paying Circles increased 34% YoY, with Q3'26 net adds of 35 thousand, while other international Paying Circles increased 29% YoY and saw net adds of 38 thousand. • Q3'26 global ARPPC increased 4% YoY. U.S. ARPPC increased 4% YoY, primarily due to a shift in product mix toward higher-priced offerings and the early impact of U.S. price increases. Q3'26 international ARPPC increased 10% YoY, reflecting price increases across select international markets and a shift in product mix toward higher-priced offerings. Note: The financial information in this announcement may not add or recalculate due to rounding. All references to $ are to U.S. dollars. Life360, Inc. | ARBN 629 412 942 | 2261 Market Street, Suite 82184 San Francisco, CA 94114 | investors.life360.com 2
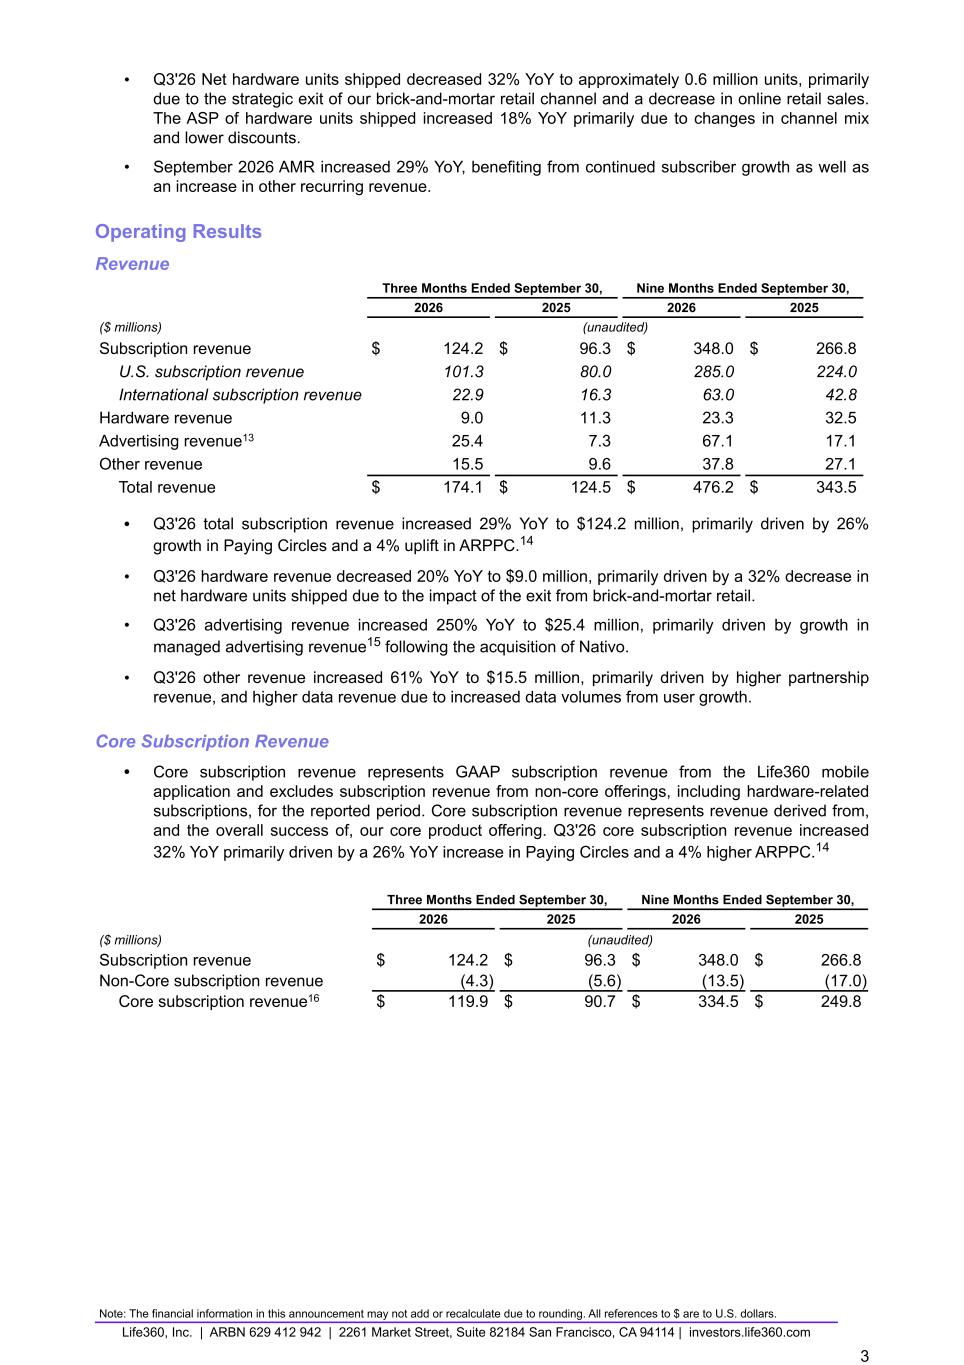
• Q3'26 Net hardware units shipped decreased 32% YoY to approximately 0.6 million units, primarily due to the strategic exit of our brick-and-mortar retail channel and a decrease in online retail sales. The ASP of hardware units shipped increased 18% YoY primarily due to changes in channel mix and lower discounts. • September 2026 AMR increased 29% YoY, benefiting from continued subscriber growth as well as an increase in other recurring revenue. Operating Results Revenue Three Months Ended September 30, Nine Months Ended September 30, 2026 2025 2026 2025 ($ millions) (unaudited) Subscription revenue $ 124.2 $ 96.3 $ 348.0 $ 266.8 U.S. subscription revenue 101.3 80.0 285.0 224.0 International subscription revenue 22.9 16.3 63.0 42.8 Hardware revenue 9.0 11.3 23.3 32.5 Advertising revenue13 25.4 7.3 67.1 17.1 Other revenue 15.5 9.6 37.8 27.1 Total revenue $ 174.1 $ 124.5 $ 476.2 $ 343.5 • Q3'26 total subscription revenue increased 29% YoY to $124.2 million, primarily driven by 26% growth in Paying Circles and a 4% uplift in ARPPC.14 • Q3'26 hardware revenue decreased 20% YoY to $9.0 million, primarily driven by a 32% decrease in net hardware units shipped due to the impact of the exit from brick-and-mortar retail. • Q3'26 advertising revenue increased 250% YoY to $25.4 million, primarily driven by growth in managed advertising revenue15 following the acquisition of Nativo. • Q3'26 other revenue increased 61% YoY to $15.5 million, primarily driven by higher partnership revenue, and higher data revenue due to increased data volumes from user growth. Core Subscription Revenue • Core subscription revenue represents GAAP subscription revenue from the Life360 mobile application and excludes subscription revenue from non-core offerings, including hardware-related subscriptions, for the reported period. Core subscription revenue represents revenue derived from, and the overall success of, our core product offering. Q3'26 core subscription revenue increased 32% YoY primarily driven by a 26% YoY increase in Paying Circles and a 4% higher ARPPC.14 Three Months Ended September 30, Nine Months Ended September 30, 2026 2025 2026 2025 ($ millions) (unaudited) Subscription revenue $ 124.2 $ 96.3 $ 348.0 $ 266.8 Non-Core subscription revenue (4.3) (5.6) (13.5) (17.0) Core subscription revenue16 $ 119.9 $ 90.7 $ 334.5 $ 249.8 Note: The financial information in this announcement may not add or recalculate due to rounding. All references to $ are to U.S. dollars. Life360, Inc. | ARBN 629 412 942 | 2261 Market Street, Suite 82184 San Francisco, CA 94114 | investors.life360.com 3
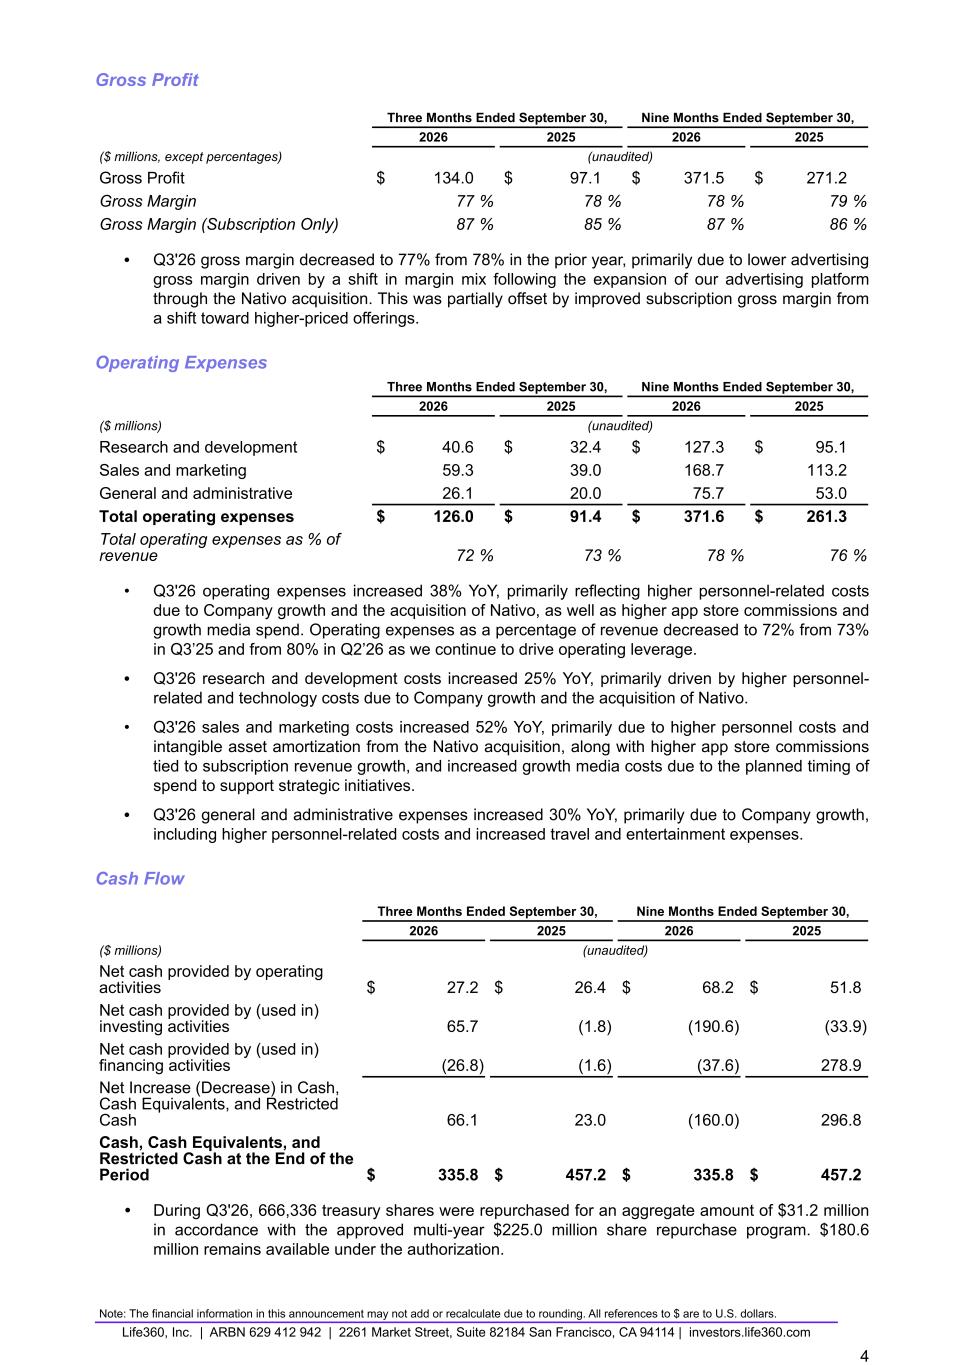
Gross Profit Three Months Ended September 30, Nine Months Ended September 30, 2026 2025 2026 2025 ($ millions, except percentages) (unaudited) Gross Profit $ 134.0 $ 97.1 $ 371.5 $ 271.2 Gross Margin 77 % 78 % 78 % 79 % Gross Margin (Subscription Only) 87 % 85 % 87 % 86 % • Q3'26 gross margin decreased to 77% from 78% in the prior year, primarily due to lower advertising gross margin driven by a shift in margin mix following the expansion of our advertising platform through the Nativo acquisition. This was partially offset by improved subscription gross margin from a shift toward higher-priced offerings. Operating Expenses Three Months Ended September 30, Nine Months Ended September 30, 2026 2025 2026 2025 ($ millions) (unaudited) Research and development $ 40.6 $ 32.4 $ 127.3 $ 95.1 Sales and marketing 59.3 39.0 168.7 113.2 General and administrative 26.1 20.0 75.7 53.0 Total operating expenses $ 126.0 $ 91.4 $ 371.6 $ 261.3 Total operating expenses as % of revenue 72 % 73 % 78 % 76 % • Q3'26 operating expenses increased 38% YoY, primarily reflecting higher personnel-related costs due to Company growth and the acquisition of Nativo, as well as higher app store commissions and growth media spend. Operating expenses as a percentage of revenue decreased to 72% from 73% in Q3’25 and from 80% in Q2’26 as we continue to drive operating leverage. • Q3'26 research and development costs increased 25% YoY, primarily driven by higher personnel- related and technology costs due to Company growth and the acquisition of Nativo. • Q3'26 sales and marketing costs increased 52% YoY, primarily due to higher personnel costs and intangible asset amortization from the Nativo acquisition, along with higher app store commissions tied to subscription revenue growth, and increased growth media costs due to the planned timing of spend to support strategic initiatives. • Q3'26 general and administrative expenses increased 30% YoY, primarily due to Company growth, including higher personnel-related costs and increased travel and entertainment expenses. Cash Flow Three Months Ended September 30, Nine Months Ended September 30, 2026 2025 2026 2025 ($ millions) (unaudited) Net cash provided by operating activities $ 27.2 $ 26.4 $ 68.2 $ 51.8 Net cash provided by (used in) investing activities 65.7 (1.8) (190.6) (33.9) Net cash provided by (used in) financing activities (26.8) (1.6) (37.6) 278.9 Net Increase (Decrease) in Cash, Cash Equivalents, and Restricted Cash 66.1 23.0 (160.0) 296.8 Cash, Cash Equivalents, and Restricted Cash at the End of the Period $ 335.8 $ 457.2 $ 335.8 $ 457.2 • During Q3'26, 666,336 treasury shares were repurchased for an aggregate amount of $31.2 million in accordance with the approved multi-year $225.0 million share repurchase program. $180.6 million remains available under the authorization. Note: The financial information in this announcement may not add or recalculate due to rounding. All references to $ are to U.S. dollars. Life360, Inc. | ARBN 629 412 942 | 2261 Market Street, Suite 82184 San Francisco, CA 94114 | investors.life360.com 4
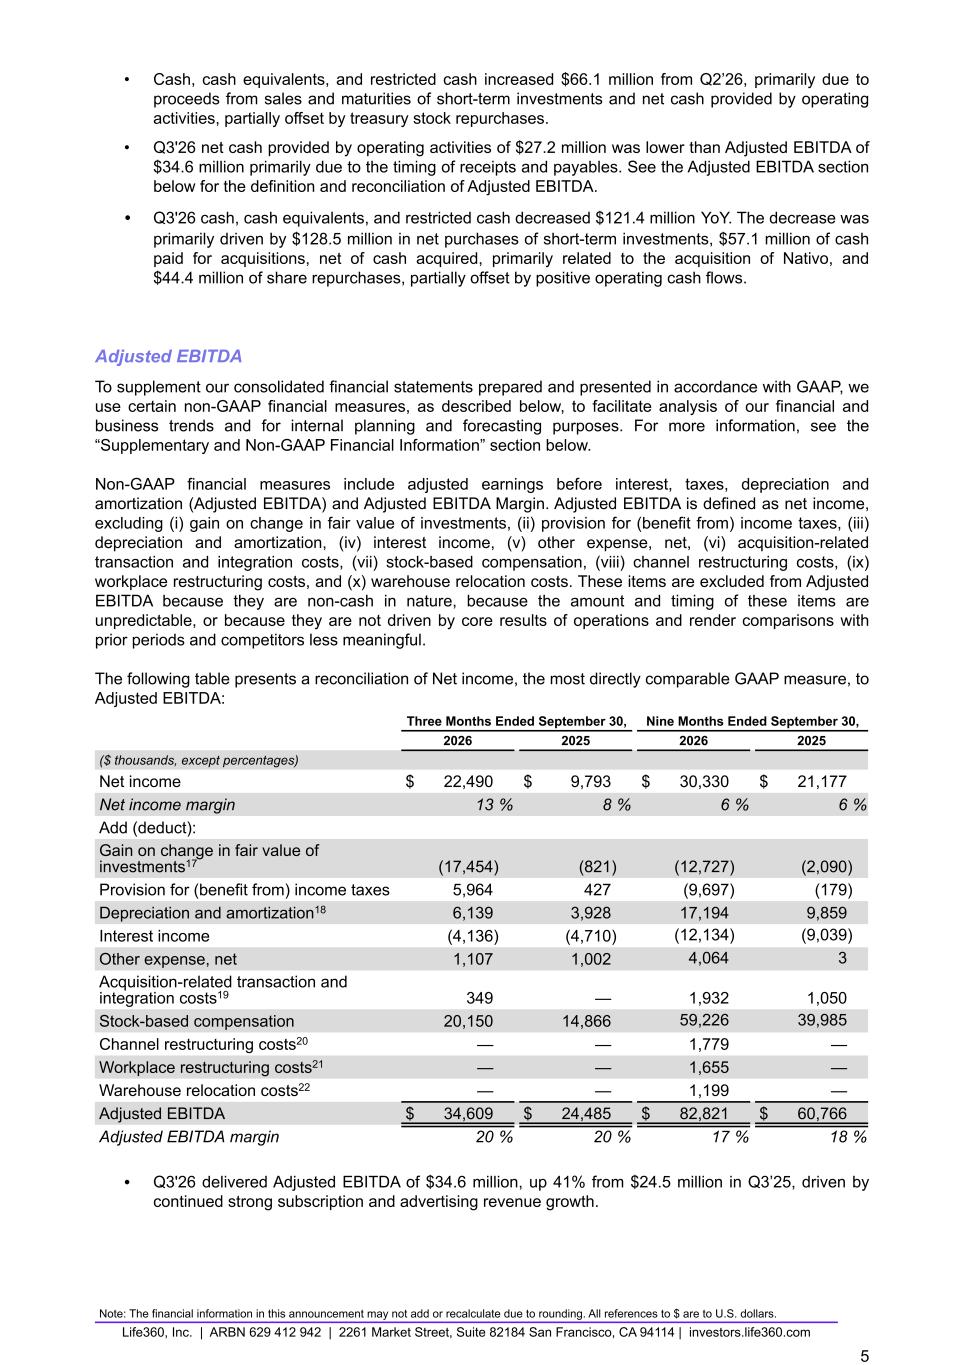
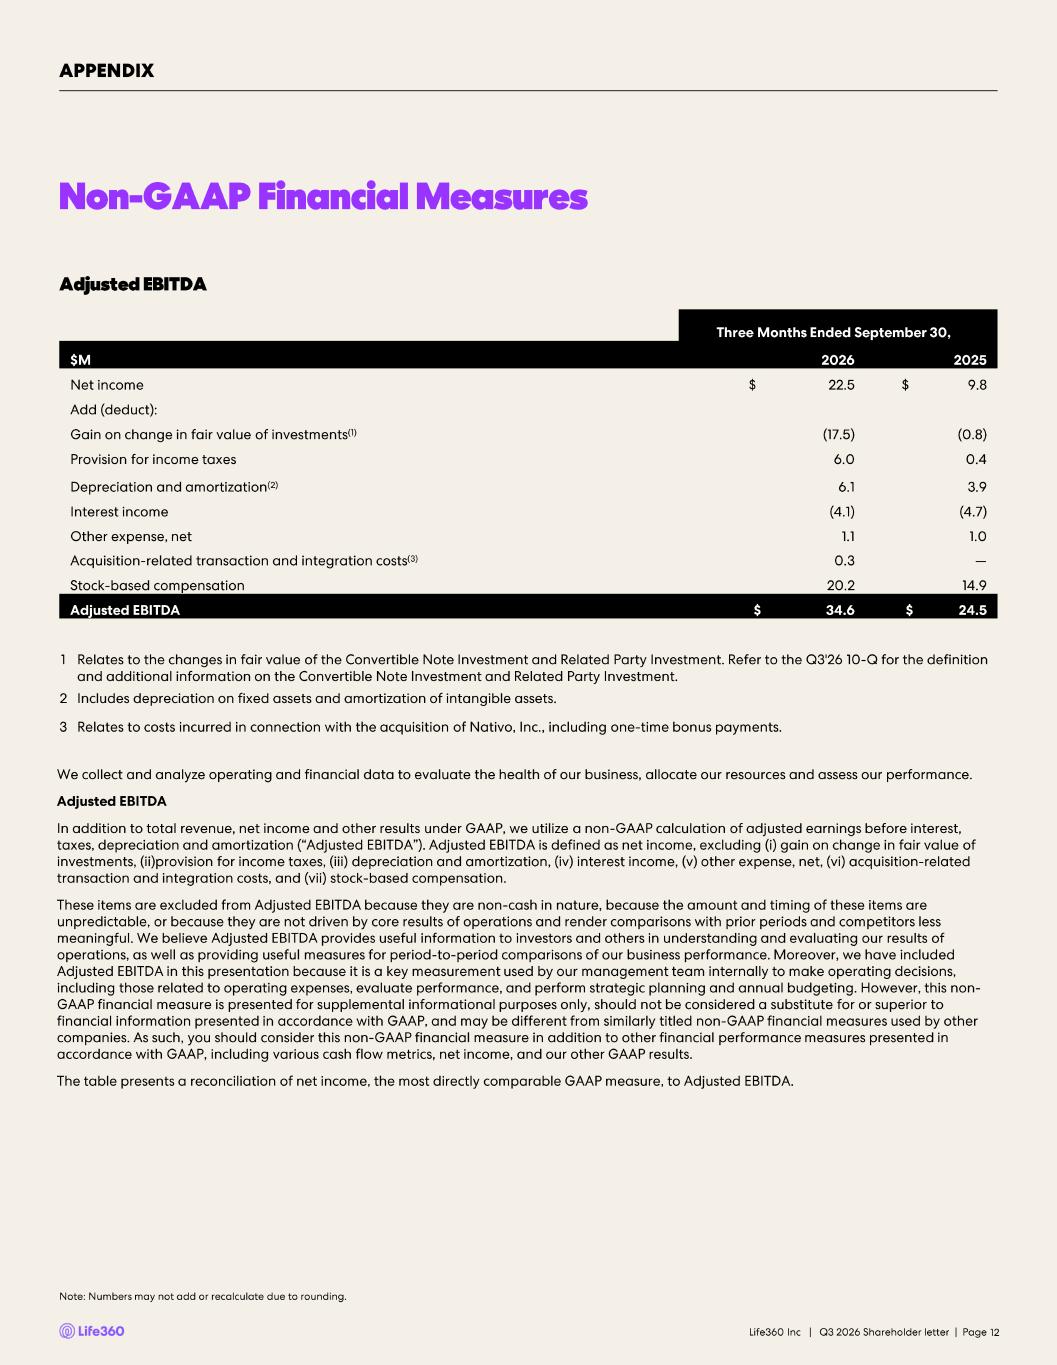
• Cash, cash equivalents, and restricted cash increased $66.1 million from Q2’26, primarily due to proceeds from sales and maturities of short-term investments and net cash provided by operating activities, partially offset by treasury stock repurchases. • Q3'26 net cash provided by operating activities of $27.2 million was lower than Adjusted EBITDA of $34.6 million primarily due to the timing of receipts and payables. See the Adjusted EBITDA section below for the definition and reconciliation of Adjusted EBITDA. • Q3'26 cash, cash equivalents, and restricted cash decreased $121.4 million YoY. The decrease was primarily driven by $128.5 million in net purchases of short-term investments, $57.1 million of cash paid for acquisitions, net of cash acquired, primarily related to the acquisition of Nativo, and $44.4 million of share repurchases, partially offset by positive operating cash flows. Adjusted EBITDA To supplement our consolidated financial statements prepared and presented in accordance with GAAP, we use certain non-GAAP financial measures, as described below, to facilitate analysis of our financial and business trends and for internal planning and forecasting purposes. For more information, see the “Supplementary and Non-GAAP Financial Information” section below. Non-GAAP financial measures include adjusted earnings before interest, taxes, depreciation and amortization (Adjusted EBITDA) and Adjusted EBITDA Margin. Adjusted EBITDA is defined as net income, excluding (i) gain on change in fair value of investments, (ii) provision for (benefit from) income taxes, (iii) depreciation and amortization, (iv) interest income, (v) other expense, net, (vi) acquisition-related transaction and integration costs, (vii) stock-based compensation, (viii) channel restructuring costs, (ix) workplace restructuring costs, and (x) warehouse relocation costs. These items are excluded from Adjusted EBITDA because they are non-cash in nature, because the amount and timing of these items are unpredictable, or because they are not driven by core results of operations and render comparisons with prior periods and competitors less meaningful. The following table presents a reconciliation of Net income, the most directly comparable GAAP measure, to Adjusted EBITDA: Three Months Ended September 30, Nine Months Ended September 30, 2026 2025 2026 2025 ($ thousands, except percentages) Net income $ 22,490 $ 9,793 $ 30,330 $ 21,177 Net income margin 13 % 8 % 6 % 6 % Add (deduct): Gain on change in fair value of investments17 (17,454) (821) (12,727) (2,090) Provision for (benefit from) income taxes 5,964 427 (9,697) (179) Depreciation and amortization18 6,139 3,928 17,194 9,859 Interest income (4,136) (4,710) (12,134) (9,039) Other expense, net 1,107 1,002 4,064 3 Acquisition-related transaction and integration costs19 349 — 1,932 1,050 Stock-based compensation 20,150 14,866 59,226 39,985 Channel restructuring costs20 — — 1,779 — Workplace restructuring costs21 — — 1,655 — Warehouse relocation costs22 — — 1,199 — Adjusted EBITDA $ 34,609 $ 24,485 $ 82,821 $ 60,766 Adjusted EBITDA margin 20 % 20 % 17 % 18 % • Q3'26 delivered Adjusted EBITDA of $34.6 million, up 41% from $24.5 million in Q3’25, driven by continued strong subscription and advertising revenue growth. Note: The financial information in this announcement may not add or recalculate due to rounding. All references to $ are to U.S. dollars. Life360, Inc. | ARBN 629 412 942 | 2261 Market Street, Suite 82184 San Francisco, CA 94114 | investors.life360.com 5
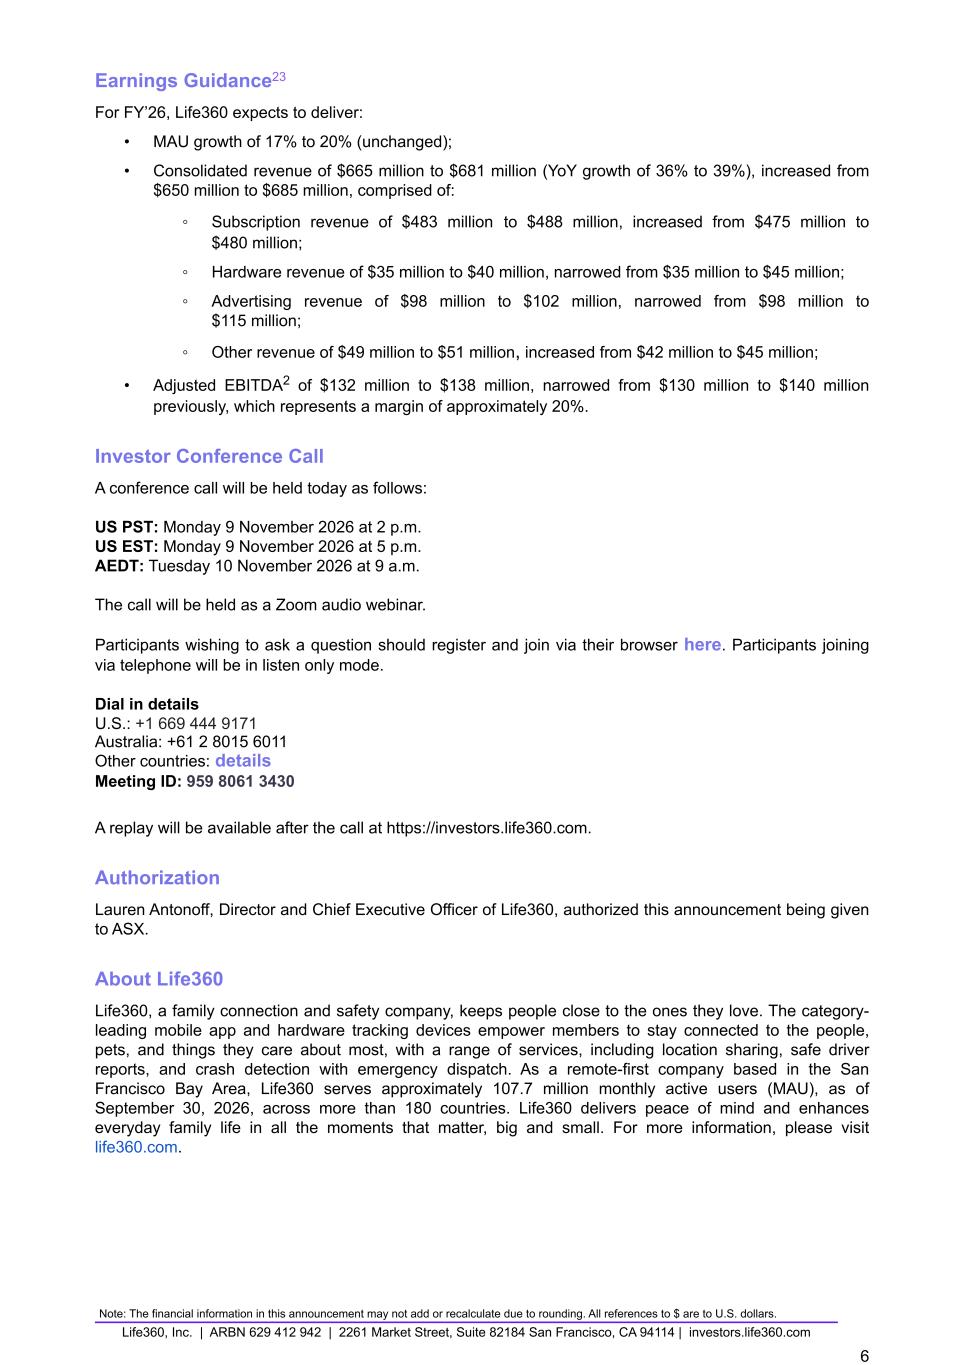
Earnings Guidance23 For FY’26, Life360 expects to deliver: • MAU growth of 17% to 20% (unchanged); • Consolidated revenue of $665 million to $681 million (YoY growth of 36% to 39%), increased from $650 million to $685 million, comprised of: ◦ Subscription revenue of $483 million to $488 million, increased from $475 million to $480 million; ◦ Hardware revenue of $35 million to $40 million, narrowed from $35 million to $45 million; ◦ Advertising revenue of $98 million to $102 million, narrowed from $98 million to $115 million; ◦ Other revenue of $49 million to $51 million, increased from $42 million to $45 million; • Adjusted EBITDA2 of $132 million to $138 million, narrowed from $130 million to $140 million previously, which represents a margin of approximately 20%. Investor Conference Call A conference call will be held today as follows: US PST: Monday 9 November 2026 at 2 p.m. US EST: Monday 9 November 2026 at 5 p.m. AEDT: Tuesday 10 November 2026 at 9 a.m. The call will be held as a Zoom audio webinar. Participants wishing to ask a question should register and join via their browser here. Participants joining via telephone will be in listen only mode. Dial in details U.S.: +1 669 444 9171 Australia: +61 2 8015 6011 Other countries: details Meeting ID: 959 8061 3430 A replay will be available after the call at https://investors.life360.com. Authorization Lauren Antonoff, Director and Chief Executive Officer of Life360, authorized this announcement being given to ASX. About Life360 Life360, a family connection and safety company, keeps people close to the ones they love. The category- leading mobile app and hardware tracking devices empower members to stay connected to the people, pets, and things they care about most, with a range of services, including location sharing, safe driver reports, and crash detection with emergency dispatch. As a remote-first company based in the San Francisco Bay Area, Life360 serves approximately 107.7 million monthly active users (MAU), as of September 30, 2026, across more than 180 countries. Life360 delivers peace of mind and enhances everyday family life in all the moments that matter, big and small. For more information, please visit life360.com. Note: The financial information in this announcement may not add or recalculate due to rounding. All references to $ are to U.S. dollars. Life360, Inc. | ARBN 629 412 942 | 2261 Market Street, Suite 82184 San Francisco, CA 94114 | investors.life360.com 6
Contacts For U.S. investor inquiries: For U.S. media inquiries: investors@life360.com Lynnette Bruno press@life360.com For Australian investor inquiries: For Australian media inquiries: Jolanta Masojada, +61 417 261 367 Giles Rafferty, +61 481 467 903 jmasojada@life360.com grafferty@firstadvisers.com.au Forward-looking statements This announcement and the accompanying presentation, shareholder letter and conference call contain forward-looking statements within the meaning of the Private Securities Litigation Reform Act of 1995. Life360 intends such forward-looking statements to be covered by the safe harbor provisions for forward-looking statements contained in Section 21E of the Securities Exchange Act of 1934, as amended. These forward-looking statements are based on management’s beliefs and assumptions and on information currently available to management, and include statements regarding among other things, Life360’s intentions, objectives, plans, expectations, assumptions and beliefs about future events, including Life360’s expectations with respect to the financial and operating performance of its business, including subscription revenue, hardware revenue, other revenue and consolidated revenue, ability to create new revenue streams, and margin expansion; the resiliency of Life360’s core subscription business; the ability of Life360 to adapt to and mitigate the impact of macroeconomic considerations including tariffs and trade barriers; its ability to deliver contextually relevant advertisements that enhance the user experience by leveraging its extensive first-party location data; Adjusted EBITDA, and operating cash flow; expectations regarding MAU and other member metrics; its capital position; future growth and market opportunities; plans to launch new features and products; the impact of pricing changes and product offering expansion in the U.S., UK, Australia, and New Zealand on future results of operations; its expectations of growth in its data business; its expectation of enhanced location capabilities of its hardware devices; the timing of new devices, and the potential for the next generation of hardware to drive a new wave of subscription growth; its share repurchases and the expected offset of dilution; its ability to successfully integrate and realize the anticipated benefits of its recent acquisitions; its AI-enabled “family intelligence” capabilities and assistant integrations; its advertising outlook including commentary regarding 2027; its partnership with Hubble; the outcome of pending litigation and arbitration proceedings; as well as Life360’s expectations of any changes to the information disclosed herein. The words “anticipate”, “believe”, “expect”, “project”, “predict”, “will”, “forecast”, “estimate”, “likely”, “intend”, “outlook”, “should”, “could”, “may”, “target”, “plan” and other similar expressions can generally be used to identify forward-looking statements. We caution you that the foregoing list may not contain all of the forward-looking statements made in this announcement, the accompanying presentation, shareholder letter or conference call. Investors and prospective investors are cautioned not to place undue reliance on these forward-looking statements as they involve inherent risk and uncertainty (both general and specific) and should note that they are provided as a general guide only and should not be relied on as an indication or guarantee of future performance. Subject to any continuing obligations under applicable law, Life360 does not undertake any obligation to publicly release the result of any revisions to these forward-looking statements to reflect events or circumstances after the date of this announcement, to reflect any change in expectations in relation to any forward-looking statements or any change in events, conditions or circumstances on which any such statements are based. Although Life360 believes that the expectations reflected in the forward-looking statements and the assumptions upon which they are based are reasonable, Life360 can give no assurance that such expectations and assumptions will prove to be correct and, actual results may vary in a materially positive or negative manner. The forward-looking statements are not historical facts, but rather are based on current expectations, estimates, assumptions and projections about Life360’s industry, business and future financial results. Forward-looking statements are subject to known and unknown risks, uncertainty, assumptions and contingencies, many of which are outside Life360’s control, and are based on estimates and assumptions that are subject to change and may cause actual results, performance or achievements to differ materially from those expressed or implied by such statements. Factors that could cause actual results to differ materially from those in the forward-looking statements include risks related to the preliminary nature of financial results, risks related to Life360’s business, market risks, Life360’s need for additional capital, and the risk that Life360’s products and services may not perform as expected, as described in greater detail under the heading “Risk Factors” in Life360’s most recent Quarterly Report on Form 10-Q and Annual Report on Form 10-K for the year ended December 31, 2025, each filed with the SEC and lodged with the ASX, as such risks may be updated in subsequent filings. To the maximum extent permitted by law, responsibility for the accuracy or completeness of any forward-looking statements whether as a result of new information, future events or results or otherwise is disclaimed. This announcement should not be relied upon as a recommendation or forecast by Life360. Past performance information in this document is given for illustrative purposes only and is not necessarily a guide to future performance and no representation or warranty is made by any person as to the likelihood of achievement or reasonableness of any forward-looking statements, forecast financial information, future share price performance or any underlying assumptions. Note: The financial information in this announcement may not add or recalculate due to rounding. All references to $ are to U.S. dollars. Life360, Inc. | ARBN 629 412 942 | 2261 Market Street, Suite 82184 San Francisco, CA 94114 | investors.life360.com 7
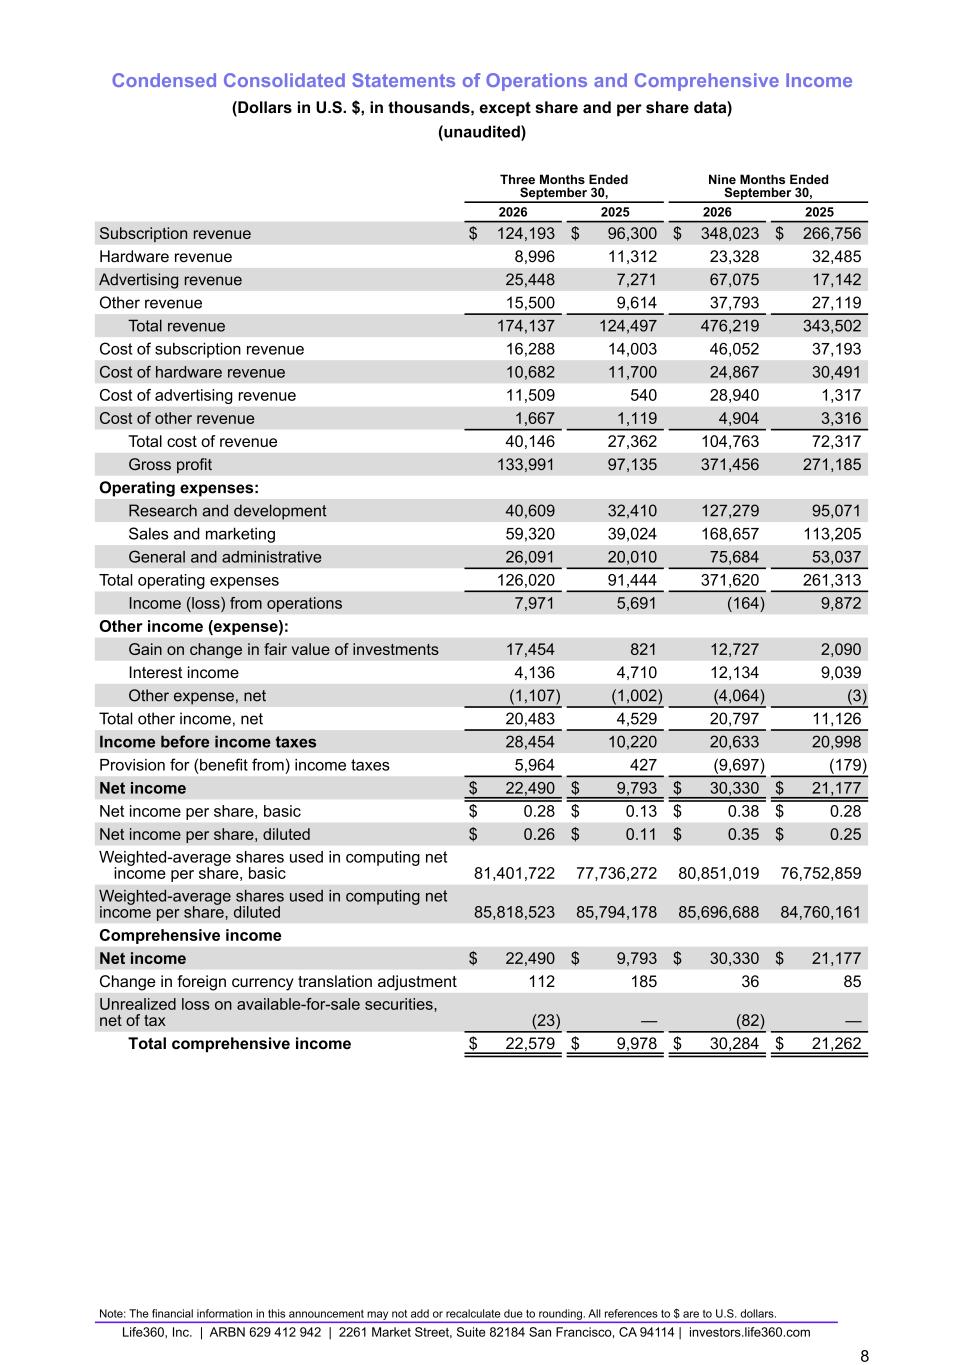
Condensed Consolidated Statements of Operations and Comprehensive Income (Dollars in U.S. $, in thousands, except share and per share data) (unaudited) Three Months Ended September 30, Nine Months Ended September 30, 2026 2025 2026 2025 Subscription revenue $ 124,193 $ 96,300 $ 348,023 $ 266,756 Hardware revenue 8,996 11,312 23,328 32,485 Advertising revenue 25,448 7,271 67,075 17,142 Other revenue 15,500 9,614 37,793 27,119 Total revenue 174,137 124,497 476,219 343,502 Cost of subscription revenue 16,288 14,003 46,052 37,193 Cost of hardware revenue 10,682 11,700 24,867 30,491 Cost of advertising revenue 11,509 540 28,940 1,317 Cost of other revenue 1,667 1,119 4,904 3,316 Total cost of revenue 40,146 27,362 104,763 72,317 Gross profit 133,991 97,135 371,456 271,185 Operating expenses: Research and development 40,609 32,410 127,279 95,071 Sales and marketing 59,320 39,024 168,657 113,205 General and administrative 26,091 20,010 75,684 53,037 Total operating expenses 126,020 91,444 371,620 261,313 Income (loss) from operations 7,971 5,691 (164) 9,872 Other income (expense): Gain on change in fair value of investments 17,454 821 12,727 2,090 Interest income 4,136 4,710 12,134 9,039 Other expense, net (1,107) (1,002) (4,064) (3) Total other income, net 20,483 4,529 20,797 11,126 Income before income taxes 28,454 10,220 20,633 20,998 Provision for (benefit from) income taxes 5,964 427 (9,697) (179) Net income $ 22,490 $ 9,793 $ 30,330 $ 21,177 Net income per share, basic $ 0.28 $ 0.13 $ 0.38 $ 0.28 Net income per share, diluted $ 0.26 $ 0.11 $ 0.35 $ 0.25 Weighted-average shares used in computing net income per share, basic 81,401,722 77,736,272 80,851,019 76,752,859 Weighted-average shares used in computing net income per share, diluted 85,818,523 85,794,178 85,696,688 84,760,161 Comprehensive income Net income $ 22,490 $ 9,793 $ 30,330 $ 21,177 Change in foreign currency translation adjustment 112 185 36 85 Unrealized loss on available-for-sale securities, net of tax (23) — (82) — Total comprehensive income $ 22,579 $ 9,978 $ 30,284 $ 21,262 Note: The financial information in this announcement may not add or recalculate due to rounding. All references to $ are to U.S. dollars. Life360, Inc. | ARBN 629 412 942 | 2261 Market Street, Suite 82184 San Francisco, CA 94114 | investors.life360.com 8
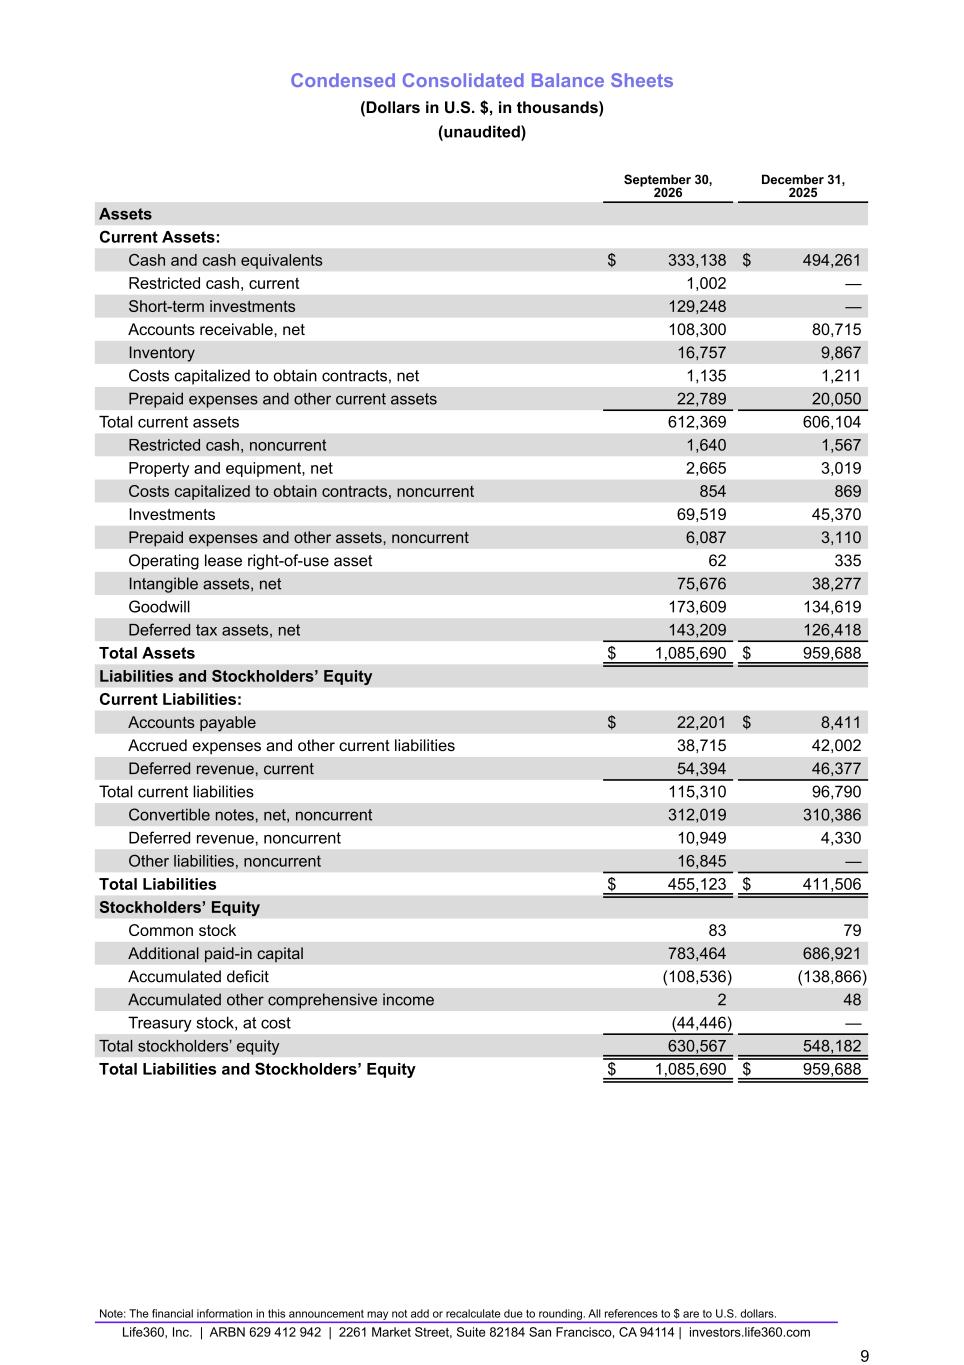
Condensed Consolidated Balance Sheets (Dollars in U.S. $, in thousands) (unaudited) September 30, 2026 December 31, 2025 Assets Current Assets: Cash and cash equivalents $ 333,138 $ 494,261 Restricted cash, current 1,002 — Short-term investments 129,248 — Accounts receivable, net 108,300 80,715 Inventory 16,757 9,867 Costs capitalized to obtain contracts, net 1,135 1,211 Prepaid expenses and other current assets 22,789 20,050 Total current assets 612,369 606,104 Restricted cash, noncurrent 1,640 1,567 Property and equipment, net 2,665 3,019 Costs capitalized to obtain contracts, noncurrent 854 869 Investments 69,519 45,370 Prepaid expenses and other assets, noncurrent 6,087 3,110 Operating lease right-of-use asset 62 335 Intangible assets, net 75,676 38,277 Goodwill 173,609 134,619 Deferred tax assets, net 143,209 126,418 Total Assets $ 1,085,690 $ 959,688 Liabilities and Stockholders’ Equity Current Liabilities: Accounts payable $ 22,201 $ 8,411 Accrued expenses and other current liabilities 38,715 42,002 Deferred revenue, current 54,394 46,377 Total current liabilities 115,310 96,790 Convertible notes, net, noncurrent 312,019 310,386 Deferred revenue, noncurrent 10,949 4,330 Other liabilities, noncurrent 16,845 — Total Liabilities $ 455,123 $ 411,506 Stockholders’ Equity Common stock 83 79 Additional paid-in capital 783,464 686,921 Accumulated deficit (108,536) (138,866) Accumulated other comprehensive income 2 48 Treasury stock, at cost (44,446) — Total stockholders’ equity 630,567 548,182 Total Liabilities and Stockholders’ Equity $ 1,085,690 $ 959,688 Note: The financial information in this announcement may not add or recalculate due to rounding. All references to $ are to U.S. dollars. Life360, Inc. | ARBN 629 412 942 | 2261 Market Street, Suite 82184 San Francisco, CA 94114 | investors.life360.com 9
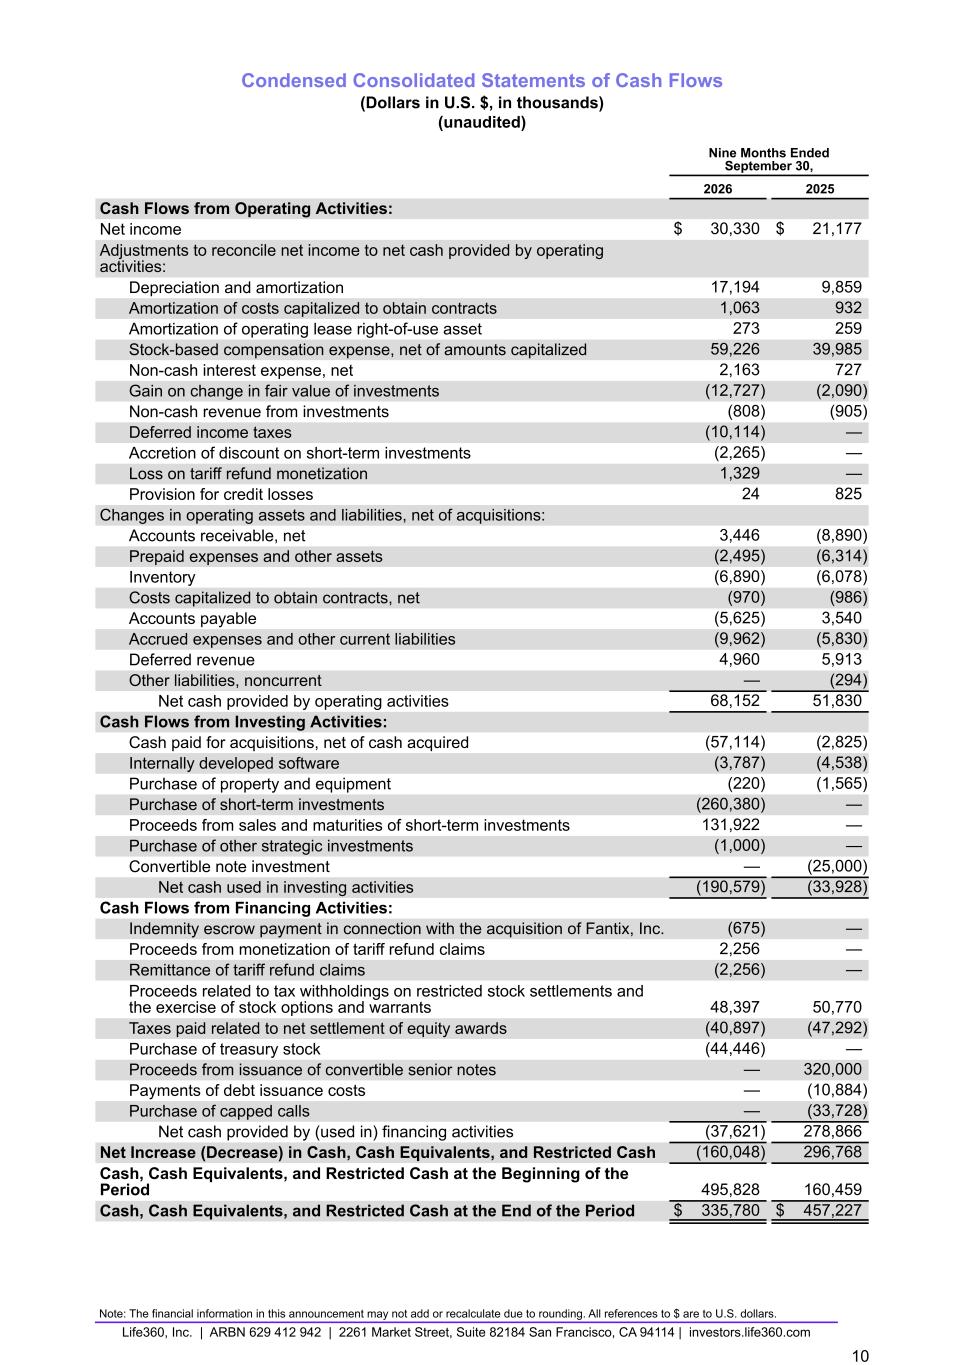
Condensed Consolidated Statements of Cash Flows (Dollars in U.S. $, in thousands) (unaudited) Nine Months Ended September 30, 2026 2025 Cash Flows from Operating Activities: Net income $ 30,330 $ 21,177 Adjustments to reconcile net income to net cash provided by operating activities: Depreciation and amortization 17,194 9,859 Amortization of costs capitalized to obtain contracts 1,063 932 Amortization of operating lease right-of-use asset 273 259 Stock-based compensation expense, net of amounts capitalized 59,226 39,985 Non-cash interest expense, net 2,163 727 Gain on change in fair value of investments (12,727) (2,090) Non-cash revenue from investments (808) (905) Deferred income taxes (10,114) — Accretion of discount on short-term investments (2,265) — Loss on tariff refund monetization 1,329 — Provision for credit losses 24 825 Changes in operating assets and liabilities, net of acquisitions: Accounts receivable, net 3,446 (8,890) Prepaid expenses and other assets (2,495) (6,314) Inventory (6,890) (6,078) Costs capitalized to obtain contracts, net (970) (986) Accounts payable (5,625) 3,540 Accrued expenses and other current liabilities (9,962) (5,830) Deferred revenue 4,960 5,913 Other liabilities, noncurrent — (294) Net cash provided by operating activities 68,152 51,830 Cash Flows from Investing Activities: Cash paid for acquisitions, net of cash acquired (57,114) (2,825) Internally developed software (3,787) (4,538) Purchase of property and equipment (220) (1,565) Purchase of short-term investments (260,380) — Proceeds from sales and maturities of short-term investments 131,922 — Purchase of other strategic investments (1,000) — Convertible note investment — (25,000) Net cash used in investing activities (190,579) (33,928) Cash Flows from Financing Activities: Indemnity escrow payment in connection with the acquisition of Fantix, Inc. (675) — Proceeds from monetization of tariff refund claims 2,256 — Remittance of tariff refund claims (2,256) — Proceeds related to tax withholdings on restricted stock settlements and the exercise of stock options and warrants 48,397 50,770 Taxes paid related to net settlement of equity awards (40,897) (47,292) Purchase of treasury stock (44,446) — Proceeds from issuance of convertible senior notes — 320,000 Payments of debt issuance costs — (10,884) Purchase of capped calls — (33,728) Net cash provided by (used in) financing activities (37,621) 278,866 Net Increase (Decrease) in Cash, Cash Equivalents, and Restricted Cash (160,048) 296,768 Cash, Cash Equivalents, and Restricted Cash at the Beginning of the Period 495,828 160,459 Cash, Cash Equivalents, and Restricted Cash at the End of the Period $ 335,780 $ 457,227 Note: The financial information in this announcement may not add or recalculate due to rounding. All references to $ are to U.S. dollars. Life360, Inc. | ARBN 629 412 942 | 2261 Market Street, Suite 82184 San Francisco, CA 94114 | investors.life360.com 10
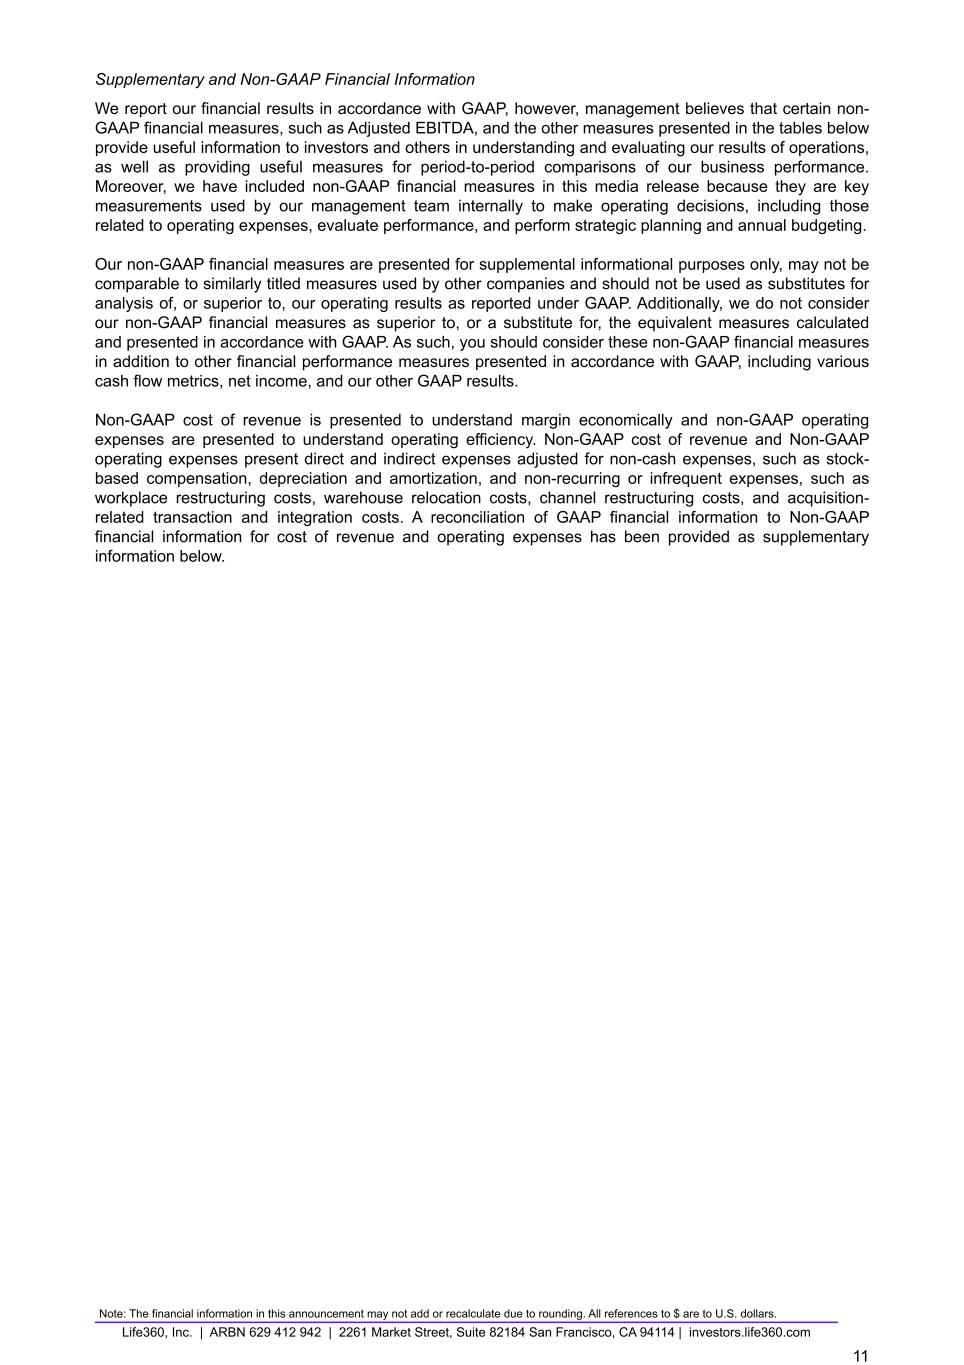
Supplementary and Non-GAAP Financial Information We report our financial results in accordance with GAAP, however, management believes that certain non- GAAP financial measures, such as Adjusted EBITDA, and the other measures presented in the tables below provide useful information to investors and others in understanding and evaluating our results of operations, as well as providing useful measures for period-to-period comparisons of our business performance. Moreover, we have included non-GAAP financial measures in this media release because they are key measurements used by our management team internally to make operating decisions, including those related to operating expenses, evaluate performance, and perform strategic planning and annual budgeting. Our non-GAAP financial measures are presented for supplemental informational purposes only, may not be comparable to similarly titled measures used by other companies and should not be used as substitutes for analysis of, or superior to, our operating results as reported under GAAP. Additionally, we do not consider our non-GAAP financial measures as superior to, or a substitute for, the equivalent measures calculated and presented in accordance with GAAP. As such, you should consider these non-GAAP financial measures in addition to other financial performance measures presented in accordance with GAAP, including various cash flow metrics, net income, and our other GAAP results. Non-GAAP cost of revenue is presented to understand margin economically and non-GAAP operating expenses are presented to understand operating efficiency. Non-GAAP cost of revenue and Non-GAAP operating expenses present direct and indirect expenses adjusted for non-cash expenses, such as stock- based compensation, depreciation and amortization, and non-recurring or infrequent expenses, such as workplace restructuring costs, warehouse relocation costs, channel restructuring costs, and acquisition- related transaction and integration costs. A reconciliation of GAAP financial information to Non-GAAP financial information for cost of revenue and operating expenses has been provided as supplementary information below. Note: The financial information in this announcement may not add or recalculate due to rounding. All references to $ are to U.S. dollars. Life360, Inc. | ARBN 629 412 942 | 2261 Market Street, Suite 82184 San Francisco, CA 94114 | investors.life360.com 11
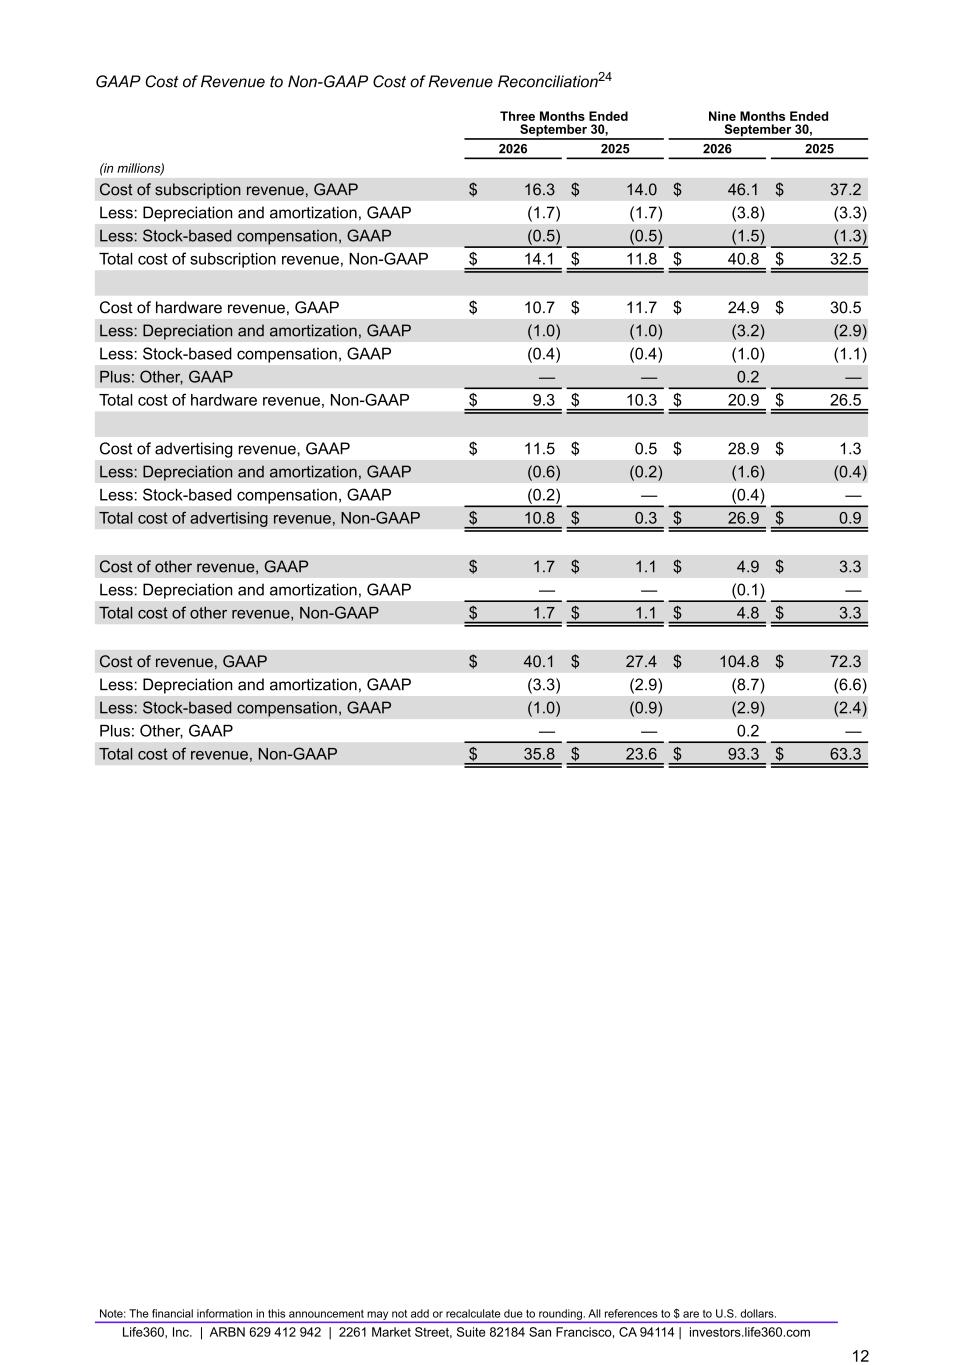
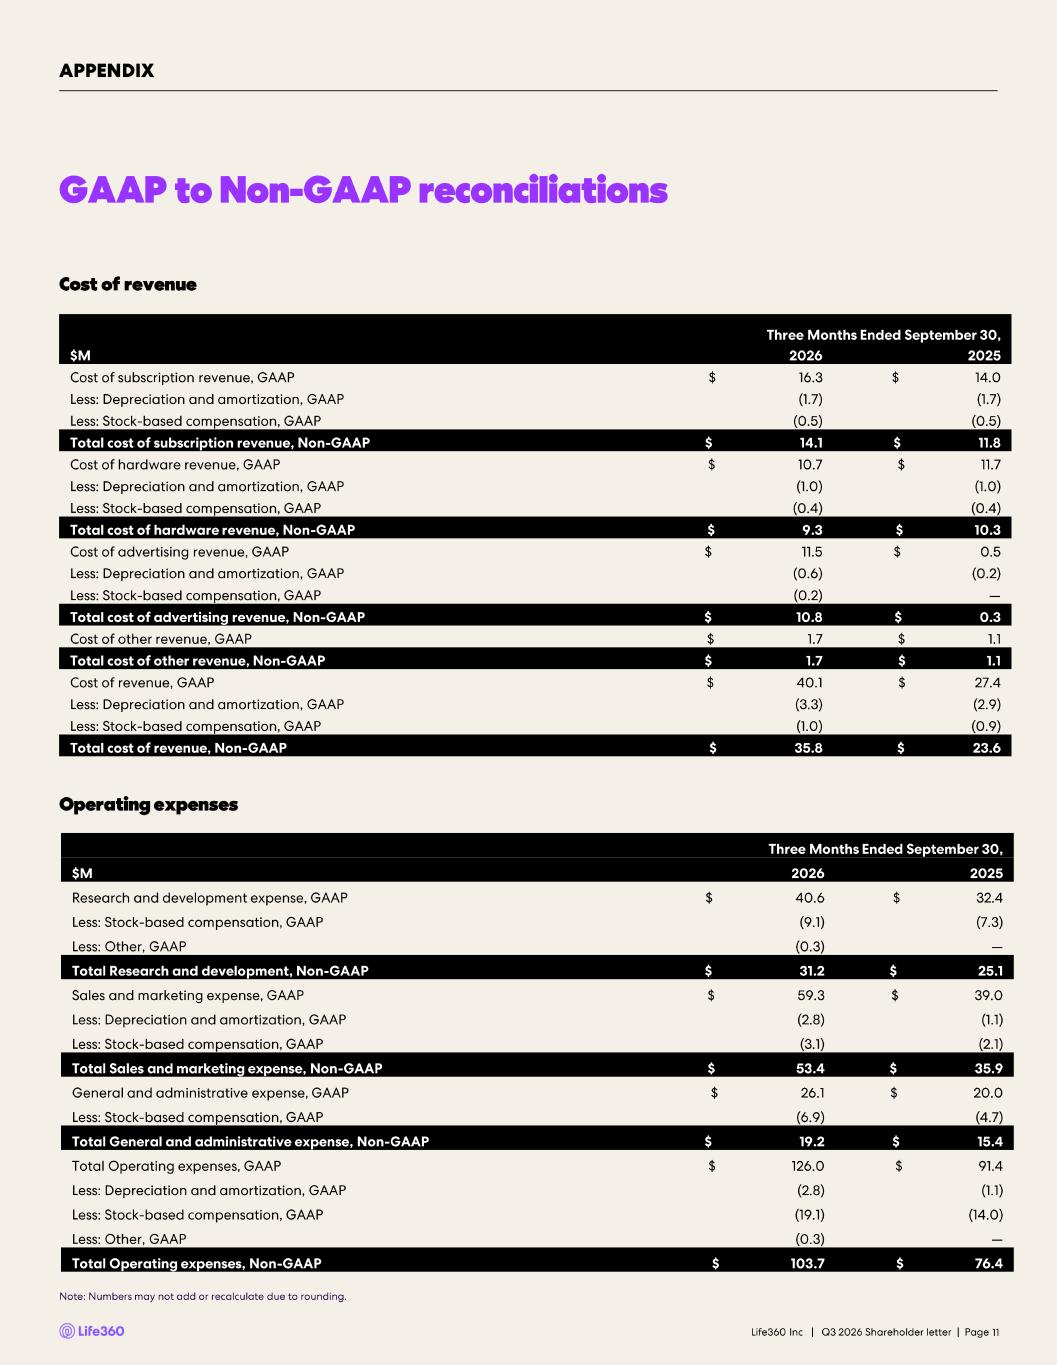
GAAP Cost of Revenue to Non-GAAP Cost of Revenue Reconciliation24 Three Months Ended September 30, Nine Months Ended September 30, 2026 2025 2026 2025 (in millions) Cost of subscription revenue, GAAP $ 16.3 $ 14.0 $ 46.1 $ 37.2 Less: Depreciation and amortization, GAAP (1.7) (1.7) (3.8) (3.3) Less: Stock-based compensation, GAAP (0.5) (0.5) (1.5) (1.3) Total cost of subscription revenue, Non-GAAP $ 14.1 $ 11.8 $ 40.8 $ 32.5 Cost of hardware revenue, GAAP $ 10.7 $ 11.7 $ 24.9 $ 30.5 Less: Depreciation and amortization, GAAP (1.0) (1.0) (3.2) (2.9) Less: Stock-based compensation, GAAP (0.4) (0.4) (1.0) (1.1) Plus: Other, GAAP — — 0.2 — Total cost of hardware revenue, Non-GAAP $ 9.3 $ 10.3 $ 20.9 $ 26.5 Cost of advertising revenue, GAAP $ 11.5 $ 0.5 $ 28.9 $ 1.3 Less: Depreciation and amortization, GAAP (0.6) (0.2) (1.6) (0.4) Less: Stock-based compensation, GAAP (0.2) — (0.4) — Total cost of advertising revenue, Non-GAAP $ 10.8 $ 0.3 $ 26.9 $ 0.9 Cost of other revenue, GAAP $ 1.7 $ 1.1 $ 4.9 $ 3.3 Less: Depreciation and amortization, GAAP — — (0.1) — Total cost of other revenue, Non-GAAP $ 1.7 $ 1.1 $ 4.8 $ 3.3 Cost of revenue, GAAP $ 40.1 $ 27.4 $ 104.8 $ 72.3 Less: Depreciation and amortization, GAAP (3.3) (2.9) (8.7) (6.6) Less: Stock-based compensation, GAAP (1.0) (0.9) (2.9) (2.4) Plus: Other, GAAP — — 0.2 — Total cost of revenue, Non-GAAP $ 35.8 $ 23.6 $ 93.3 $ 63.3 Note: The financial information in this announcement may not add or recalculate due to rounding. All references to $ are to U.S. dollars. Life360, Inc. | ARBN 629 412 942 | 2261 Market Street, Suite 82184 San Francisco, CA 94114 | investors.life360.com 12
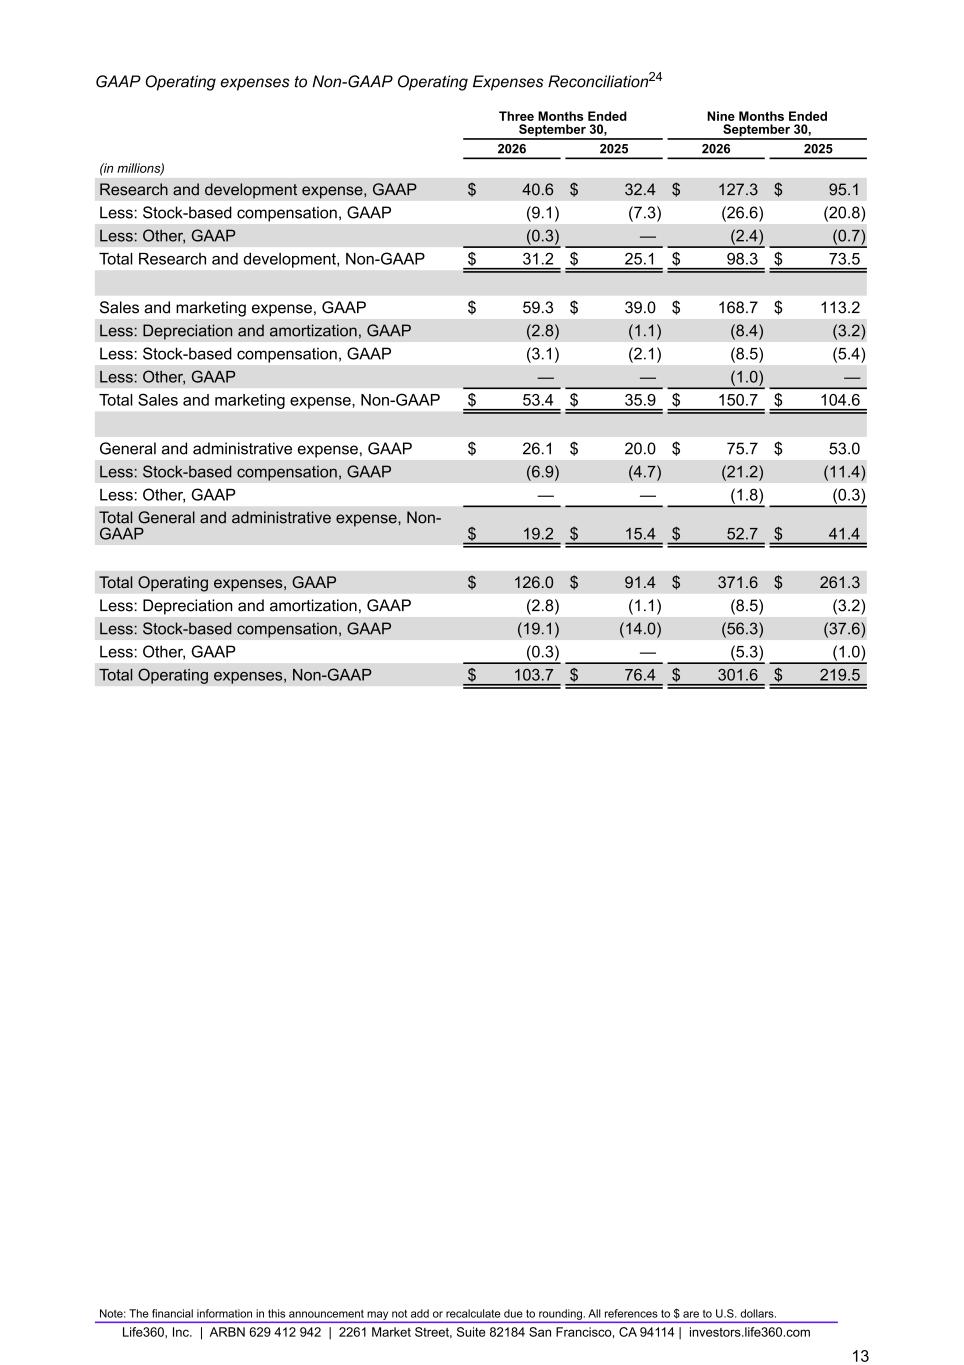
GAAP Operating expenses to Non-GAAP Operating Expenses Reconciliation24 Three Months Ended September 30, Nine Months Ended September 30, 2026 2025 2026 2025 (in millions) Research and development expense, GAAP $ 40.6 $ 32.4 $ 127.3 $ 95.1 Less: Stock-based compensation, GAAP (9.1) (7.3) (26.6) (20.8) Less: Other, GAAP (0.3) — (2.4) (0.7) Total Research and development, Non-GAAP $ 31.2 $ 25.1 $ 98.3 $ 73.5 Sales and marketing expense, GAAP $ 59.3 $ 39.0 $ 168.7 $ 113.2 Less: Depreciation and amortization, GAAP (2.8) (1.1) (8.4) (3.2) Less: Stock-based compensation, GAAP (3.1) (2.1) (8.5) (5.4) Less: Other, GAAP — — (1.0) — Total Sales and marketing expense, Non-GAAP $ 53.4 $ 35.9 $ 150.7 $ 104.6 General and administrative expense, GAAP $ 26.1 $ 20.0 $ 75.7 $ 53.0 Less: Stock-based compensation, GAAP (6.9) (4.7) (21.2) (11.4) Less: Other, GAAP — — (1.8) (0.3) Total General and administrative expense, Non- GAAP $ 19.2 $ 15.4 $ 52.7 $ 41.4 Total Operating expenses, GAAP $ 126.0 $ 91.4 $ 371.6 $ 261.3 Less: Depreciation and amortization, GAAP (2.8) (1.1) (8.5) (3.2) Less: Stock-based compensation, GAAP (19.1) (14.0) (56.3) (37.6) Less: Other, GAAP (0.3) — (5.3) (1.0) Total Operating expenses, Non-GAAP $ 103.7 $ 76.4 $ 301.6 $ 219.5 Note: The financial information in this announcement may not add or recalculate due to rounding. All references to $ are to U.S. dollars. Life360, Inc. | ARBN 629 412 942 | 2261 Market Street, Suite 82184 San Francisco, CA 94114 | investors.life360.com 13
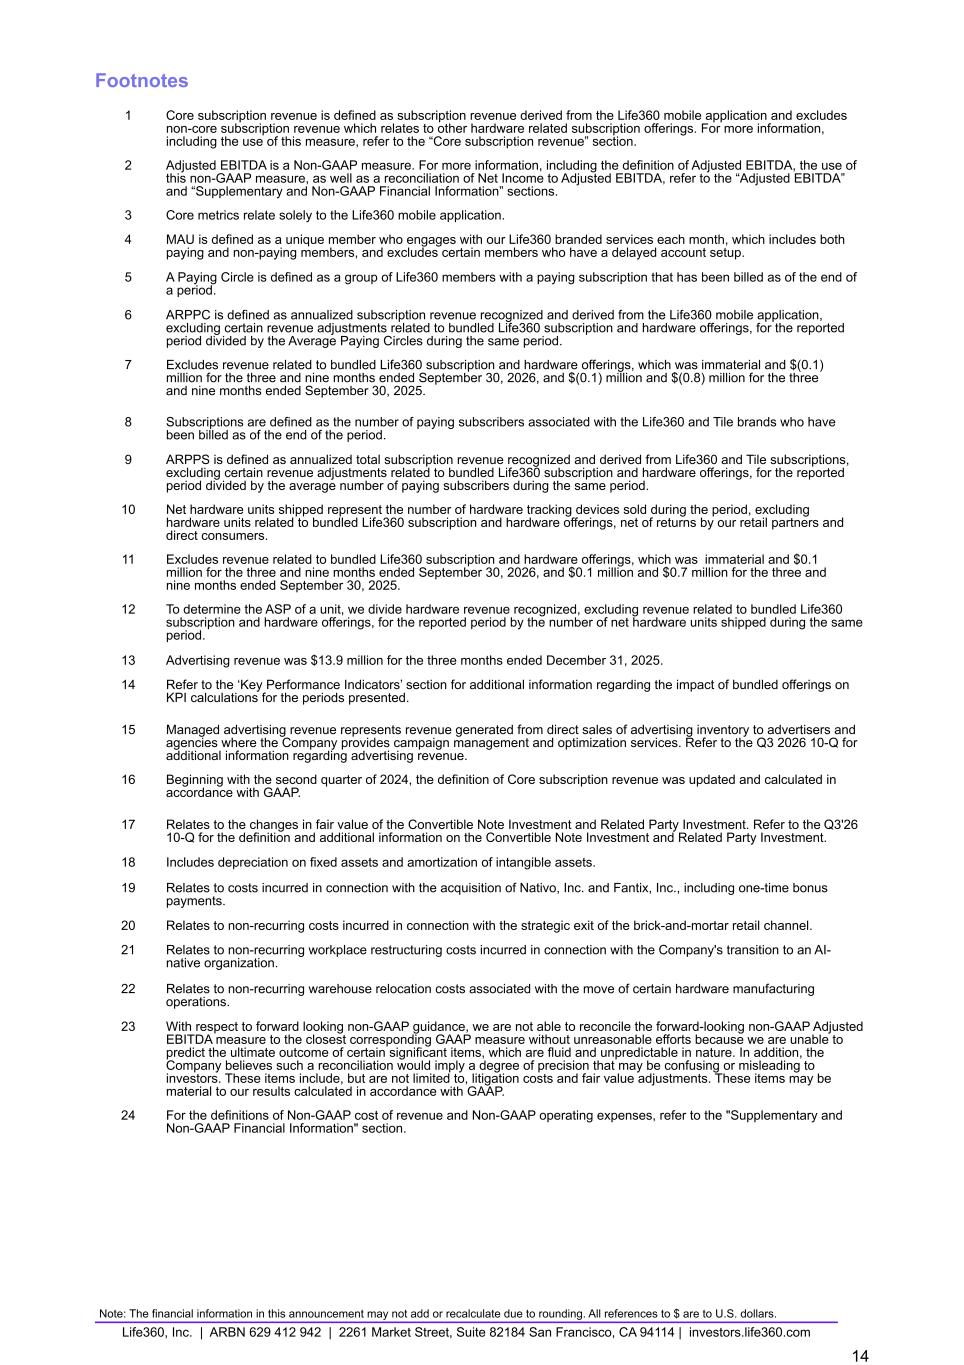
Footnotes 1 Core subscription revenue is defined as subscription revenue derived from the Life360 mobile application and excludes non-core subscription revenue which relates to other hardware related subscription offerings. For more information, including the use of this measure, refer to the “Core subscription revenue” section. 2 Adjusted EBITDA is a Non-GAAP measure. For more information, including the definition of Adjusted EBITDA, the use of this non-GAAP measure, as well as a reconciliation of Net Income to Adjusted EBITDA, refer to the “Adjusted EBITDA” and “Supplementary and Non-GAAP Financial Information” sections. 3 Core metrics relate solely to the Life360 mobile application. 4 MAU is defined as a unique member who engages with our Life360 branded services each month, which includes both paying and non-paying members, and excludes certain members who have a delayed account setup. 5 A Paying Circle is defined as a group of Life360 members with a paying subscription that has been billed as of the end of a period. 6 ARPPC is defined as annualized subscription revenue recognized and derived from the Life360 mobile application, excluding certain revenue adjustments related to bundled Life360 subscription and hardware offerings, for the reported period divided by the Average Paying Circles during the same period. 7 Excludes revenue related to bundled Life360 subscription and hardware offerings, which was immaterial and $(0.1) million for the three and nine months ended September 30, 2026, and $(0.1) million and $(0.8) million for the three and nine months ended September 30, 2025. 8 Subscriptions are defined as the number of paying subscribers associated with the Life360 and Tile brands who have been billed as of the end of the period. 9 ARPPS is defined as annualized total subscription revenue recognized and derived from Life360 and Tile subscriptions, excluding certain revenue adjustments related to bundled Life360 subscription and hardware offerings, for the reported period divided by the average number of paying subscribers during the same period. 10 Net hardware units shipped represent the number of hardware tracking devices sold during the period, excluding hardware units related to bundled Life360 subscription and hardware offerings, net of returns by our retail partners and direct consumers. 11 Excludes revenue related to bundled Life360 subscription and hardware offerings, which was immaterial and $0.1 million for the three and nine months ended September 30, 2026, and $0.1 million and $0.7 million for the three and nine months ended September 30, 2025. 12 To determine the ASP of a unit, we divide hardware revenue recognized, excluding revenue related to bundled Life360 subscription and hardware offerings, for the reported period by the number of net hardware units shipped during the same period. 13 Advertising revenue was $13.9 million for the three months ended December 31, 2025. 14 Refer to the ‘Key Performance Indicators’ section for additional information regarding the impact of bundled offerings on KPI calculations for the periods presented. 15 Managed advertising revenue represents revenue generated from direct sales of advertising inventory to advertisers and agencies where the Company provides campaign management and optimization services. Refer to the Q3 2026 10-Q for additional information regarding advertising revenue. 16 Beginning with the second quarter of 2024, the definition of Core subscription revenue was updated and calculated in accordance with GAAP. 17 Relates to the changes in fair value of the Convertible Note Investment and Related Party Investment. Refer to the Q3'26 10-Q for the definition and additional information on the Convertible Note Investment and Related Party Investment. 18 Includes depreciation on fixed assets and amortization of intangible assets. 19 Relates to costs incurred in connection with the acquisition of Nativo, Inc. and Fantix, Inc., including one-time bonus payments. 20 Relates to non-recurring costs incurred in connection with the strategic exit of the brick-and-mortar retail channel. 21 Relates to non-recurring workplace restructuring costs incurred in connection with the Company's transition to an AI- native organization. 22 Relates to non-recurring warehouse relocation costs associated with the move of certain hardware manufacturing operations. 23 With respect to forward looking non-GAAP guidance, we are not able to reconcile the forward-looking non-GAAP Adjusted EBITDA measure to the closest corresponding GAAP measure without unreasonable efforts because we are unable to predict the ultimate outcome of certain significant items, which are fluid and unpredictable in nature. In addition, the Company believes such a reconciliation would imply a degree of precision that may be confusing or misleading to investors. These items include, but are not limited to, litigation costs and fair value adjustments. These items may be material to our results calculated in accordance with GAAP. 24 For the definitions of Non-GAAP cost of revenue and Non-GAAP operating expenses, refer to the "Supplementary and Non-GAAP Financial Information" section. Note: The financial information in this announcement may not add or recalculate due to rounding. All references to $ are to U.S. dollars. Life360, Inc. | ARBN 629 412 942 | 2261 Market Street, Suite 82184 San Francisco, CA 94114 | investors.life360.com 14

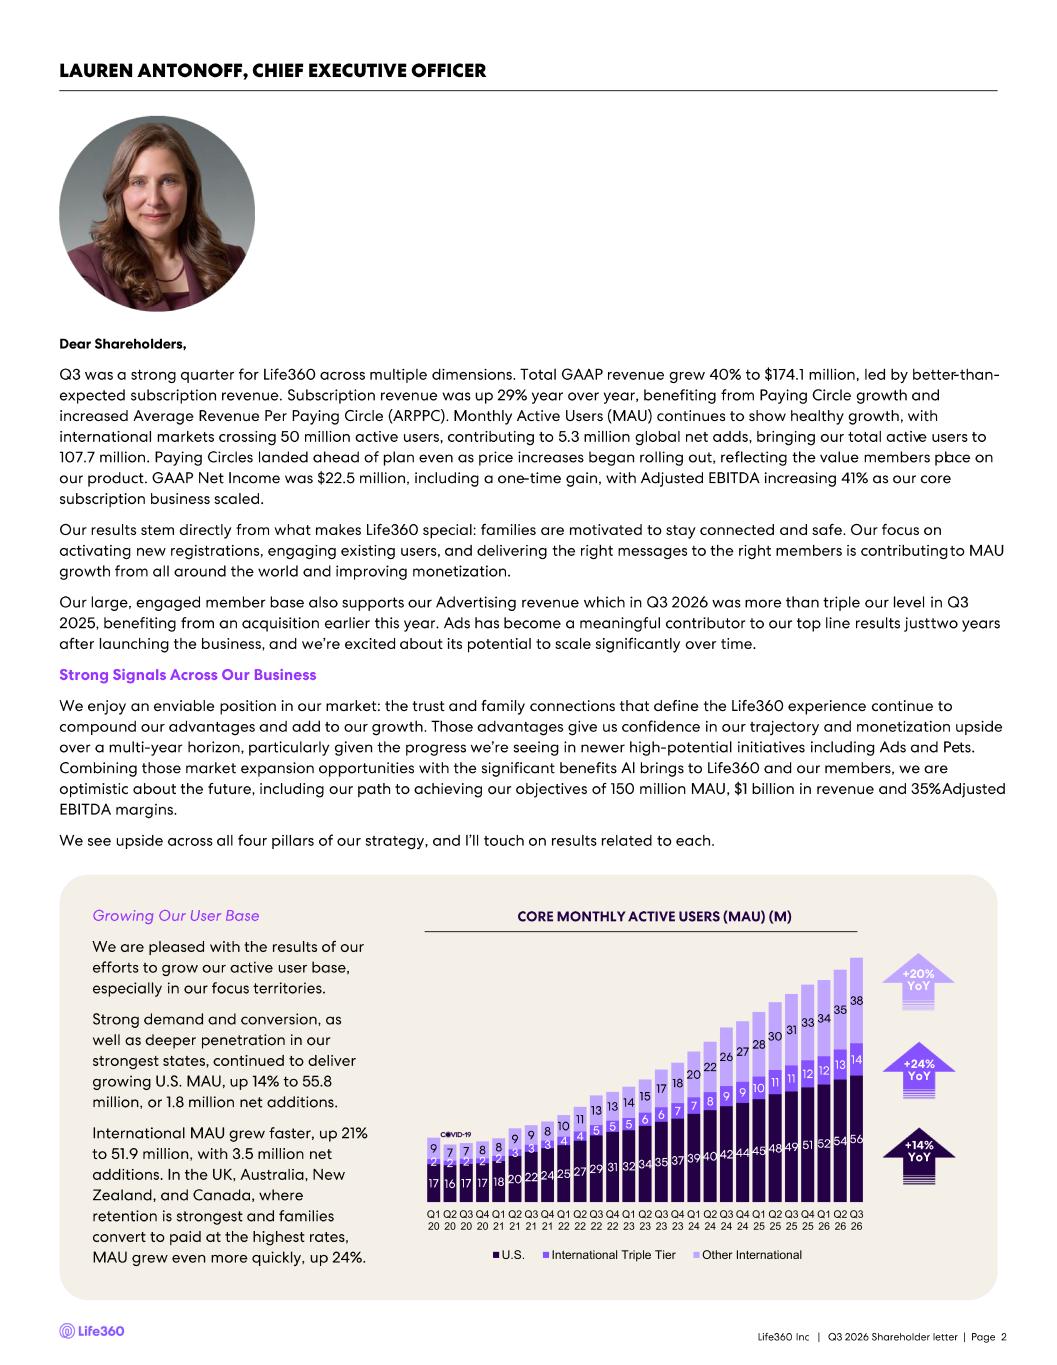
Q1 20 Q2 20 Q3 20 Q4 20 Q1 21 Q2 21 Q3 21 Q4 21 Q1 22 Q2 22 Q3 22 Q4 22 Q1 23 Q2 23 Q3 23 Q4 23 Q1 24 Q2 24 Q3 24 Q4 24 Q1 25 Q2 25 Q3 25 Q4 25 Q1 26 Q2 26 Q3 26 U.S. International Triple Tier Other International
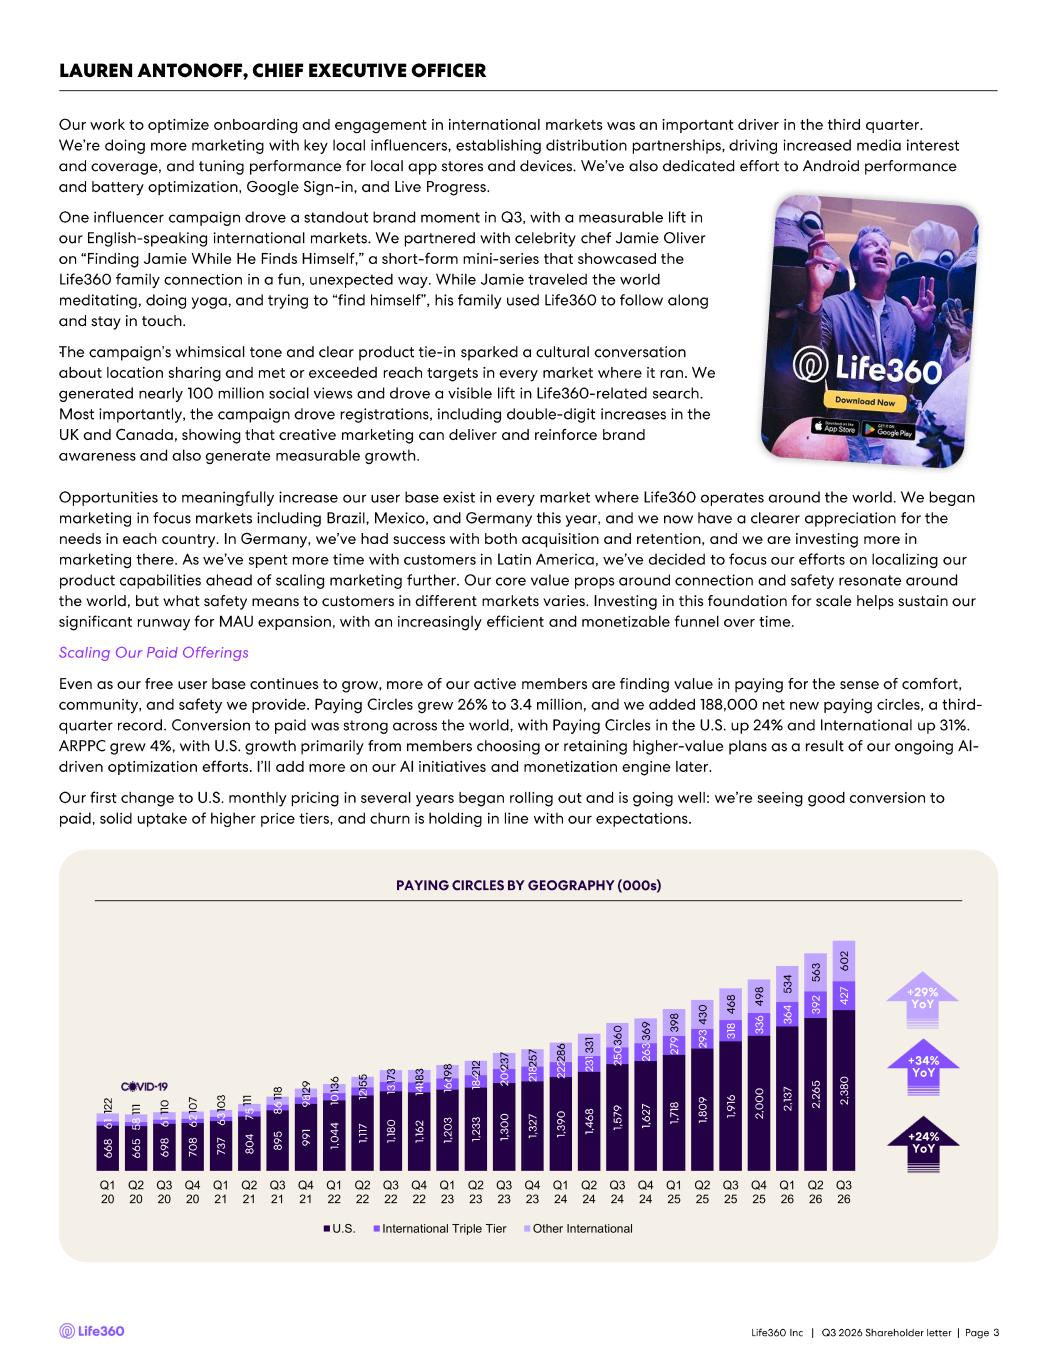
Q1 20 Q2 20 Q3 20 Q4 20 Q1 21 Q2 21 Q3 21 Q4 21 Q1 22 Q2 22 Q3 22 Q4 22 Q1 23 Q2 23 Q3 23 Q4 23 Q1 24 Q2 24 Q3 24 Q4 24 Q1 25 Q2 25 Q3 25 Q4 25 Q1 26 Q2 26 Q3 26 U.S. International Triple Tier Other International
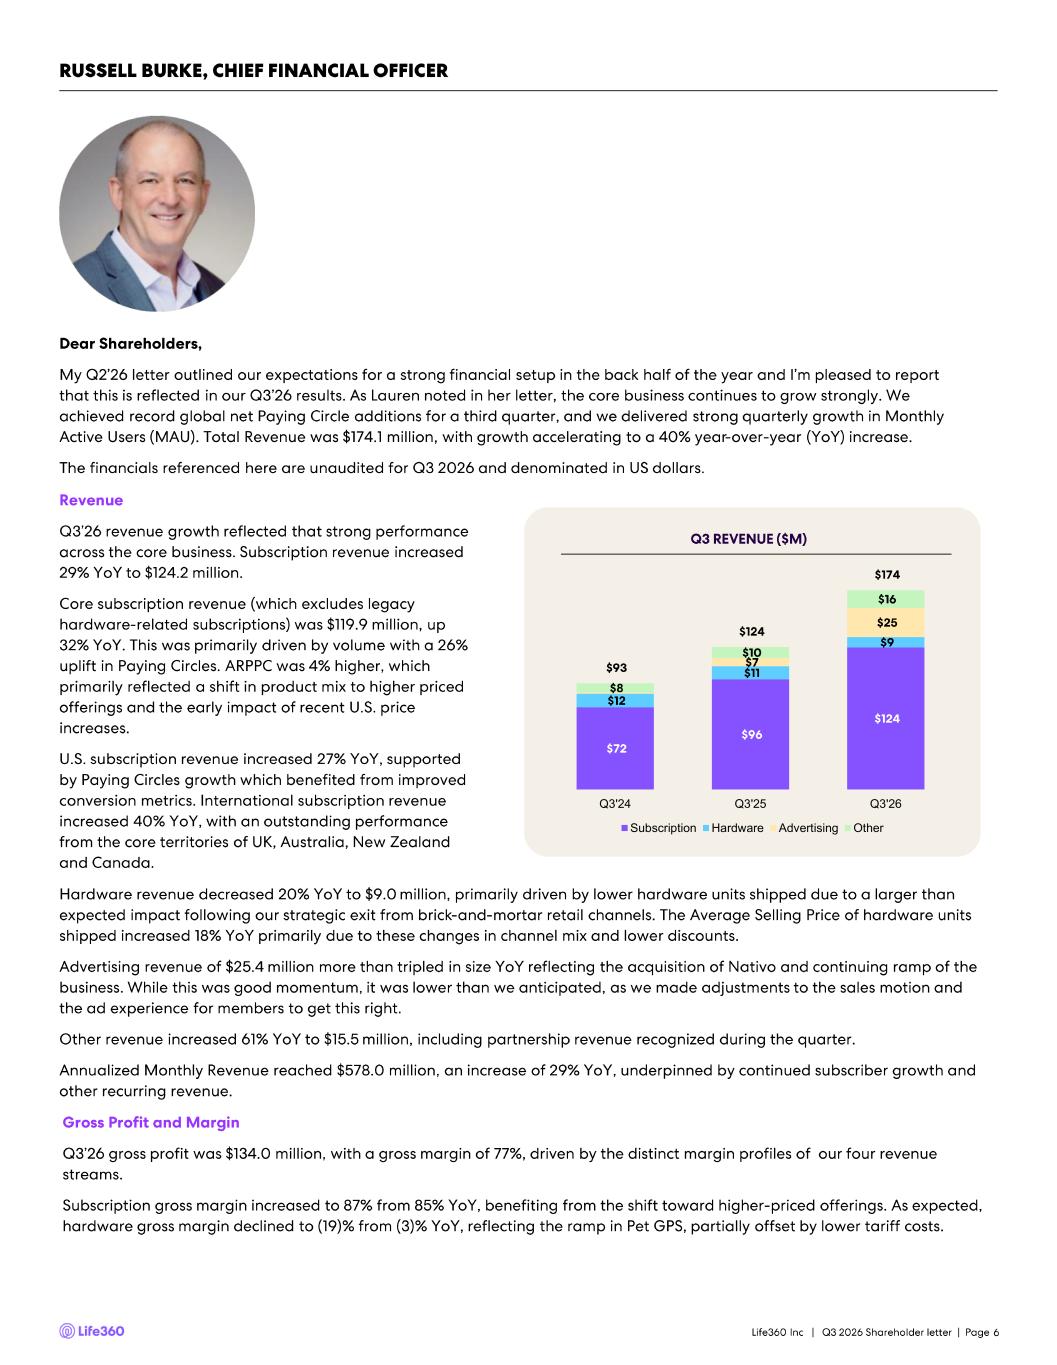
Q3'24 Q3'25 Q3'26 Subscription Hardware Advertising Other
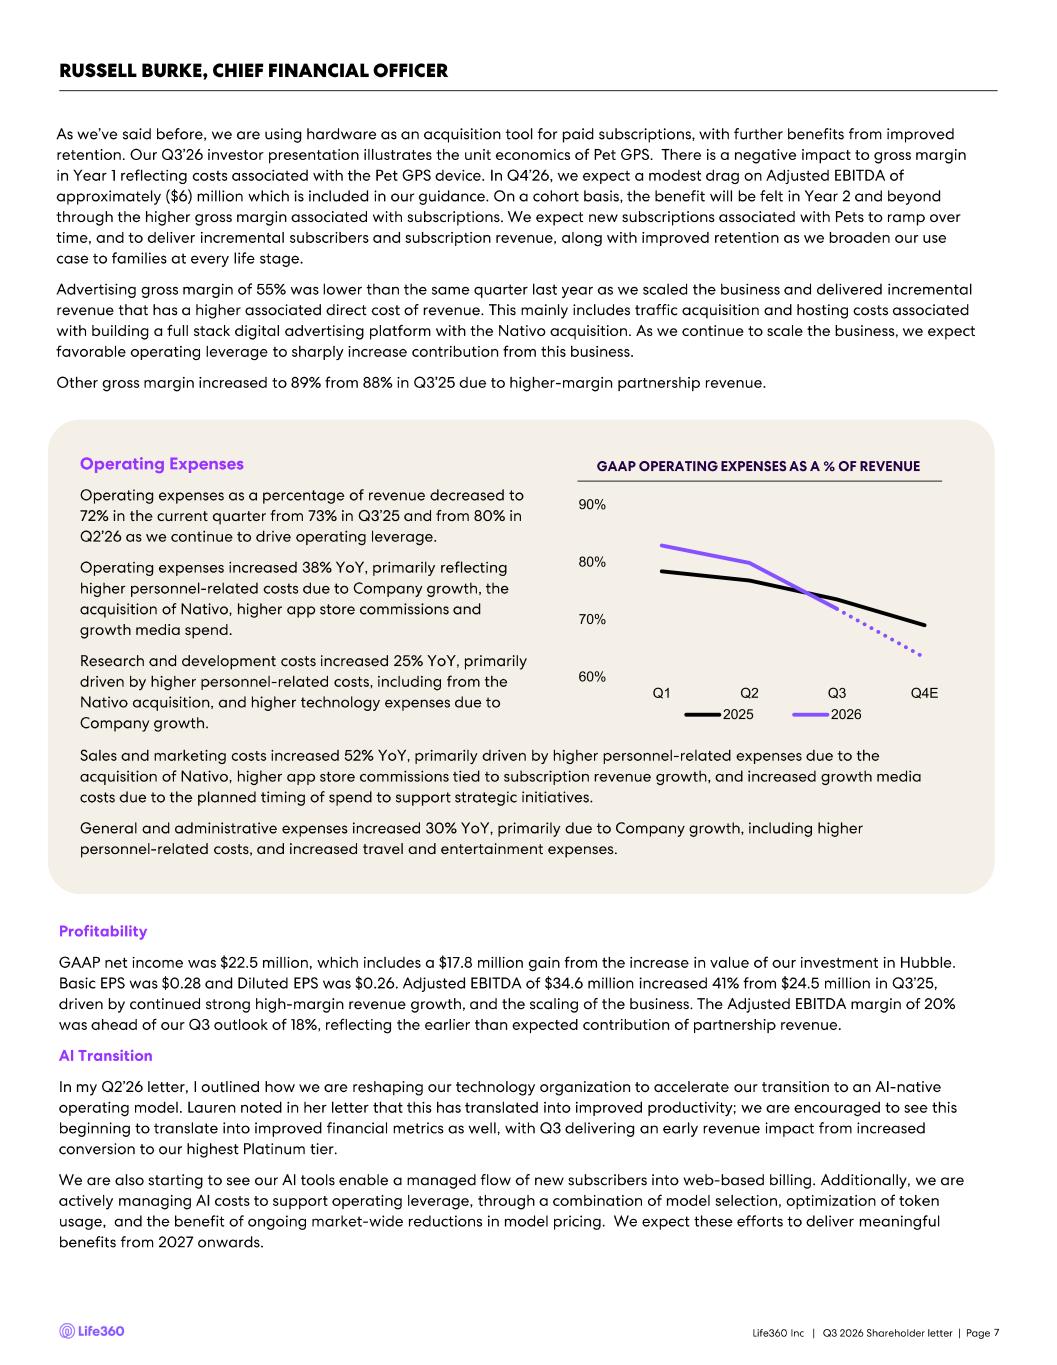
60% 70% 80% 90% Q1 Q2 Q3 Q4E 2025 2026
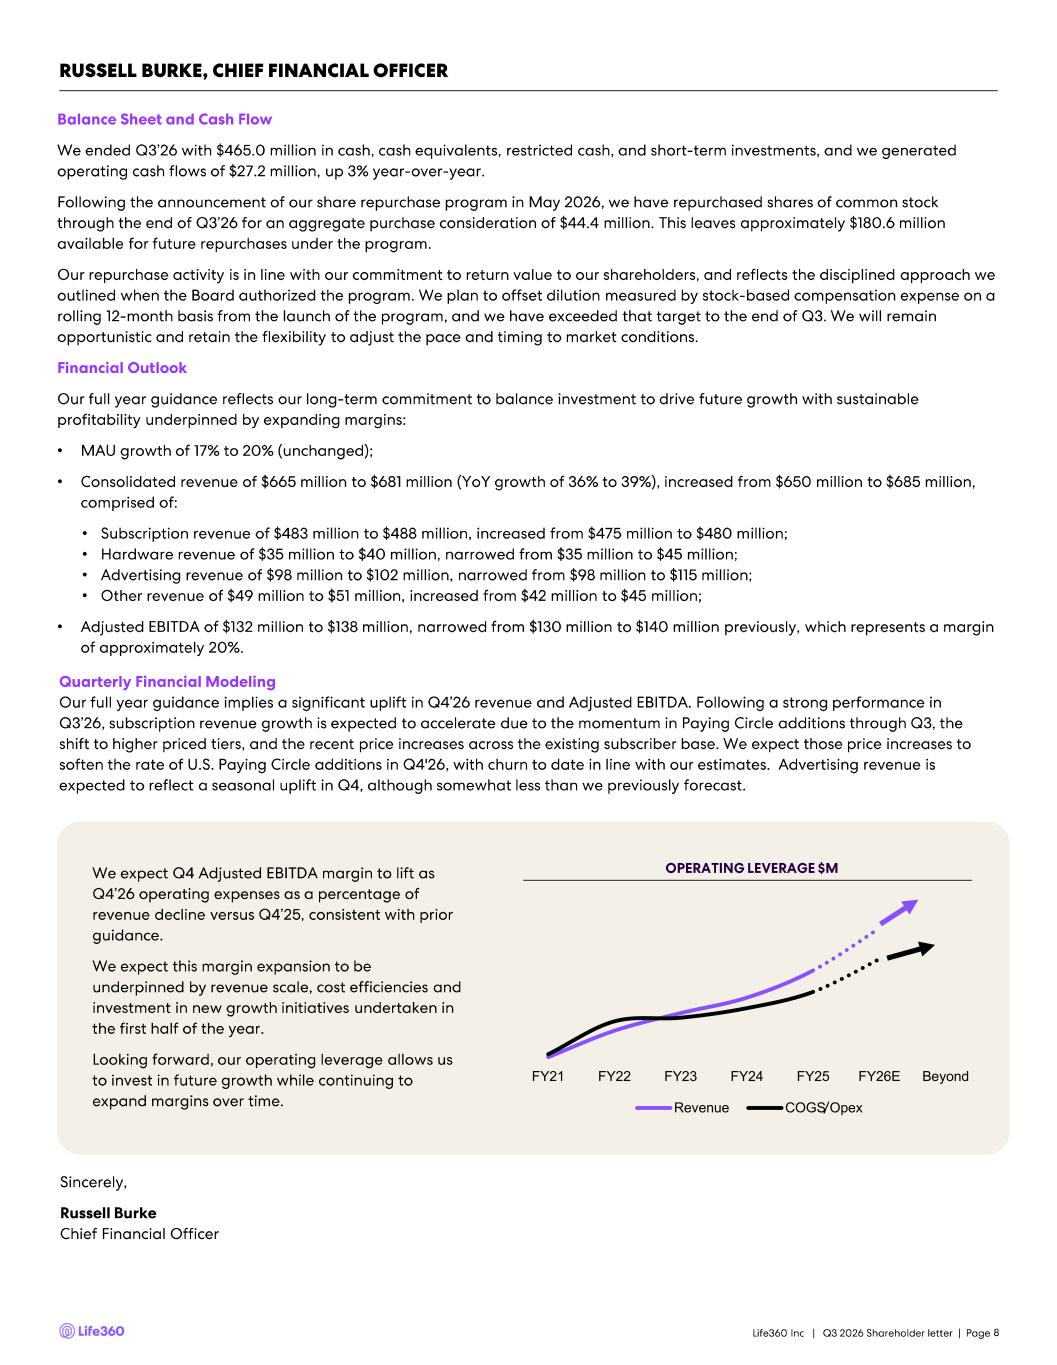
FY21 FY22 FY23 FY24 FY25 FY26E Beyond Revenue COGS Opex • • • • • • •



Q3'26 Investor Update Q U A R T E R L Y P R E S E N T A T I O N 9 November 2026 U.S. PT 10 November 2026 AEDT

Investor Presentation | November 2026 DISCLAIMER These materials and the accompanying oral presentation have been prepared by Life360, Inc. (ARBN 629 412 942) (“Company”) on a confidential and non-reliance basis, and may not be reproduced in whole or in part, nor may any of its contents be disclosed, to any other person, without the prior written consent of the Company. These materials are for informational purposes only. This presentation contains summary information about the Company and its activities and is current as of the date of this presentation. This presentation does not purport to be all- inclusive or to contain all of the information you may desire. It should be read in conjunction with the Company’s periodic and continuous disclosure announcements filed with the Australian Securities Exchange and the U.S. Securities and Exchange Commission (“SEC”), available at www.asx.com.au and www.sec.gov, respectively. These materials do not constitute an offer, invitation, solicitation or recommendation with respect to the purchase or sale of any security in the Company or interest therein nor does it constitute financial product advice. These materials are not a prospectus, product disclosure statement or other offer document under Australian law or under any other law. These materials have not been filed, registered or approved by regulatory authorities in any jurisdiction. This communication is restricted by law; it is not intended for distribution to, or use by any person in, any jurisdiction where such distribution or use would be contrary to local law or regulation. The information contained in these materials is not intended to be relied upon as advice or a recommendation to investors and is not intended to form the basis of any investment decision in the Company’s securities. The information does not take into account the investment objectives, financial situation, taxation situation or needs of any particular investor. An investor must not act on the basis of any matter contained in these materials but must make its own assessment of the Company and conduct its own investigations and analysis. Investors should assess their own individual financial circumstances and consider talking to a financial adviser, professional adviser or consultant before making any investment decision. By reading these materials you agree to be bound by the limitations set out in these materials. No representation or warranty, express or implied, is made as to the accuracy, reliability, completeness or fairness of the information, opinions, forecasts, reports, estimates and conclusions contained in these materials. The Company does not undertake any obligation to provide any additional information nor update or revise the information in these materials nor correct any inaccuracies or omissions. To the maximum extent permitted by law, none of the Company and its related bodies corporate, or their respective directors, employees or agents, nor any other person accepts any responsibility nor any liability for loss arising from the use of or reliance on information contained in these materials or otherwise arising in connection with it, nor in relation to any other written or oral information or opinions provided now or in the future to the recipient or its advisers and representatives, including without limitation any liability from fault of negligence. Past performance is not indicative of future performance and no guarantee of future returns is implied or given. Nothing contained in these materials nor any information made available to you is, or shall be relied upon as, a promise, representation, warranty or guarantee as to the past, present or the future performance of the Company. Certain statements in these materials constitute forward-looking statements within the meaning of the Private Securities Litigation Reform Act of 1995 (“PSLRA”), Section 27A of the Securities Act of 1933, as amended, and Section 21E of the Securities Exchange Act of 1934, as amended (the “Exchange Act”). Statements that are not historical in nature, including the words “anticipate”, “expect”, “suggests”, “plan”, “believe”, “intend”, “estimates”, “targets”, “projects”, “should”, “could”, “would”, “may”, “will”, “forecast,” “opportunity,” “goal,” “vision,” “outlook” and other similar expressions are intended to identify forward-looking statements. These forward-looking statements include, but are not limited to, statements regarding: the Company’s growth strategy and business plan and the Company’s ability to effectively manage its growth and meet future capital requirements; the Company’s expectations regarding future financial performance, including its expectations regarding its revenue, revenue growth, adjusted EBITDA, and operating cash flow, and the Company’s ability to achieve or maintain future profitability; the Company’s ability to further penetrate its existing member base, maintain and expand its member base and increase monetization of its member base; the Company’s ability to expand internationally and the significance of its global opportunity; the Company’s ability to anticipate market needs or develop new products and services or enhance existing products and services to meet those needs; the Company’s ability to increase sales of its products and services. Such forward-looking statements are prediction, projections and other statements about future events that are based on current expectations and assumptions and, as a result, involve known and unknown risks, uncertainties, assumptions and other important factors, many of which are beyond the control of the Company and which may cause actual results, performance or achievements to differ materially from those expressed or implied by such statements. These risks and uncertainties include those described under the heading "Risk Factors" in the Company's Quarterly Report on Form 10-Q for the quarter to which this presentation relates and in the Company's most recent Annual Report on Form 10-K, each as filed with the SEC and lodged with the ASX, as such risks may be updated in subsequent filings. Forward-looking statements are provided as a general guide only, and should not be relied on as an indication or guarantee of future performance. They can be affected by inaccurate assumptions we might make or by known or unknown risks or uncertainties. Given these uncertainties, recipients are cautioned to not place undue reliance on any forward-looking statement. Forward-looking statements speak only as of the date they are made. Subject to any continuing obligations under applicable law the Company disclaims any obligation or undertaking to disseminate any updates or revisions to any forward-looking statements in these materials to reflect any change in expectations in relation to such forward-looking statements or any change in events, conditions or circumstances on which any such statement is based. This presentation contains certain measures of financial performance not determined in accordance with U.S. generally accepted accounting principles (“GAAP”), including Adjusted EBITDA, Adjusted EBITDA margin, and non-GAAP Operating Expenses (the “non-GAAP financial measures”). The non-GAAP financial measures are used by Company management to evaluate financial performance of, and determine resource allocation for, each of the Company's operating segments. Items excluded from each of the non-GAAP financial measures are significant components in understanding and assessing financial performance. The non-GAAP financial measures should not be considered in isolation, or as alternatives to, or substitutes for, net income, net income margin, income from operations, cash flows generated by operations, investing or financing activities, or other financial statement data presented in the Company's consolidated financial statements as indicators of financial performance or liquidity. Because the non- GAAP financial measures are not measurements determined in accordance with GAAP and are thus susceptible to varying definitions, the non-GAAP financial measurements as presented may not be comparable to other similarly titled measures of other companies. Please refer to the Appendix beginning on slide 31 of this presentation for a reconciliation of these financial measures to the most directly comparable financial measure prepared in accordance with GAAP. This presentation includes our trademarks and trade names that we own or license and our logo. This presentation also includes trademarks, trade names and service marks that are the property of other organizations. Solely for convenience, trademarks and trade names referred to in this these materials appear without any “TM” or “®” symbol, but those references are not intended to indicate, in any way, that we will not assert, to the fullest extent under applicable law, our rights to these trademarks, trade names and service marks. We do not intend our use or display of other parties' trademarks, trade names or service marks to imply, and such use or display should not be construed to imply, a relationship with, or endorsement or sponsorship of us by, these other parties. FIFA®, FIFA World Cup®, and World Cup® are trademarks of FIFA. Life360 is not affiliated with, sponsored by, or endorsed by FIFA. References to the FIFA World Cup are for descriptive purposes only. This presentation includes industry and market data derived from internal analyses based upon publicly available data or other proprietary research and analysis, surveys or studies conducted by third parties and industry and general publications. Unless otherwise indicated, information contained in this presentation concerning our industry and the markets in which we operate, including our general expectations and market position, market opportunity and market size, is based on these various sources. Because this information involves a number of assumptions and limitations, you are cautioned not to give undue weight to such information. We have not independently verified market data and industry forecasts provided by any of these or any other third-party sources referred to in this presentation. All values are stated in US dollars unless otherwise stated. 2
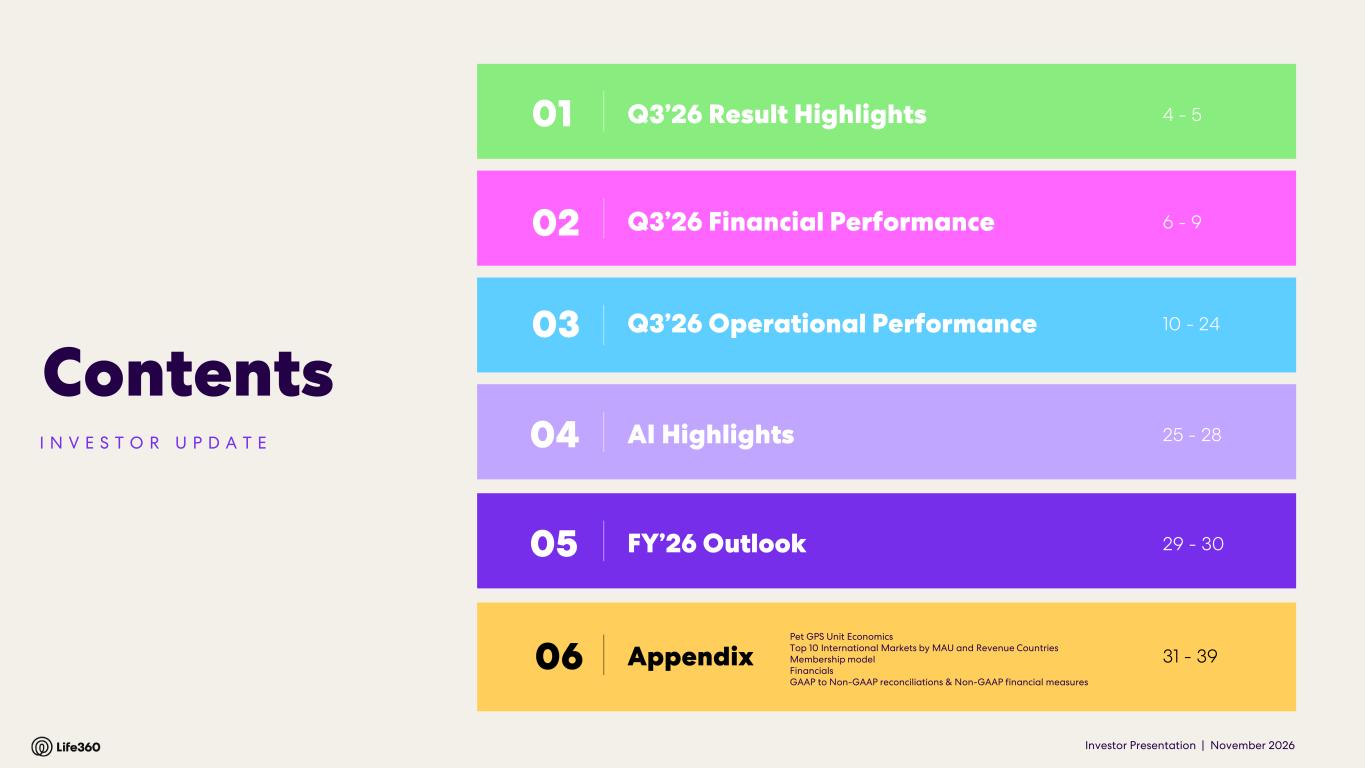
Investor Presentation | November 2026 Contents Q3’26 Operational Performance03 10 - 24 Q3’26 Financial Performance02 6 - 9 Q3’26 Result Highlights01 4 - 5 Appendix06 31 - 39 05 FY’26 Outlook 29 - 30 I N V E S T O R U P D A T E 04 AI Highlights 25 - 28 Pet GPS Unit Economics Top 10 International Markets by MAU and Revenue Countries Membership model Financials GAAP to Non-GAAP reconciliations & Non-GAAP financial measures

02 | FINANCIAL PERFORMANCE 03 | OPERATIONAL PERFORMANCE 05 | OUTLOOK 06 | APPENDIX 01 Q3’26 Result Highlights I N V E S T O R U P D A T E 01 | HIGHLIGHTS 04 | AI HIGHLIGHTS
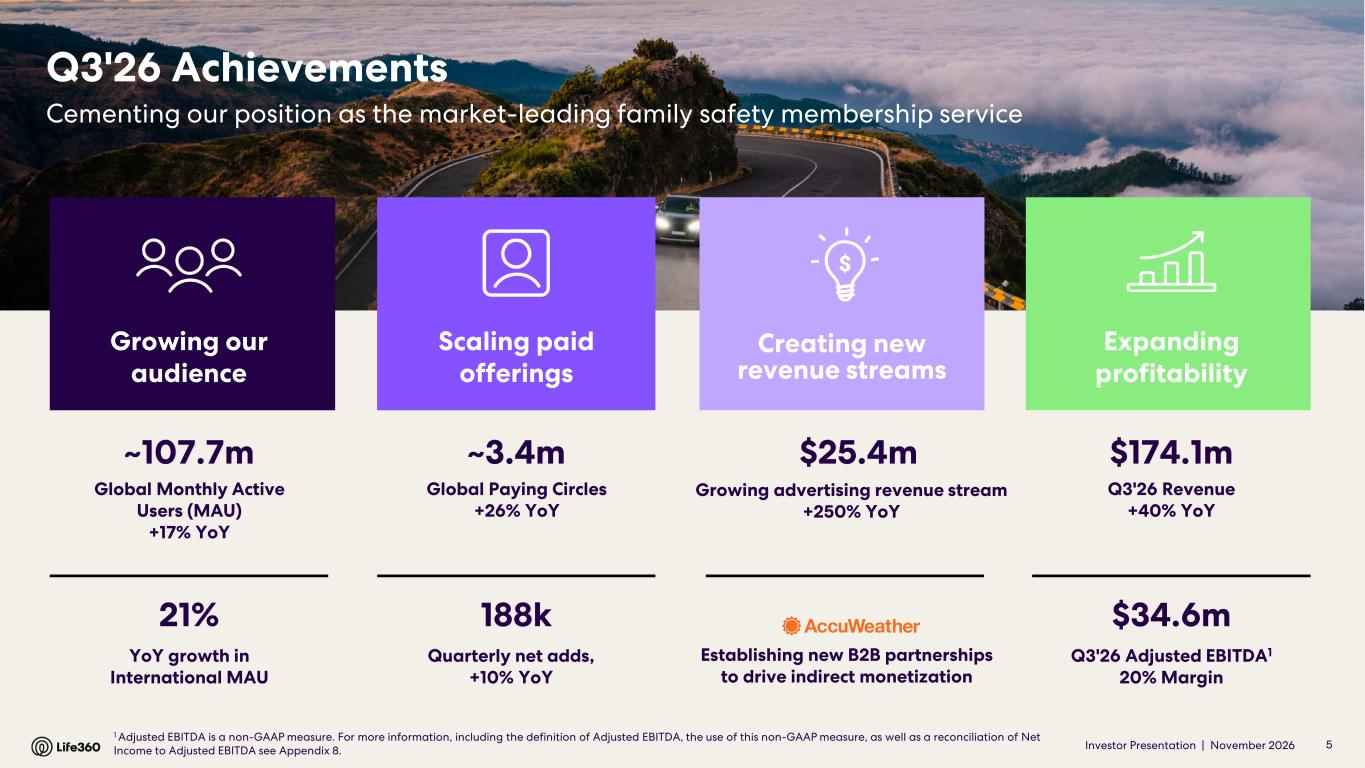
Investor Presentation | November 2026 Q3'26 Achievements Cementing our position as the market-leading family safety membership service $174.1m Q3'26 Revenue +40% YoY $34.6m Q3'26 Adjusted EBITDA1 20% Margin Expanding profitability ~3.4m Global Paying Circles +26% YoY 188k Quarterly net adds, +10% YoY Scaling paid offerings ~107.7m Global Monthly Active Users (MAU) +17% YoY 21% YoY growth in International MAU Growing our audience Establishing new B2B partnerships to drive indirect monetization Growing advertising revenue stream +250% YoY Creating new revenue streams 5 1 Adjusted EBITDA is a non-GAAP measure. For more information, including the definition of Adjusted EBITDA, the use of this non-GAAP measure, as well as a reconciliation of Net Income to Adjusted EBITDA see Appendix 8. $25.4m

02 Q3’26 Financial Performance I N V E S T O R U P D A T E 02 | FINANCIAL PERFORMANCE 03 | OPERATIONAL PERFORMANCE 05 | OUTLOOK 06 | APPENDIX04 | AI HIGHLIGHTS01 | HIGHLIGHTS
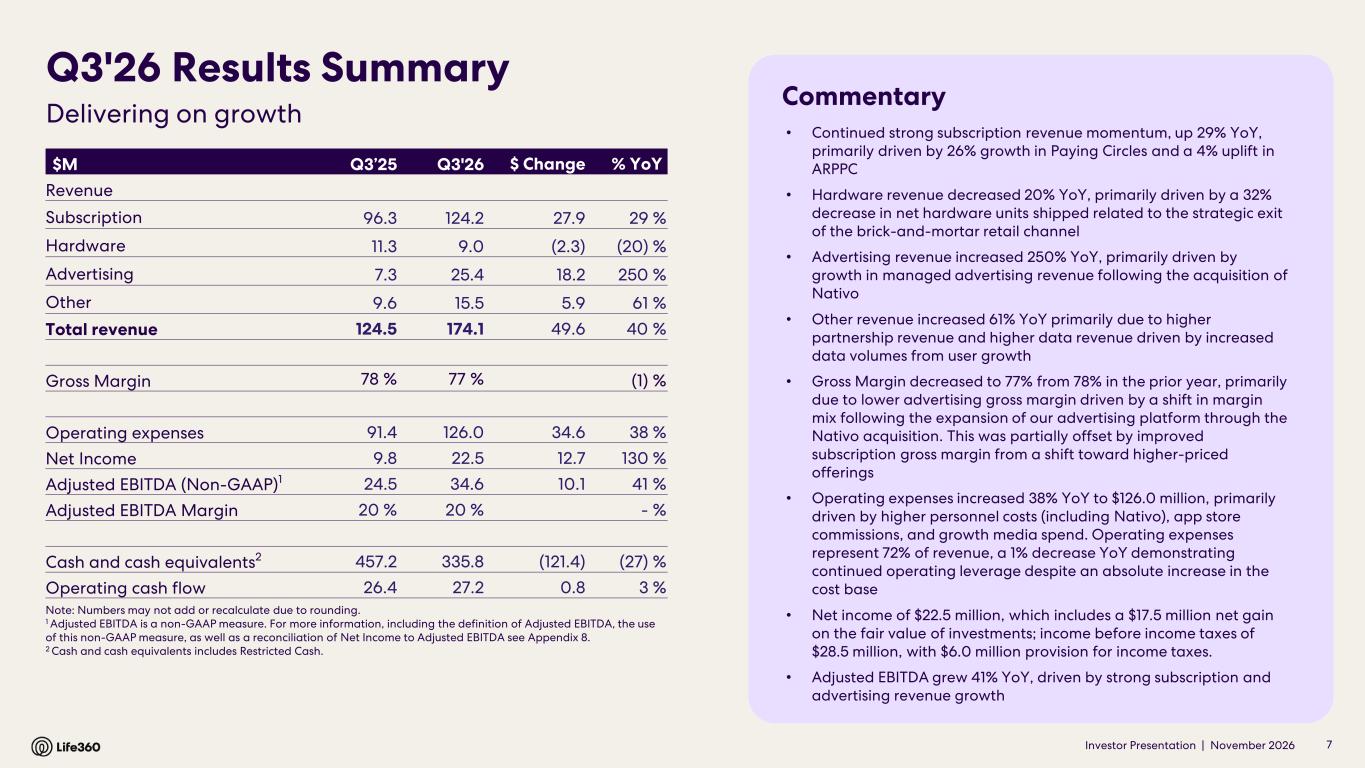
Investor Presentation | November 2026 • Continued strong subscription revenue momentum, up 29% YoY, primarily driven by 26% growth in Paying Circles and a 4% uplift in ARPPC • Hardware revenue decreased 20% YoY, primarily driven by a 32% decrease in net hardware units shipped related to the strategic exit of the brick-and-mortar retail channel • Advertising revenue increased 250% YoY, primarily driven by growth in managed advertising revenue following the acquisition of Nativo • Other revenue increased 61% YoY primarily due to higher partnership revenue and higher data revenue driven by increased data volumes from user growth • Gross Margin decreased to 77% from 78% in the prior year, primarily due to lower advertising gross margin driven by a shift in margin mix following the expansion of our advertising platform through the Nativo acquisition. This was partially offset by improved subscription gross margin from a shift toward higher-priced offerings • Operating expenses increased 38% YoY to $126.0 million, primarily driven by higher personnel costs (including Nativo), app store commissions, and growth media spend. Operating expenses represent 72% of revenue, a 1% decrease YoY demonstrating continued operating leverage despite an absolute increase in the cost base • Net income of $22.5 million, which includes a $17.5 million net gain on the fair value of investments; income before income taxes of $28.5 million, with $6.0 million provision for income taxes. • Adjusted EBITDA grew 41% YoY, driven by strong subscription and advertising revenue growth $M Q3’25 Q3'26 $ Change % YoY Revenue Subscription 96.3 124.2 27.9 29 % Hardware 11.3 9.0 (2.3) (20) % Advertising 7.3 25.4 18.2 250 % Other 9.6 15.5 5.9 61 % Total revenue 124.5 174.1 49.6 40 % Gross Margin 78 % 77 % (1) % Operating expenses 91.4 126.0 34.6 38 % Net Income 9.8 22.5 12.7 130 % Adjusted EBITDA (Non-GAAP)1 24.5 34.6 10.1 41 % Adjusted EBITDA Margin 20 % 20 % - % Cash and cash equivalents2 457.2 335.8 (121.4) (27) % Operating cash flow 26.4 27.2 0.8 3 % Note: Numbers may not add or recalculate due to rounding. 1 Adjusted EBITDA is a non-GAAP measure. For more information, including the definition of Adjusted EBITDA, the use of this non-GAAP measure, as well as a reconciliation of Net Income to Adjusted EBITDA see Appendix 8. 2 Cash and cash equivalents includes Restricted Cash. Q3'26 Results Summary Commentary Delivering on growth 7
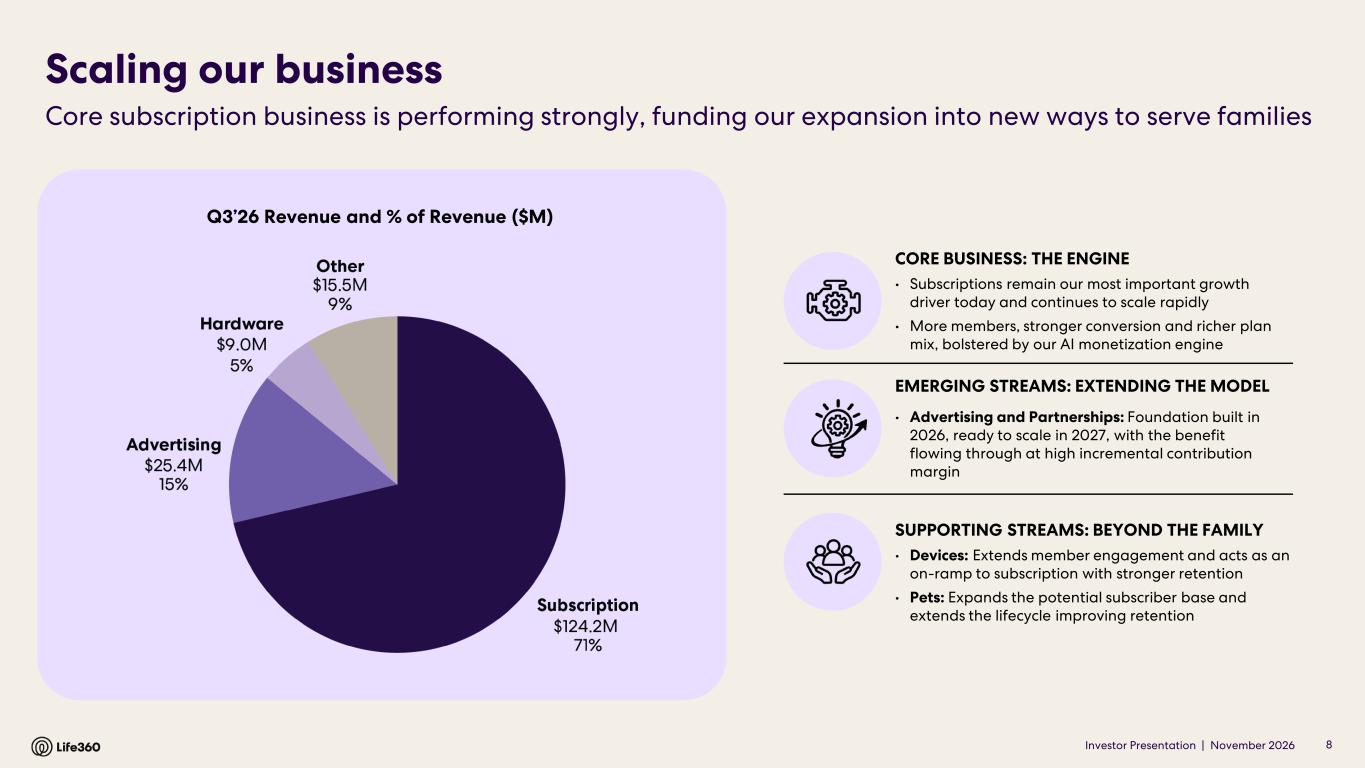
Investor Presentation | November 2026 Scaling our business Core subscription business is performing strongly, funding our expansion into new ways to serve families 8 CORE BUSINESS: THE ENGINE • Subscriptions remain our most important growth driver today and continues to scale rapidly • More members, stronger conversion and richer plan mix, bolstered by our AI monetization engine EMERGING STREAMS: EXTENDING THE MODEL • Advertising and Partnerships: Foundation built in 2026, ready to scale in 2027, with the benefit flowing through at high incremental contribution margin SUPPORTING STREAMS: BEYOND THE FAMILY • Devices: Extends member engagement and acts as an on-ramp to subscription with stronger retention • Pets: Expands the potential subscriber base and extends the lifecycle improving retention Q3’26 Revenue and % of Revenue ($M)
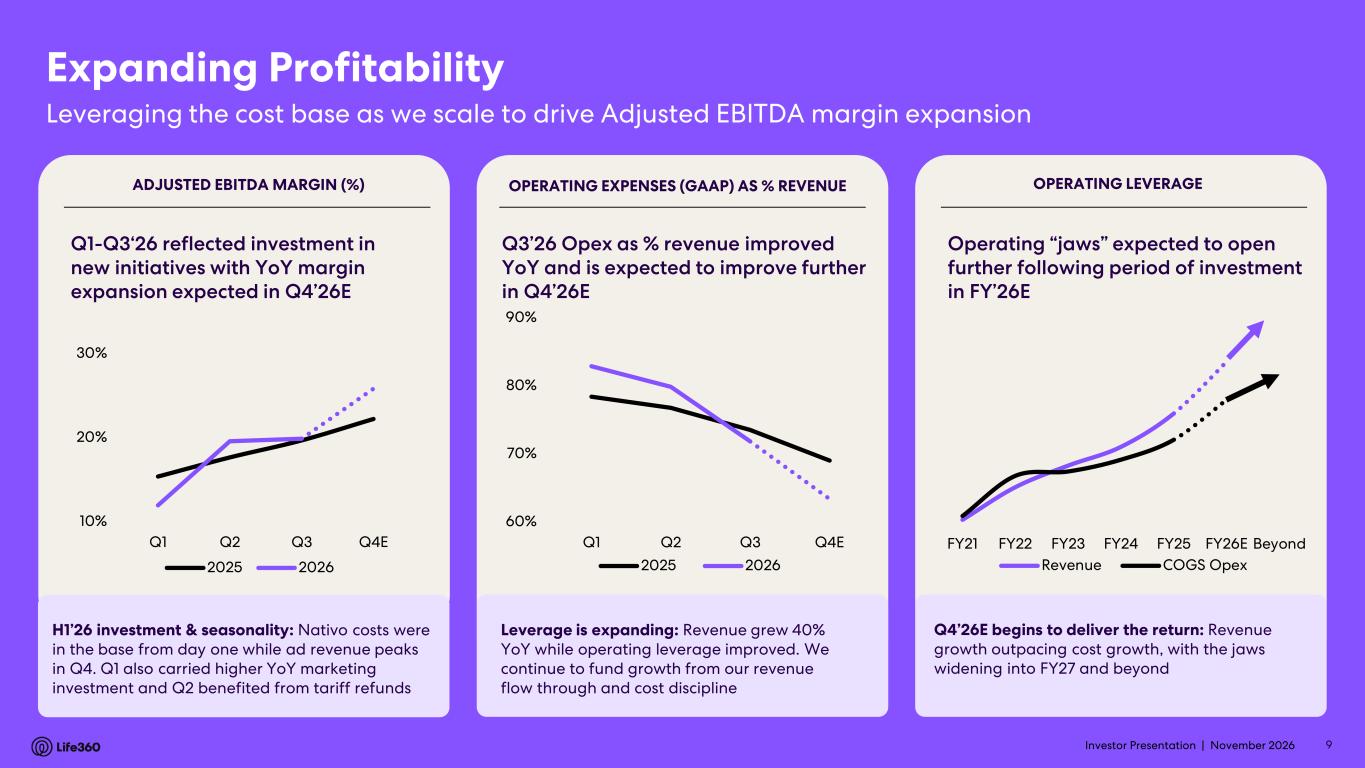
Investor Presentation | November 2026 Expanding Profitability Leveraging the cost base as we scale to drive Adjusted EBITDA margin expansion 9 60% 70% 80% 90% Q1 Q2 Q3 Q4E 2025 2026 Q3’26 Opex as % revenue improved YoY and is expected to improve further in Q4’26E OPERATING EXPENSES (GAAP) AS % REVENUE Q1-Q3‘26 reflected investment in new initiatives with YoY margin expansion expected in Q4’26E ADJUSTED EBITDA MARGIN (%) H1’26 investment & seasonality: Nativo costs were in the base from day one while ad revenue peaks in Q4. Q1 also carried higher YoY marketing investment and Q2 benefited from tariff refunds Leverage is expanding: Revenue grew 40% YoY while operating leverage improved. We continue to fund growth from our revenue flow through and cost discipline Q4’26E begins to deliver the return: Revenue growth outpacing cost growth, with the jaws widening into FY27 and beyond 10% 20% 30% Q1 Q2 Q3 Q4E 2025 2026 Operating “jaws” expected to open further following period of investment in FY’26E OPERATING LEVERAGE FY21 FY22 FY23 FY24 FY25 FY26E Beyond Revenue COGS Opex

02 | FINANCIAL PERFORMANCE 03 | OPERATIONAL PERFORMANCE 05 | OUTLOOK 06 | APPENDIX04 | AI HIGHLIGHTS01 | HIGHLIGHTS
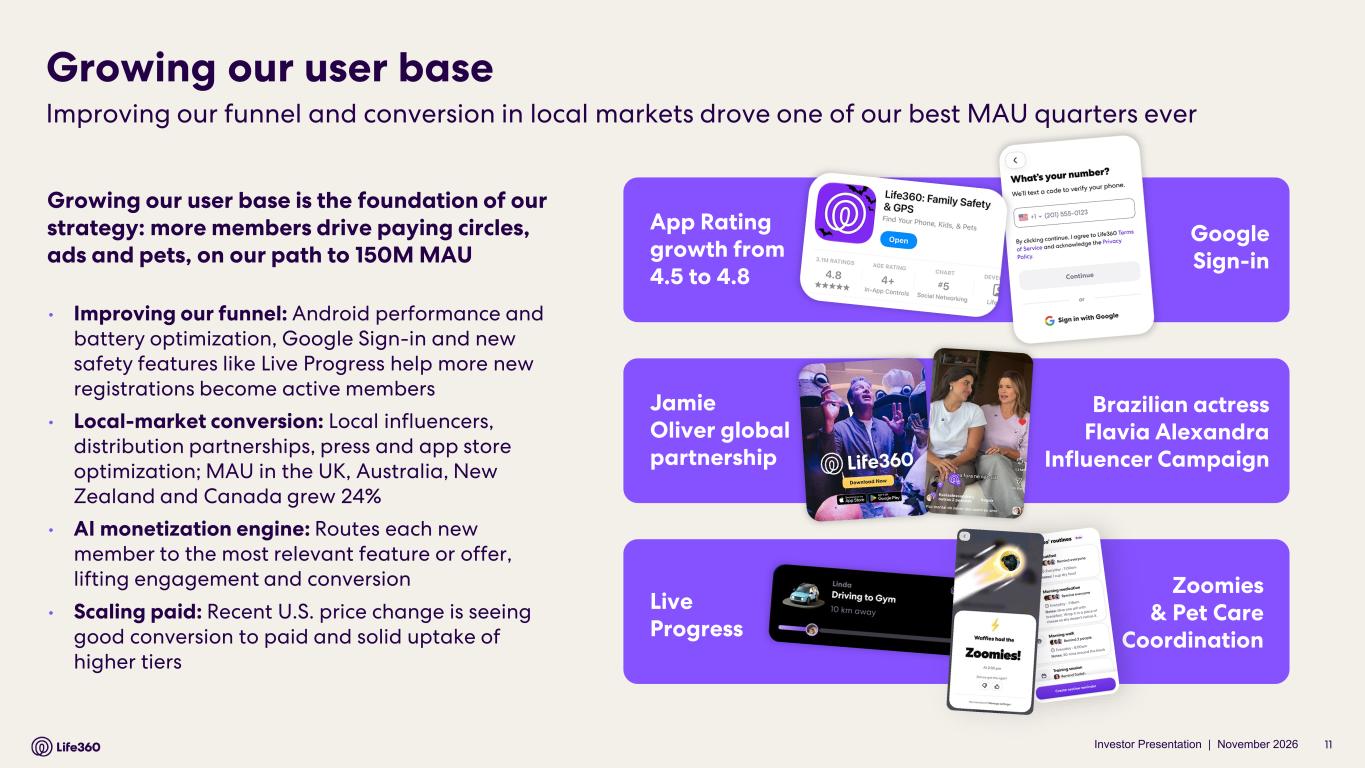
Investor Presentation | November 2026 Live Progress Zoomies & Pet Care Coordination Jamie Oliver global partnership Brazilian actress Flavia Alexandra Influencer Campaign App Rating growth from 4.5 to 4.8 Growing our user base 11 Growing our user base is the foundation of our strategy: more members drive paying circles, ads and pets, on our path to 150M MAU • Improving our funnel: Android performance and battery optimization, Google Sign-in and new safety features like Live Progress help more new registrations become active members • Local-market conversion: Local influencers, distribution partnerships, press and app store optimization; MAU in the UK, Australia, New Zealand and Canada grew 24% • AI monetization engine: Routes each new member to the most relevant feature or offer, lifting engagement and conversion • Scaling paid: Recent U.S. price change is seeing good conversion to paid and solid uptake of higher tiers Google Sign-in Improving our funnel and conversion in local markets drove one of our best MAU quarters ever
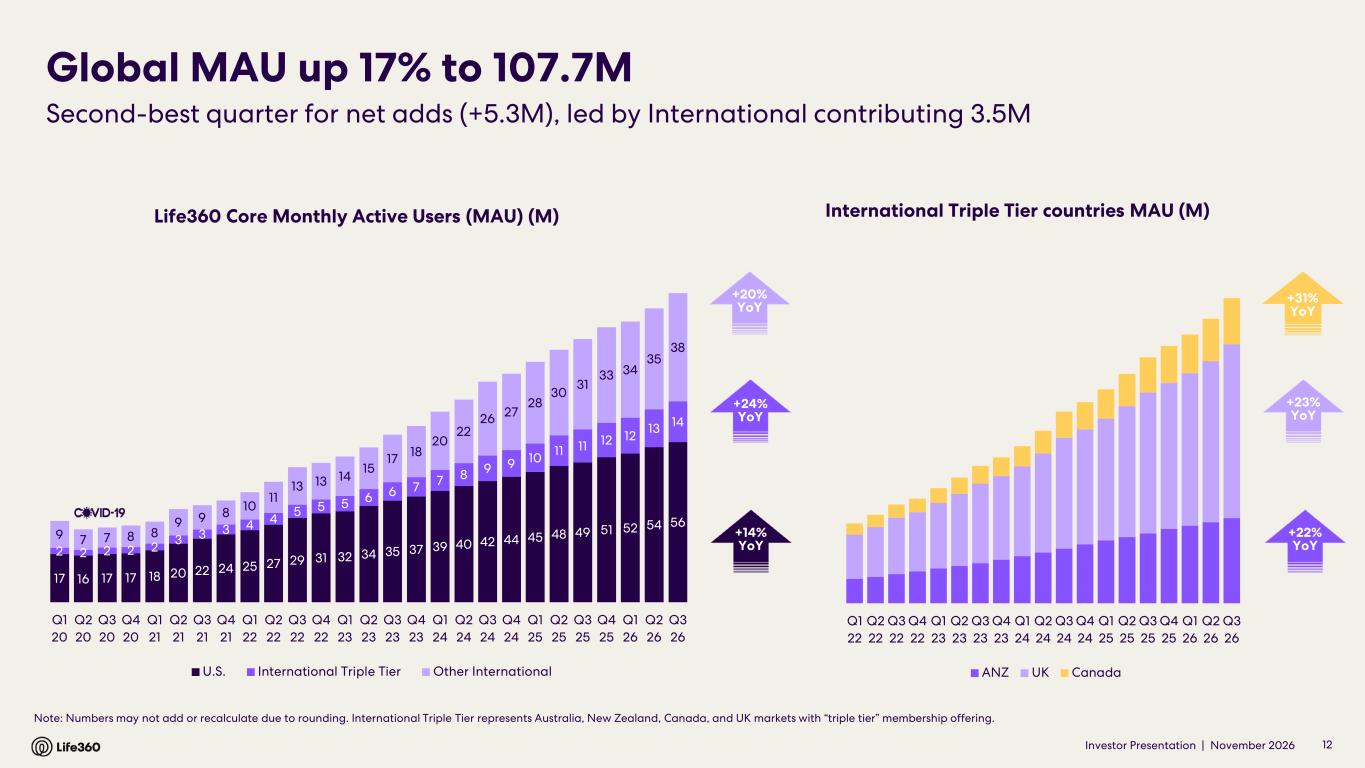
Investor Presentation | November 2026 Life360 Core Monthly Active Users (MAU) (M) Note: Numbers may not add or recalculate due to rounding. International Triple Tier represents Australia, New Zealand, Canada, and UK markets with “triple tier” membership offering. Global MAU up 17% to 107.7M Second-best quarter for net adds (+5.3M), led by International contributing 3.5M International Triple Tier countries MAU (M) +23% YoY +24% YoY +14% YoY +22% YoY 12 +31% YoY +20% YoY 17 16 17 17 18 20 22 24 25 27 29 31 32 34 35 37 39 40 42 44 45 48 49 51 52 54 56 2 2 2 2 2 3 3 3 4 4 5 5 5 6 6 7 7 8 9 9 10 11 11 12 12 13 14 9 7 7 8 8 9 9 8 10 11 13 13 14 15 17 18 20 22 26 27 28 30 31 33 34 35 38 Q1 20 Q2 20 Q3 20 Q4 20 Q1 21 Q2 21 Q3 21 Q4 21 Q1 22 Q2 22 Q3 22 Q4 22 Q1 23 Q2 23 Q3 23 Q4 23 Q1 24 Q2 24 Q3 24 Q4 24 Q1 25 Q2 25 Q3 25 Q4 25 Q1 26 Q2 26 Q3 26 U.S. International Triple Tier Other International Q1 22 Q2 22 Q3 22 Q4 22 Q1 23 Q2 23 Q3 23 Q4 23 Q1 24 Q2 24 Q3 24 Q4 24 Q1 25 Q2 25 Q3 25 Q4 25 Q1 26 Q2 26 Q3 26 ANZ UK Canada
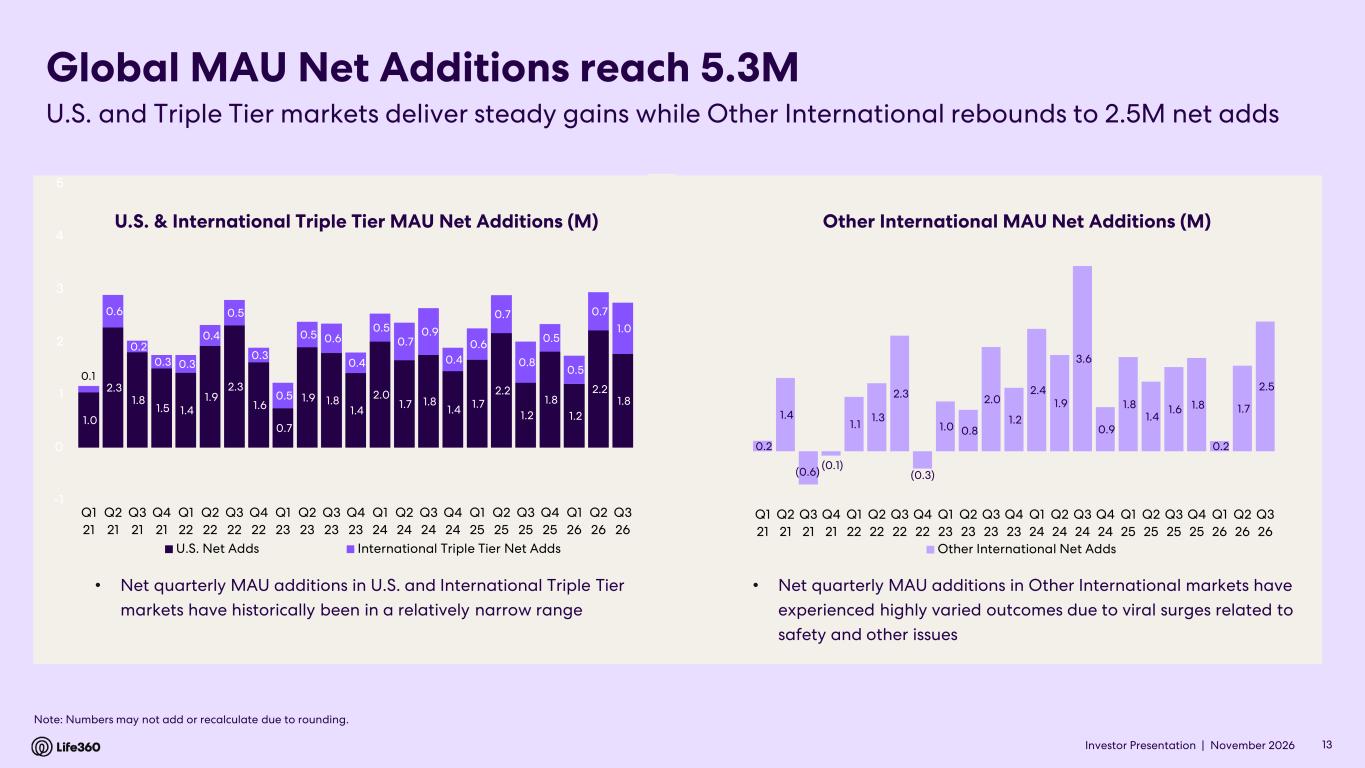
Investor Presentation | November 2026 1.0 2.3 1.8 1.5 1.4 1.9 2.3 1.6 0.7 1.9 1.8 1.4 2.0 1.7 1.8 1.4 1.7 2.2 1.2 1.8 1.2 2.2 1.8 0.1 0.6 0.2 0.3 0.3 0.4 0.5 0.3 0.5 0.5 0.6 0.4 0.5 0.7 0.9 0.4 0.6 0.7 0.8 0.5 0.5 0.7 1.0 (80) (60) (40) (20) - 20 40 60 80 100 -1 0 1 2 3 4 5 Q1 21 Q2 21 Q3 21 Q4 21 Q1 22 Q2 22 Q3 22 Q4 22 Q1 23 Q2 23 Q3 23 Q4 23 Q1 24 Q2 24 Q3 24 Q4 24 Q1 25 Q2 25 Q3 25 Q4 25 Q1 26 Q2 26 Q3 26 U.S. Net Adds International Triple Tier Net Adds 0.2 1.4 (0.6) (0.1) 1.1 1.3 2.3 (0.3) 1.0 0.8 2.0 1.2 2.4 1.9 3.6 0.9 1.8 1.4 1.6 1.8 0.2 1.7 2.5 (80) (60) (40) (20) - 20 40 60 80 100 -1 0 1 2 3 4 5 Q1 21 Q2 21 Q3 21 Q4 21 Q1 22 Q2 22 Q3 22 Q4 22 Q1 23 Q2 23 Q3 23 Q4 23 Q1 24 Q2 24 Q3 24 Q4 24 Q1 25 Q2 25 Q3 25 Q4 25 Q1 26 Q2 26 Q3 26 Other International Net Adds Global MAU Net Additions reach 5.3M • Net quarterly MAU additions in U.S. and International Triple Tier markets have historically been in a relatively narrow range 13 Note: Numbers may not add or recalculate due to rounding. U.S. and Triple Tier markets deliver steady gains while Other International rebounds to 2.5M net adds • Net quarterly MAU additions in Other International markets have experienced highly varied outcomes due to viral surges related to safety and other issues Other International MAU Net Additions (M) U.S. & International Triple Tier MAU Net Additions (M)
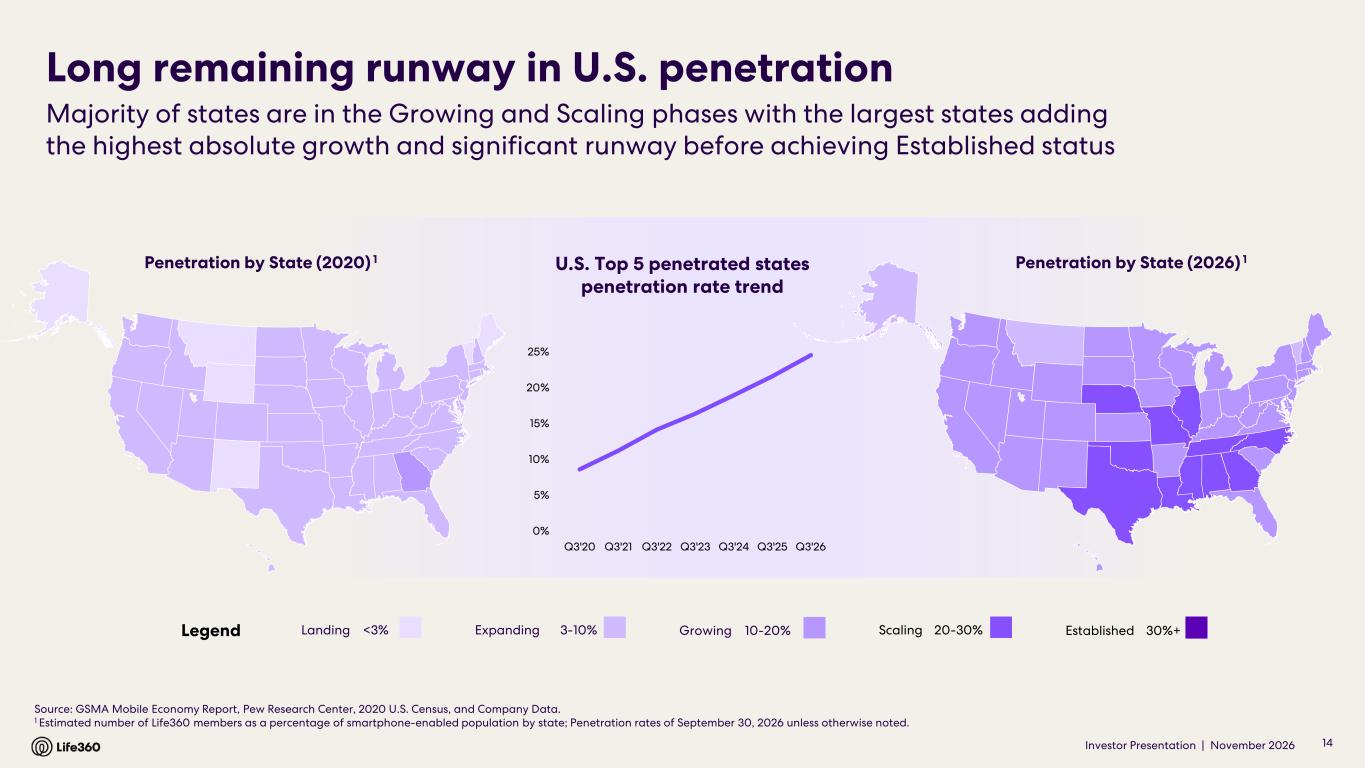
Investor Presentation | November 2026 Long remaining runway in U.S. penetration Source: GSMA Mobile Economy Report, Pew Research Center, 2020 U.S. Census, and Company Data. 1 Estimated number of Life360 members as a percentage of smartphone-enabled population by state; Penetration rates of September 30, 2026 unless otherwise noted. Penetration by State (2020) 1 Penetration by State (2026) 1 Landing <3% Majority of states are in the Growing and Scaling phases with the largest states adding the highest absolute growth and significant runway before achieving Established status 14 U.S. Top 5 penetrated states penetration rate trend Legend Expanding 3-10% Growing 10-20% Scaling 20-30% Established 30%+ 0% 5% 10% 15% 20% 25% Q3'20 Q3'21 Q3'22 Q3'23 Q3'24 Q3'25 Q3'26
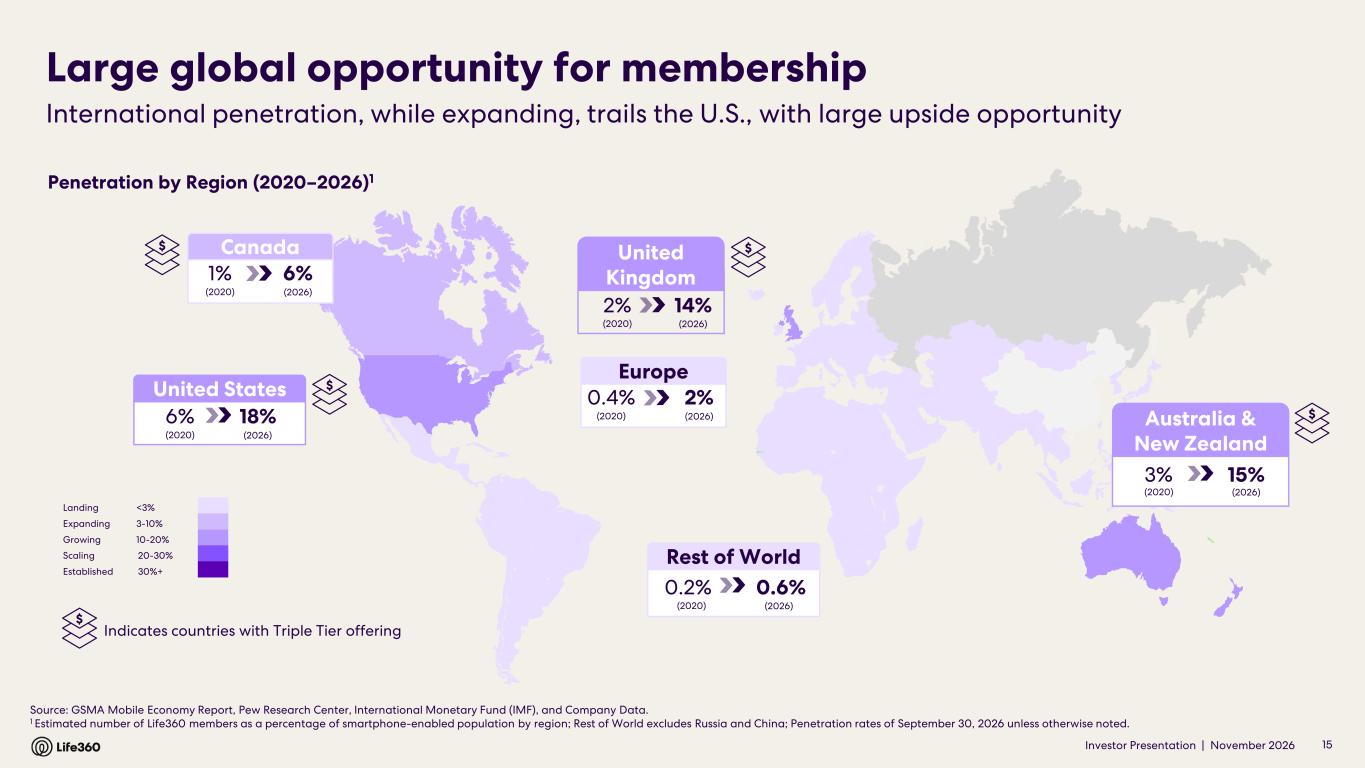
Investor Presentation | November 2026 Europe 2%0.4% (2020) (2026) Source: GSMA Mobile Economy Report, Pew Research Center, International Monetary Fund (IMF), and Company Data. 1 Estimated number of Life360 members as a percentage of smartphone-enabled population by region; Rest of World excludes Russia and China; Penetration rates of September 30, 2026 unless otherwise noted. Rest of World 0.6%0.2% (2020) (2026) International penetration, while expanding, trails the U.S., with large upside opportunity Large global opportunity for membership Penetration by Region (2020–2026)1 15 United Kingdom 14%2% (2020) (2026) $ Indicates countries with Triple Tier offering United States 18%6% (2020) (2026) Landing <3% Expanding 3-10% Growing 10-20% Scaling 20-30% Established 30%+ Australia & New Zealand 15%3% (2020) (2026) Canada 6%1% (2020) (2026) $ $ $ $
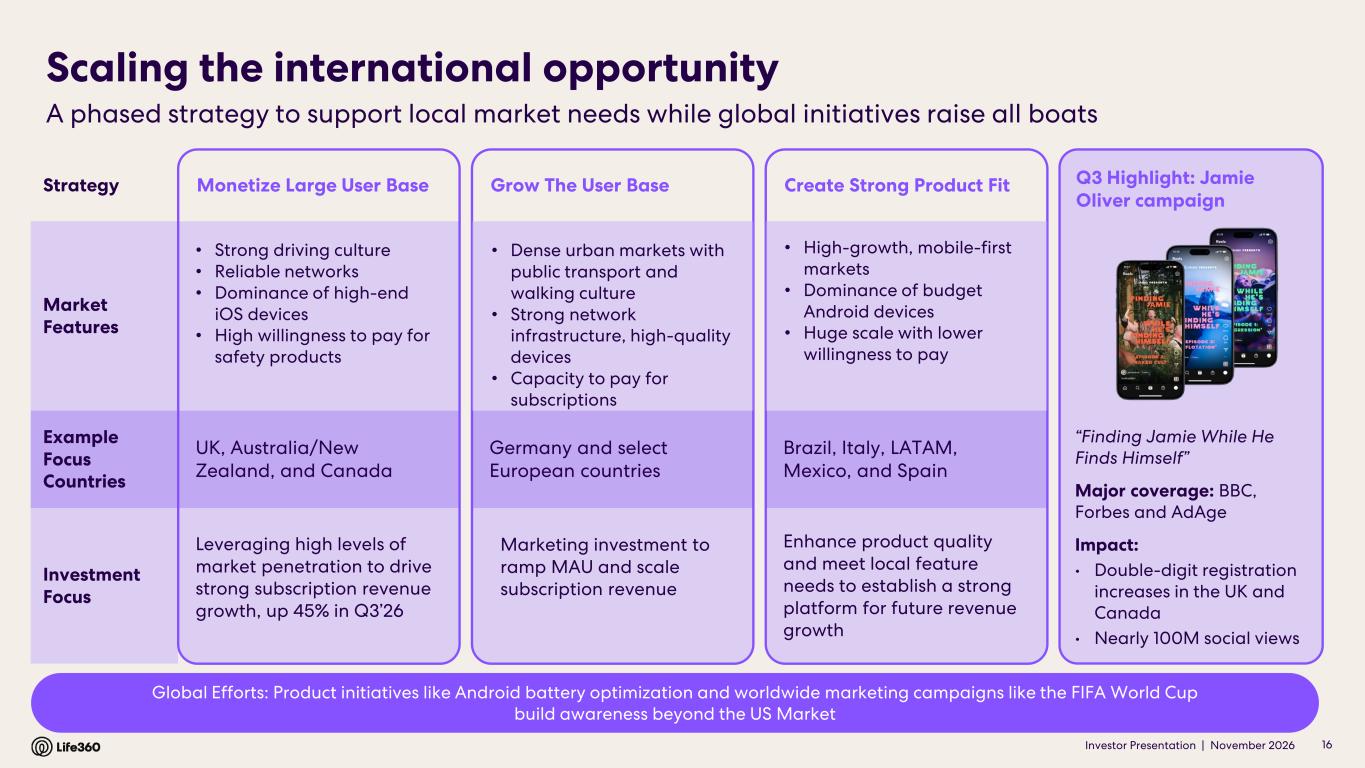
Investor Presentation | November 2026 Monetize Large User Base Create Strong Product Fit Scaling the international opportunity Brazil, Italy, LATAM, Mexico, and Spain • High-growth, mobile-first markets • Dominance of budget Android devices • Huge scale with lower willingness to pay A phased strategy to support local market needs while global initiatives raise all boats Strategy Market Features Example Focus Countries Investment Focus • Strong driving culture • Reliable networks • Dominance of high-end iOS devices • High willingness to pay for safety products • Dense urban markets with public transport and walking culture • Strong network infrastructure, high-quality devices • Capacity to pay for subscriptions UK, Australia/New Zealand, and Canada Q3 Highlight: Jamie Oliver campaign “Finding Jamie While He Finds Himself” Major coverage: BBC, Forbes and AdAge Impact: • Double-digit registration increases in the UK and Canada • Nearly 100M social views Enhance product quality and meet local feature needs to establish a strong platform for future revenue growth Grow The User Base Germany and select European countries Marketing investment to ramp MAU and scale subscription revenue Leveraging high levels of market penetration to drive strong subscription revenue growth, up 45% in Q3’26 16 Global Efforts: Product initiatives like Android battery optimization and worldwide marketing campaigns like the FIFA World Cup build awareness beyond the US Market
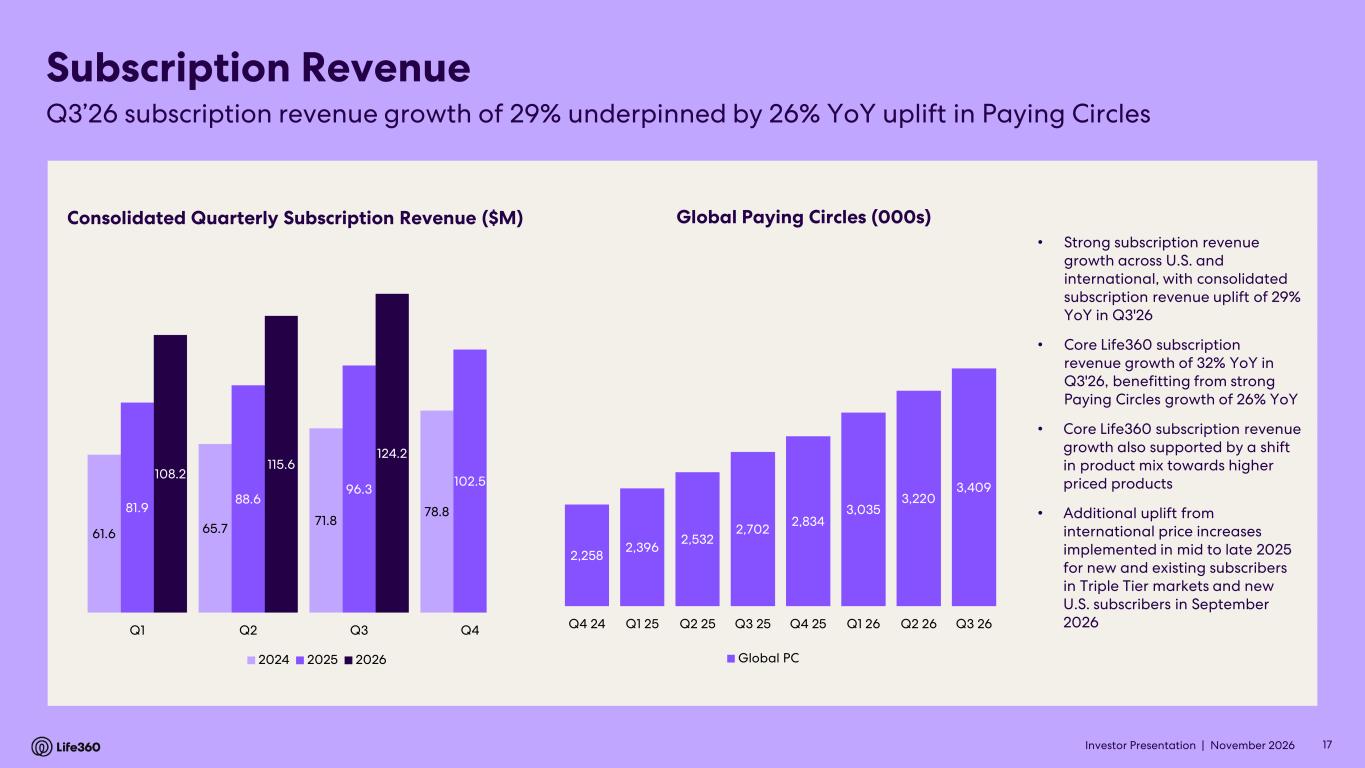
Investor Presentation | November 2026 17 Consolidated Quarterly Subscription Revenue ($M) Global Paying Circles (000s) Subscription Revenue Q3’26 subscription revenue growth of 29% underpinned by 26% YoY uplift in Paying Circles • Strong subscription revenue growth across U.S. and international, with consolidated subscription revenue uplift of 29% YoY in Q3'26 • Core Life360 subscription revenue growth of 32% YoY in Q3'26, benefitting from strong Paying Circles growth of 26% YoY • Core Life360 subscription revenue growth also supported by a shift in product mix towards higher priced products • Additional uplift from international price increases implemented in mid to late 2025 for new and existing subscribers in Triple Tier markets and new U.S. subscribers in September 2026 61.6 65.7 71.8 78.881.9 88.6 96.3 102.5108.2 115.6 124.2 Q1 Q2 Q3 Q4 2024 2025 2026 2,258 2,396 2,532 2,702 2,834 3,035 3,220 3,409 1,400 1,900 2,400 2,900 3,400 3,900 Q4 24 Q1 25 Q2 25 Q3 25 Q4 25 Q1 26 Q2 26 Q3 26 Global PC
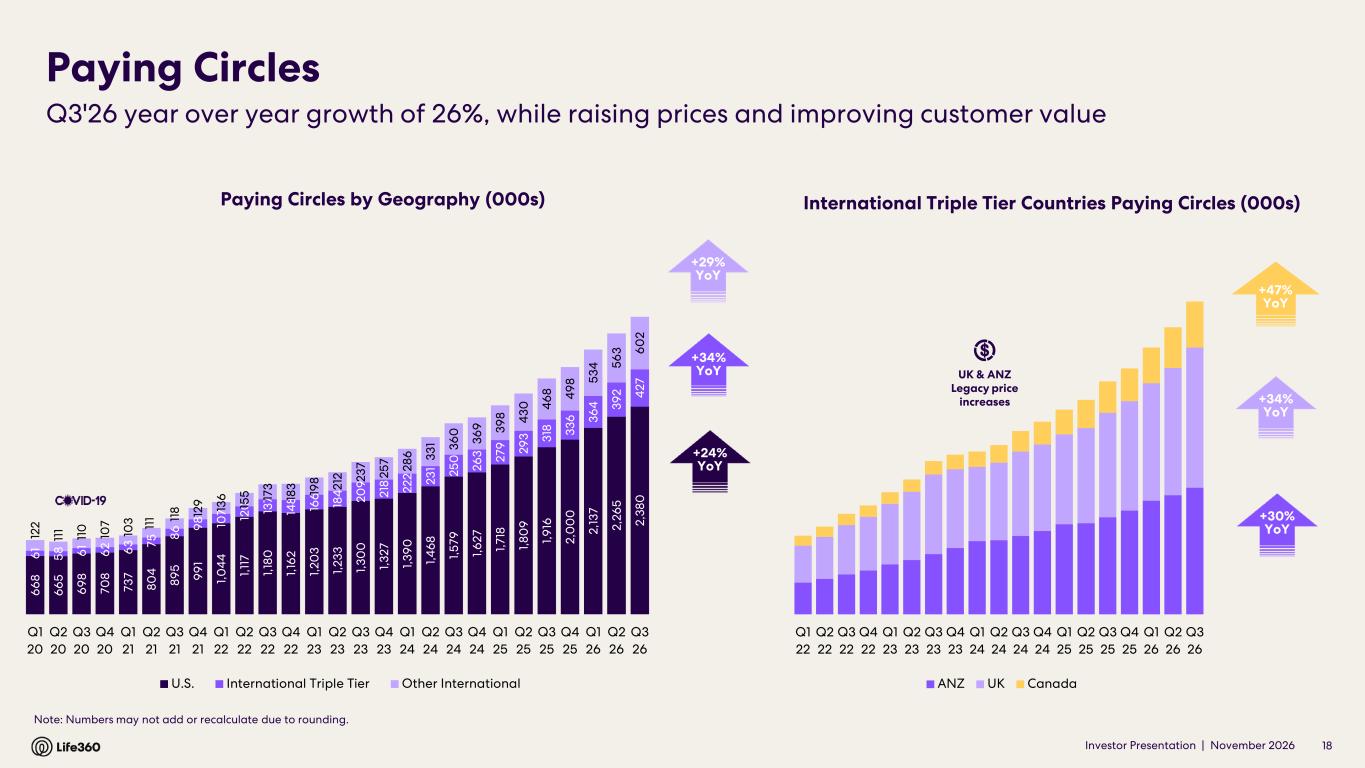
Investor Presentation | November 2026 Paying Circles by Geography (000s) Paying Circles International Triple Tier Countries Paying Circles (000s) +34% YoY +30% YoY +23% YoY 18 Note: Numbers may not add or recalculate due to rounding. Q3'26 year over year growth of 26%, while raising prices and improving customer value +47% YoY +34% YoY +24% YoY +29% YoY 6 6 8 6 6 5 6 9 8 70 8 73 7 80 4 89 5 9 9 1 1, 0 4 4 1, 11 7 1, 18 0 1, 16 2 1, 20 3 1, 23 3 1, 30 0 1, 32 7 1, 39 0 1, 4 6 8 1, 57 9 1, 6 27 1, 71 8 1, 80 9 1, 9 16 2, 0 0 0 2, 13 7 2, 26 5 2, 38 0 6 1 58 6 1 6 2 6 3 75 86 9 8 10 7 12 0 13 7 14 8 16 6 18 4 20 9 21 8 22 2 23 1 25 0 26 3 27 9 29 3 31 8 33 6 36 4 39 2 4 27 12 2 11 1 11 0 10 7 10 3 11 1 11 8 12 9 13 6 15 5 17 3 18 3 19 8 21 2 23 7 25 7 28 6 33 1 36 0 36 9 39 8 4 30 4 6 8 4 9 8 53 4 56 3 6 0 2 Q1 20 Q2 20 Q3 20 Q4 20 Q1 21 Q2 21 Q3 21 Q4 21 Q1 22 Q2 22 Q3 22 Q4 22 Q1 23 Q2 23 Q3 23 Q4 23 Q1 24 Q2 24 Q3 24 Q4 24 Q1 25 Q2 25 Q3 25 Q4 25 Q1 26 Q2 26 Q3 26 U.S. International Triple Tier Other International Q1 22 Q2 22 Q3 22 Q4 22 Q1 23 Q2 23 Q3 23 Q4 23 Q1 24 Q2 24 Q3 24 Q4 24 Q1 25 Q2 25 Q3 25 Q4 25 Q1 26 Q2 26 Q3 26 ANZ UK Canada UK & ANZ Legacy price increases
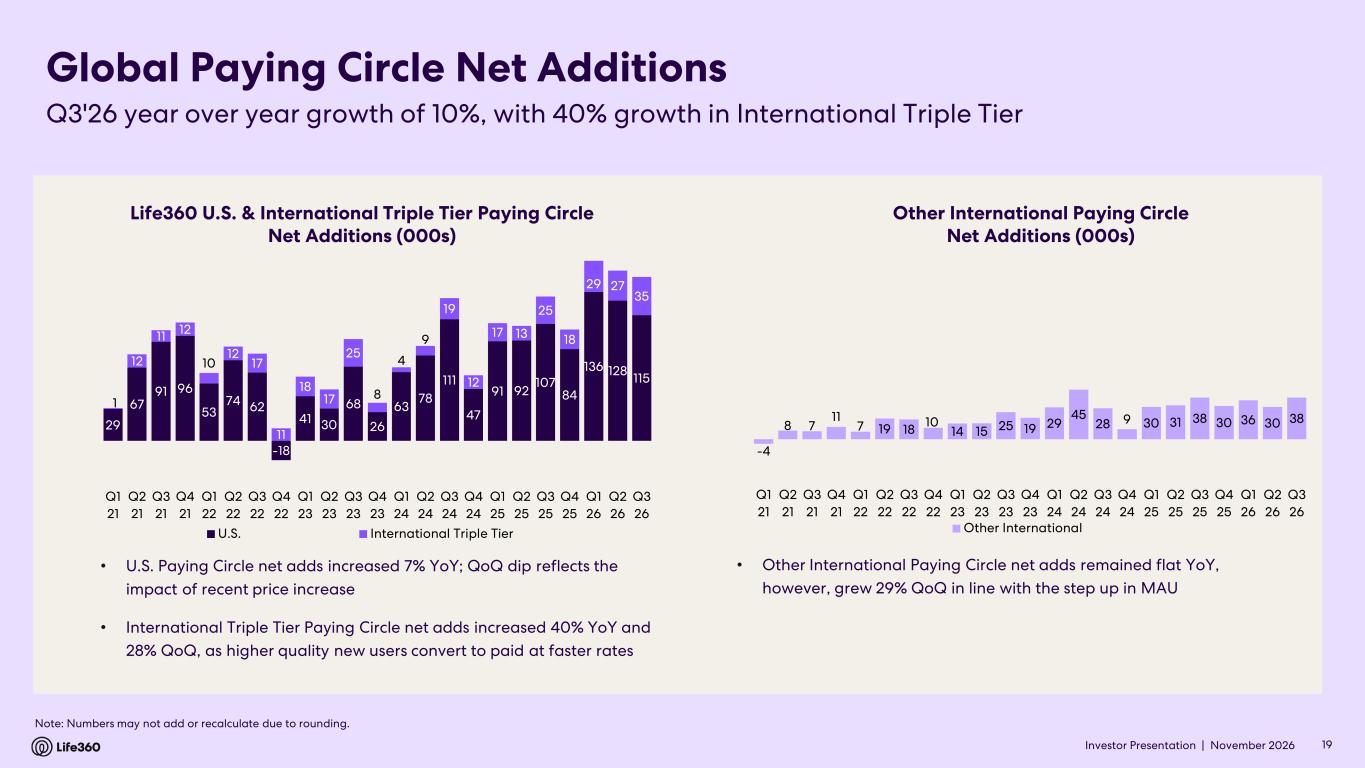
Investor Presentation | November 2026 Global Paying Circle Net Additions 19 Note: Numbers may not add or recalculate due to rounding. Q3'26 year over year growth of 10%, with 40% growth in International Triple Tier Life360 U.S. & International Triple Tier Paying Circle Net Additions (000s) Other International Paying Circle Net Additions (000s) • U.S. Paying Circle net adds increased 7% YoY; QoQ dip reflects the impact of recent price increase • International Triple Tier Paying Circle net adds increased 40% YoY and 28% QoQ, as higher quality new users convert to paid at faster rates • Other International Paying Circle net adds remained flat YoY, however, grew 29% QoQ in line with the step up in MAU 29 67 91 96 53 74 62 -18 41 30 68 26 63 78 111 47 91 92 107 84 136 128 115 1 12 11 12 10 12 17 11 18 17 25 8 4 9 19 12 17 13 25 18 29 27 35 -40 -20 0 20 40 60 80 100 120 140 160 180 Q1 21 Q2 21 Q3 21 Q4 21 Q1 22 Q2 22 Q3 22 Q4 22 Q1 23 Q2 23 Q3 23 Q4 23 Q1 24 Q2 24 Q3 24 Q4 24 Q1 25 Q2 25 Q3 25 Q4 25 Q1 26 Q2 26 Q3 26 U.S. International Triple Tier -4 8 7 11 7 19 18 10 14 15 25 19 29 45 28 9 30 31 38 30 36 30 38 -40 10 60 110 160 Q1 21 Q2 21 Q3 21 Q4 21 Q1 22 Q2 22 Q3 22 Q4 22 Q1 23 Q2 23 Q3 23 Q4 23 Q1 24 Q2 24 Q3 24 Q4 24 Q1 25 Q2 25 Q3 25 Q4 25 Q1 26 Q2 26 Q3 26 Other International
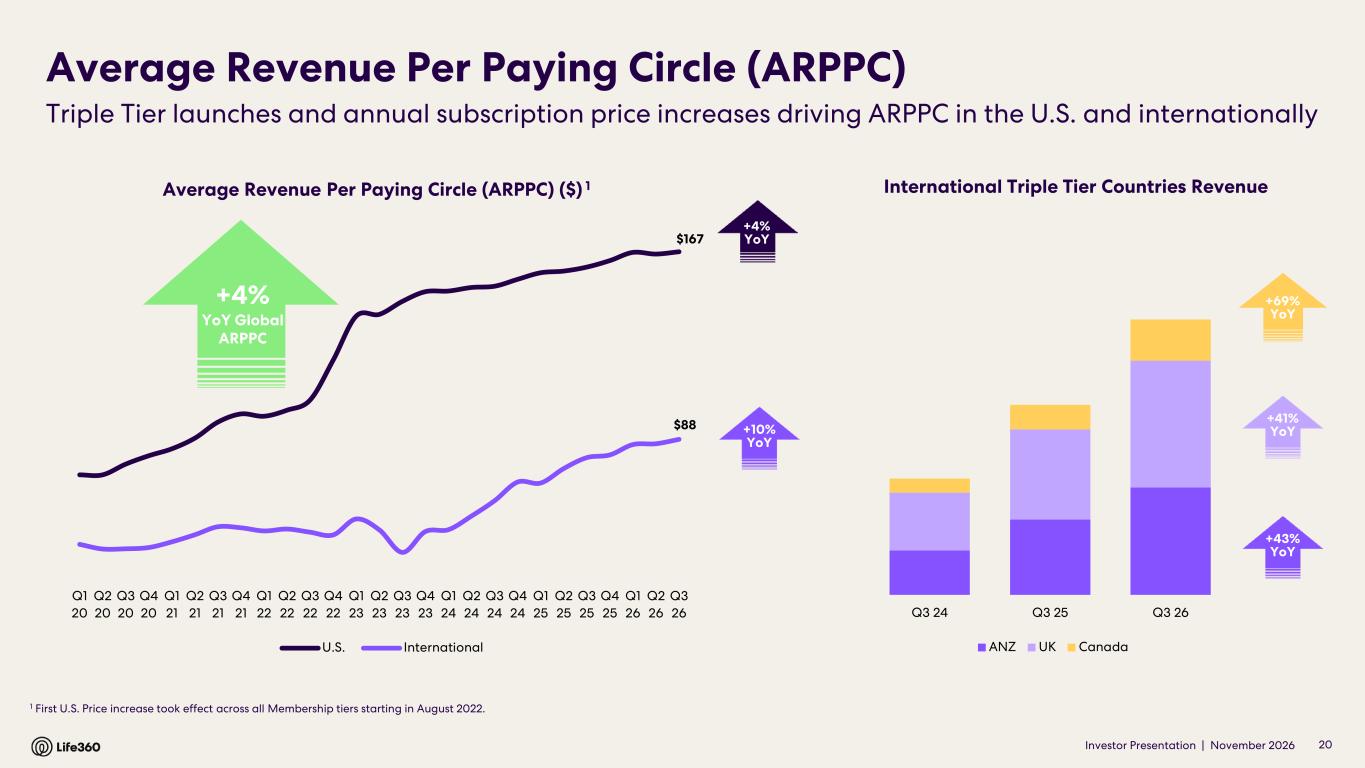
Investor Presentation | November 2026 $167 $88 Q1 20 Q2 20 Q3 20 Q4 20 Q1 21 Q2 21 Q3 21 Q4 21 Q1 22 Q2 22 Q3 22 Q4 22 Q1 23 Q2 23 Q3 23 Q4 23 Q1 24 Q2 24 Q3 24 Q4 24 Q1 25 Q2 25 Q3 25 Q4 25 Q1 26 Q2 26 Q3 26 U.S. International Average Revenue Per Paying Circle (ARPPC) 1 First U.S. Price increase took effect across all Membership tiers starting in August 2022. Average Revenue Per Paying Circle (ARPPC) ($) 1 +4% YoY 20 +10% YoY +41% YoY +43% YoY Triple Tier launches and annual subscription price increases driving ARPPC in the U.S. and internationally International Triple Tier Countries Revenue +69% YoY +4% YoY Global ARPPC Q3 24 Q3 25 Q3 26 ANZ UK Canada
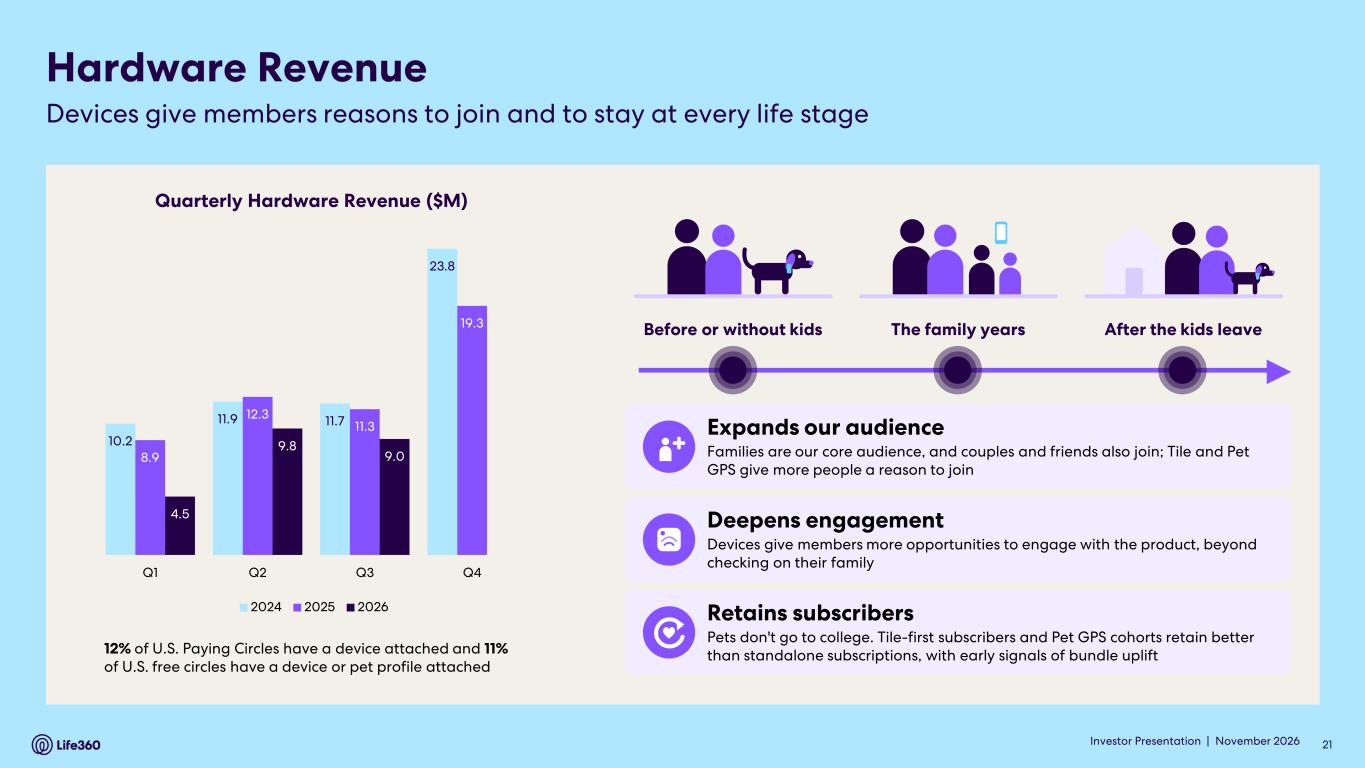
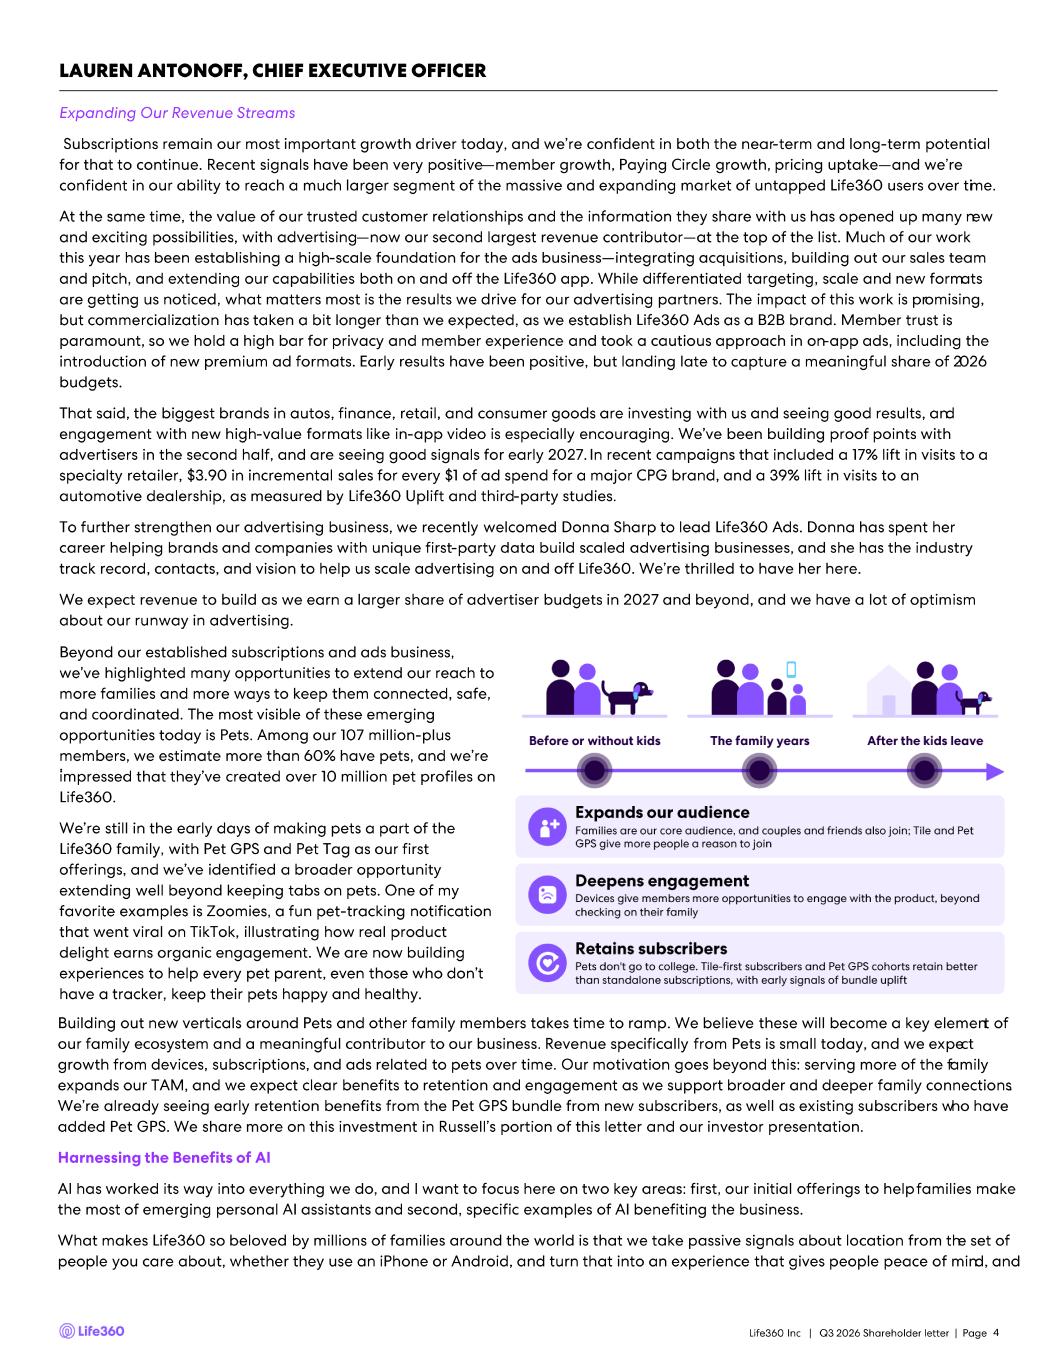
Hardware Revenue Devices give members reasons to join and to stay at every life stage Quarterly Hardware Revenue ($M) 10.2 11.9 11.7 23.8 8.9 12.3 11.3 19.3 4.5 9.8 9.0 Q1 Q2 Q3 Q4 2024 2025 2026 Investor Presentation | November 2026 21 12% of U.S. Paying Circles have a device attached and 11% of U.S. free circles have a device or pet profile attached Before or without kids The family years After the kids leave Expands our audience Families are our core audience, and couples and friends also join; Tile and Pet GPS give more people a reason to join Deepens engagement Devices give members more opportunities to engage with the product, beyond checking on their family Retains subscribers Pets don't go to college. Tile-first subscribers and Pet GPS cohorts retain better than standalone subscriptions, with early signals of bundle uplift
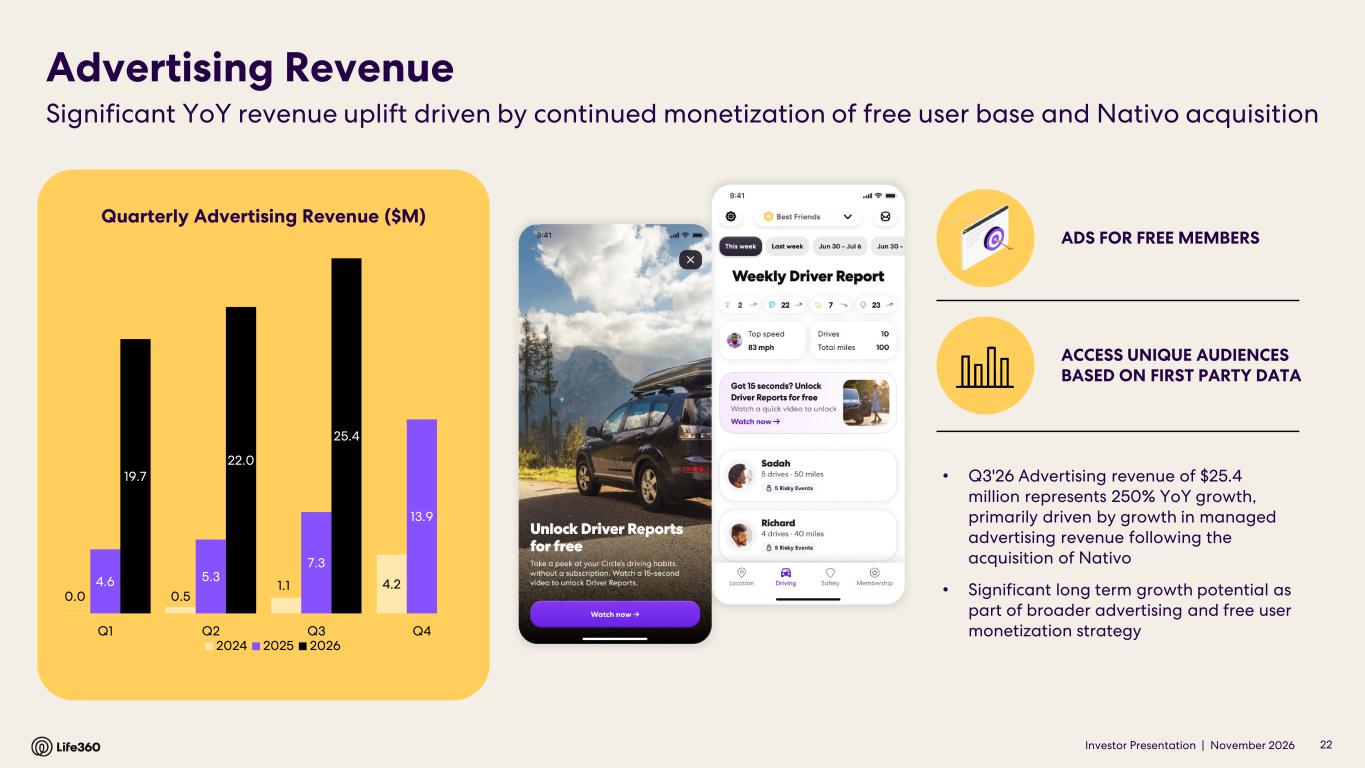
Investor Presentation | November 2026 0.0 0.5 1.1 4.24.6 5.3 7.3 13.9 19.7 22.0 25.4 Q1 Q2 Q3 Q4 2024 2025 2026 Quarterly Advertising Revenue ($M) Advertising Revenue Significant YoY revenue uplift driven by continued monetization of free user base and Nativo acquisition • Q3'26 Advertising revenue of $25.4 million represents 250% YoY growth, primarily driven by growth in managed advertising revenue following the acquisition of Nativo • Significant long term growth potential as part of broader advertising and free user monetization strategy 22 ADS FOR FREE MEMBERS ACCESS UNIQUE AUDIENCES BASED ON FIRST PARTY DATA
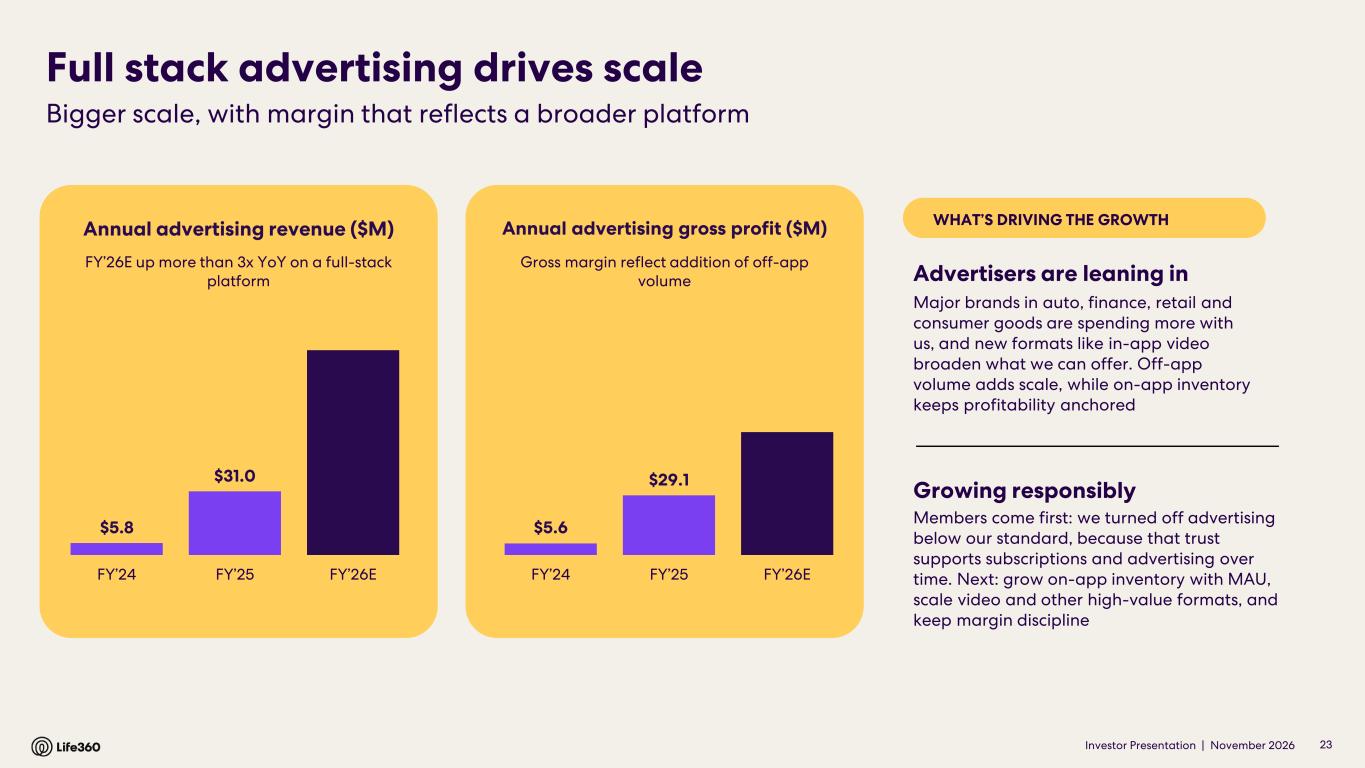
Investor Presentation | November 2026 23 WHAT’S DRIVING THE GROWTH Advertisers are leaning in Major brands in auto, finance, retail and consumer goods are spending more with us, and new formats like in-app video broaden what we can offer. Off-app volume adds scale, while on-app inventory keeps profitability anchored Growing responsibly Members come first: we turned off advertising below our standard, because that trust supports subscriptions and advertising over time. Next: grow on-app inventory with MAU, scale video and other high-value formats, and keep margin discipline Annual advertising revenue ($M) FY’26E up more than 3x YoY on a full-stack platform $5.8 FY’24 $31.0 FY’25 FY’26E Annual advertising gross profit ($M) Gross margin reflect addition of off-app volume $5.6 FY’24 $29.1 FY’25 FY’26E Full stack advertising drives scale Bigger scale, with margin that reflects a broader platform
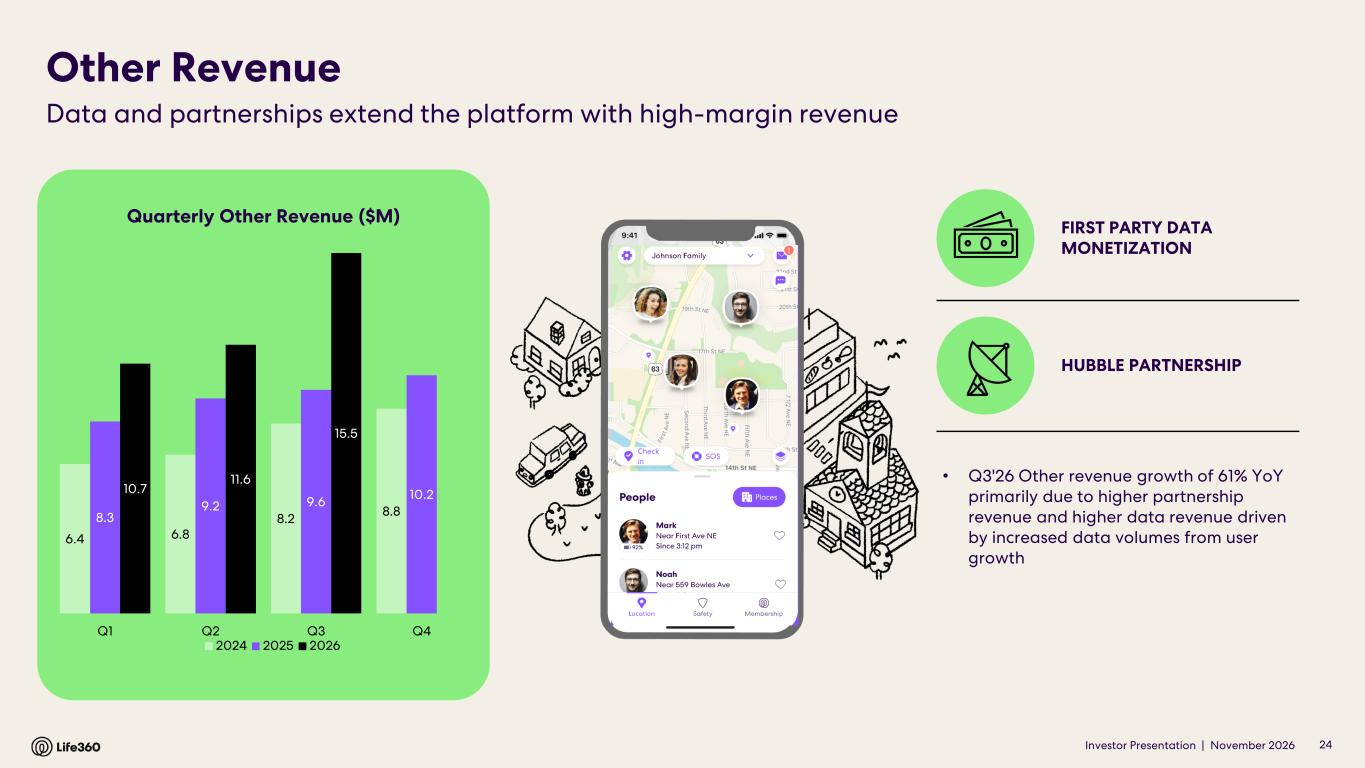
Investor Presentation | November 2026 6.4 6.8 8.2 8.88.3 9.2 9.6 10.210.7 11.6 15.5 Q1 Q2 Q3 Q4 2024 2025 2026 Other Revenue Data and partnerships extend the platform with high-margin revenue 24 Quarterly Other Revenue ($M) • Q3'26 Other revenue growth of 61% YoY primarily due to higher partnership revenue and higher data revenue driven by increased data volumes from user growth FIRST PARTY DATA MONETIZATION HUBBLE PARTNERSHIP

04 Q3’26 AI Highlights I N V E S T O R U P D A T E 02 | FINANCIAL PERFORMANCE 05 | OUTLOOK 06 | APPENDIX04 | AI HIGHLIGHTS01 | HIGHLIGHTS 03 | OPERATIONAL PERFORMANCE
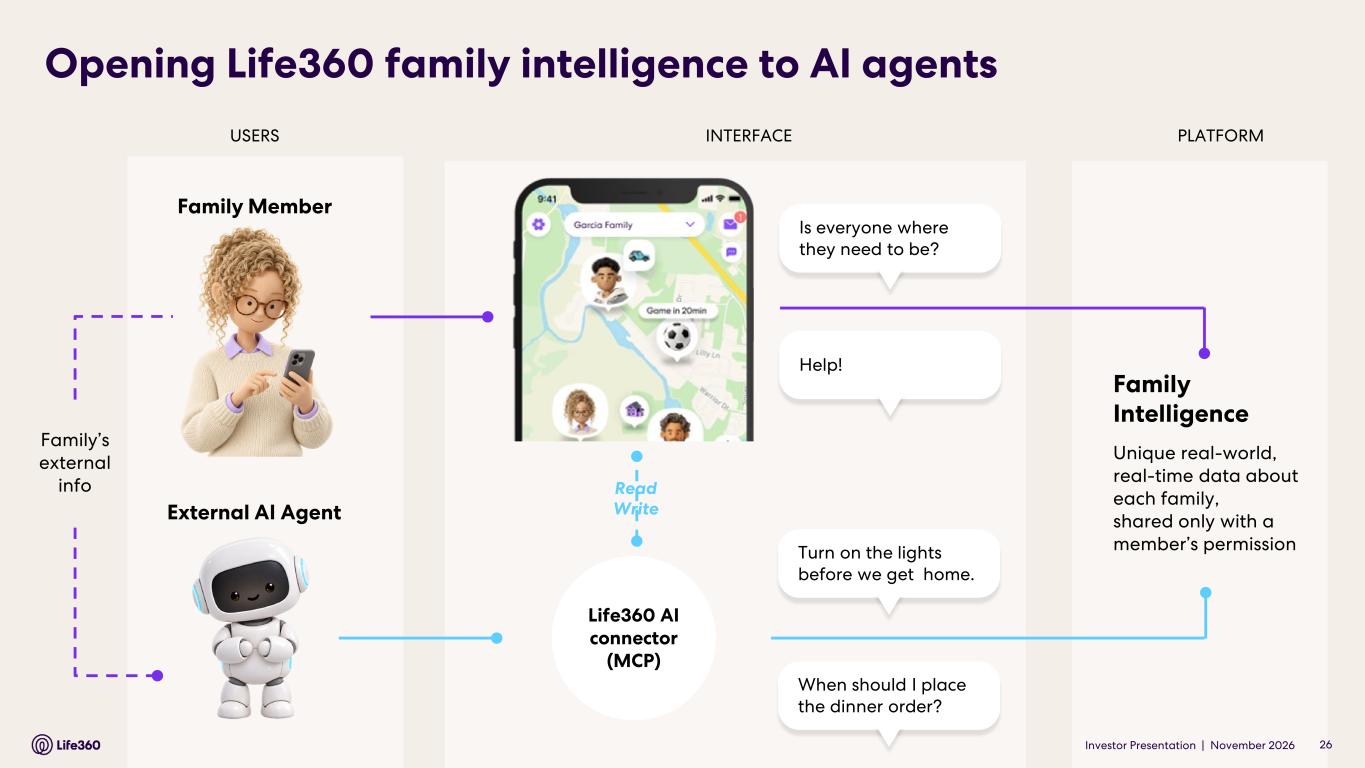
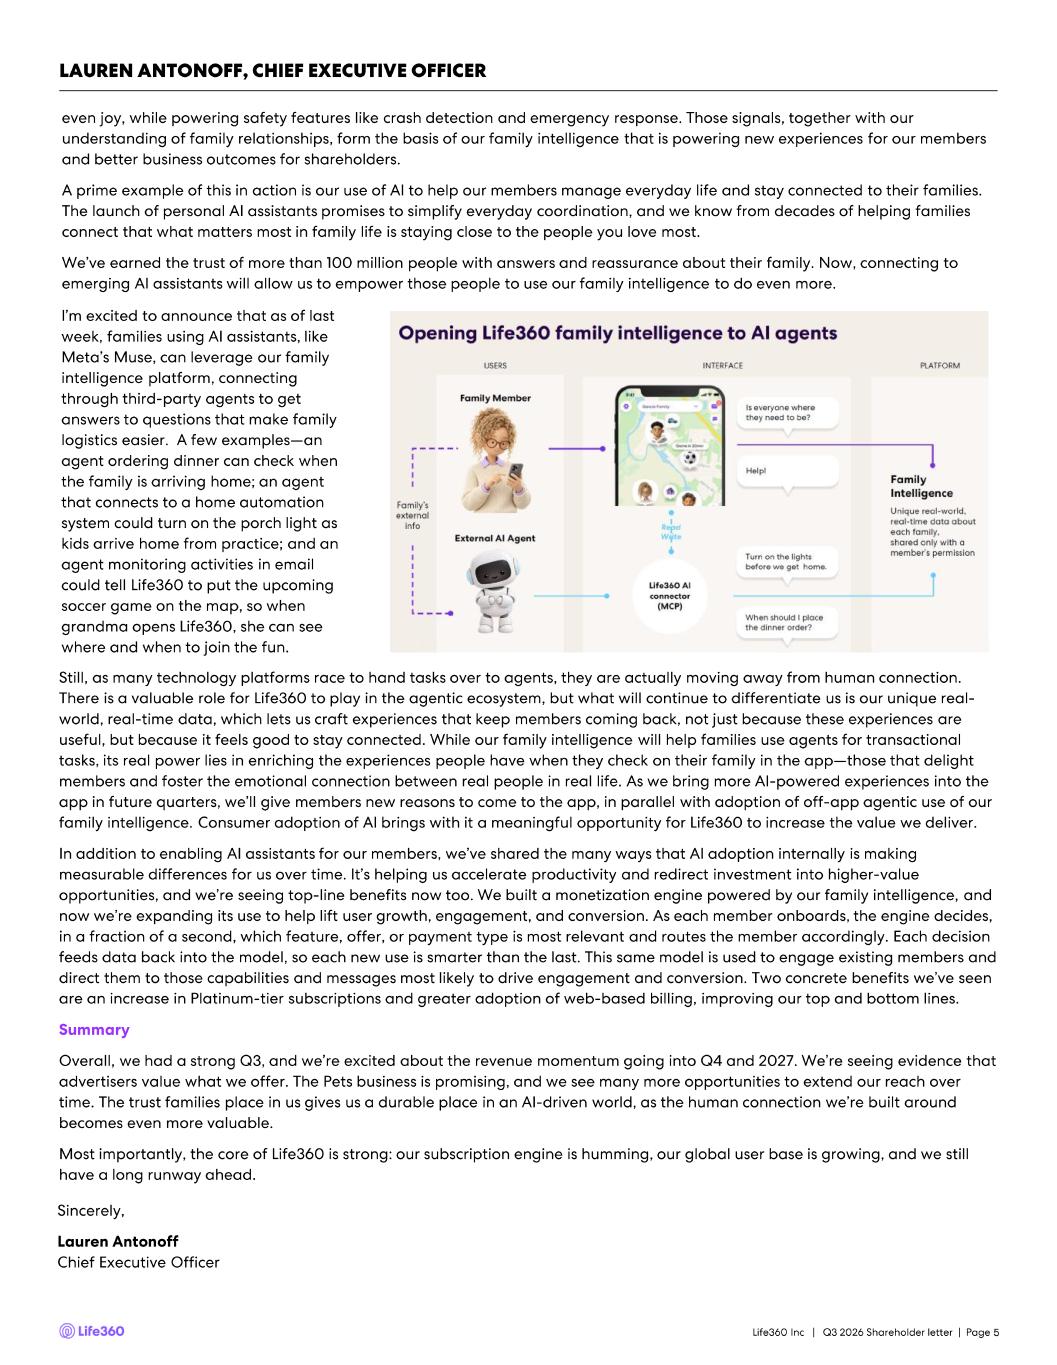
Opening Life360 family intelligence to AI agents External AI Agent Family Member Life360 AI connector (MCP) When should I place the dinner order? Turn on the lights before we get home. Help! Is everyone where they need to be? Family Intelligence Unique real-world, real-time data about each family, shared only with a member’s permission USERS INTERFACE PLATFORM Family’s external info Read Write Investor Presentation | November 2026 26
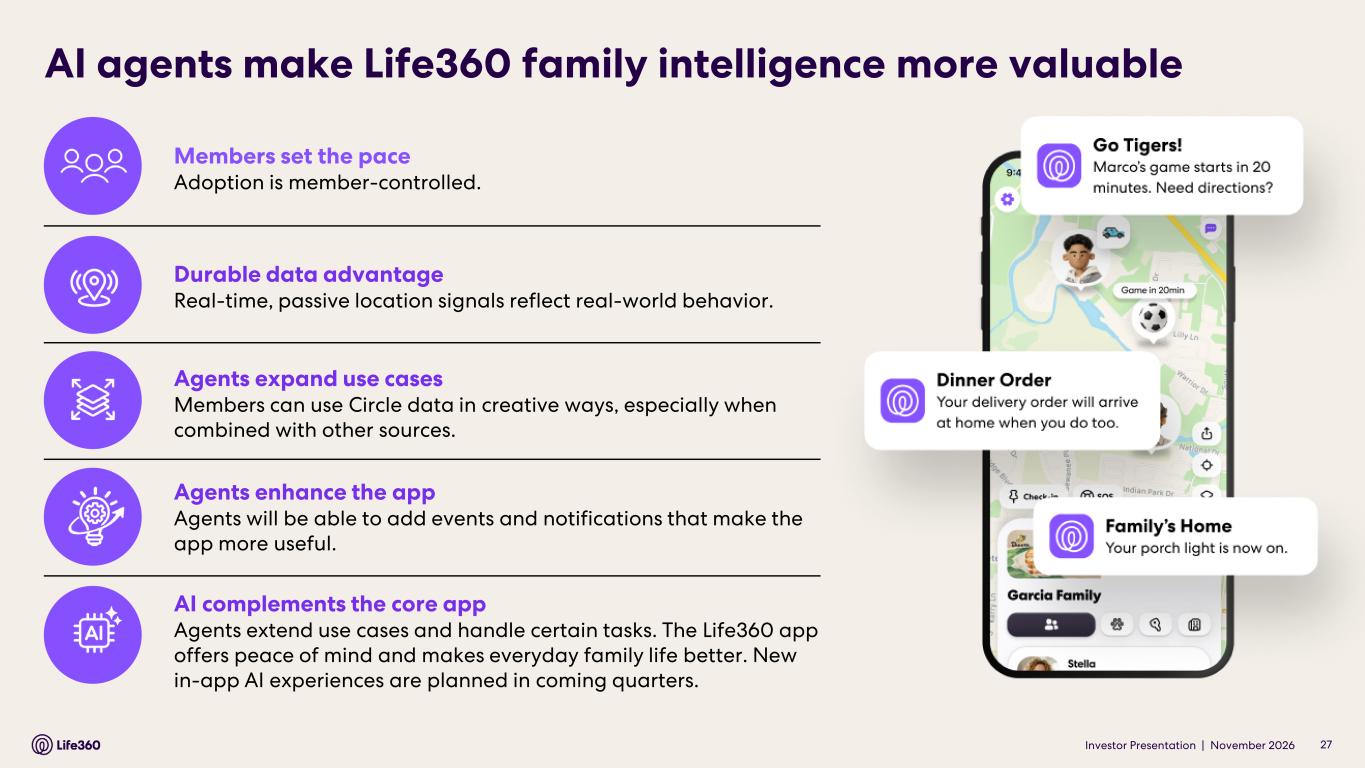
AI agents make Life360 family intelligence more valuable Investor Presentation | November 2026 27 Members set the pace Adoption is member-controlled. Durable data advantage Real-time, passive location signals reflect real-world behavior. Agents expand use cases Members can use Circle data in creative ways, especially when combined with other sources. Agents enhance the app Agents will be able to add events and notifications that make the app more useful. AI complements the core app Agents extend use cases and handle certain tasks. The Life360 app offers peace of mind and makes everyday family life better. New in-app AI experiences are planned in coming quarters.
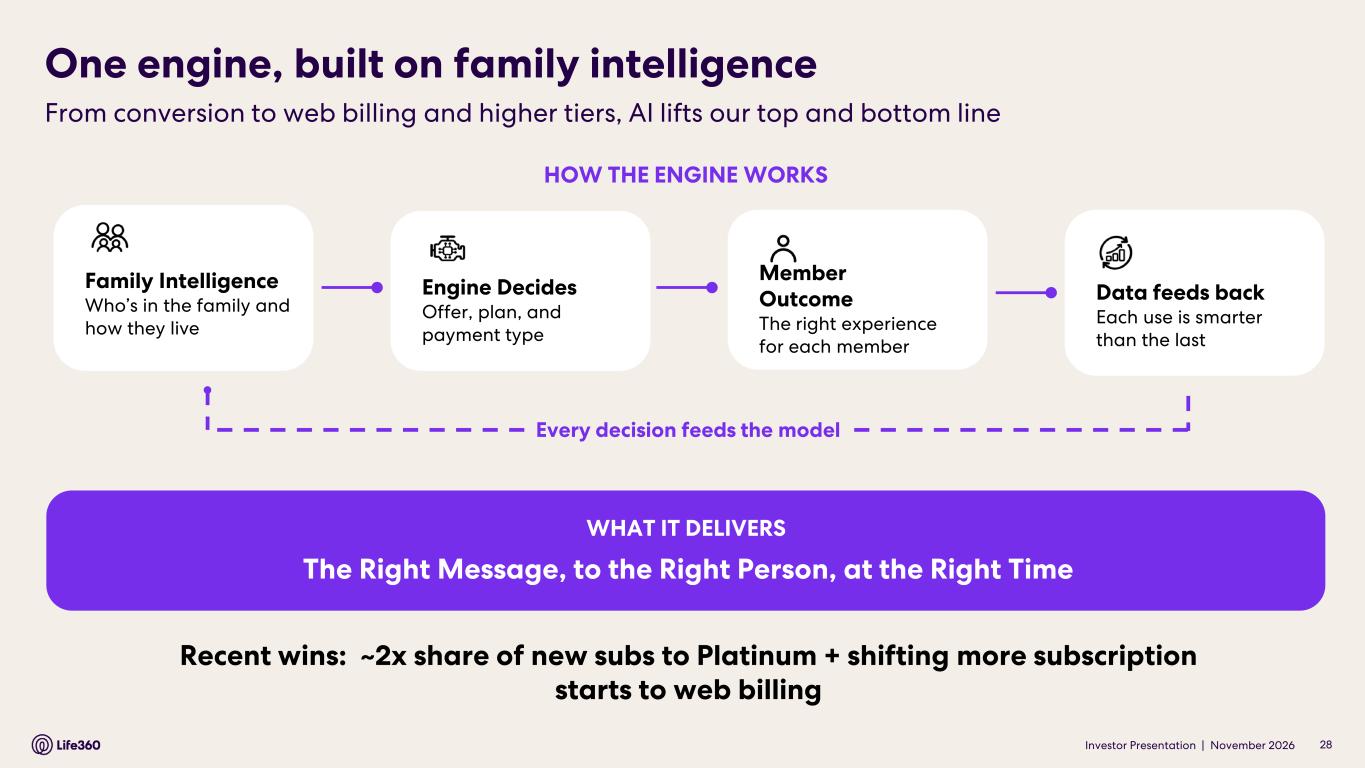
One engine, built on family intelligence From conversion to web billing and higher tiers, AI lifts our top and bottom line HOW THE ENGINE WORKS WEB BILLLING MARGIN WHAT IT DELIVERS Family Intelligence Who’s in the family and how they live The Right Message, to the Right Person, at the Right Time Every decision feeds the model Engine Decides Offer, plan, and payment type Member Outcome The right experience for each member Data feeds back Each use is smarter than the last Recent wins: ~2x share of new subs to Platinum + shifting more subscription starts to web billing Investor Presentation | November 2026 28

02 | FINANCIAL PERFORMANCE 03 | OPERATIONAL PERFORMANCE 05 | OUTLOOK 06 | APPENDIX04 | AI HIGHLIGHTS01 | HIGHLIGHTS
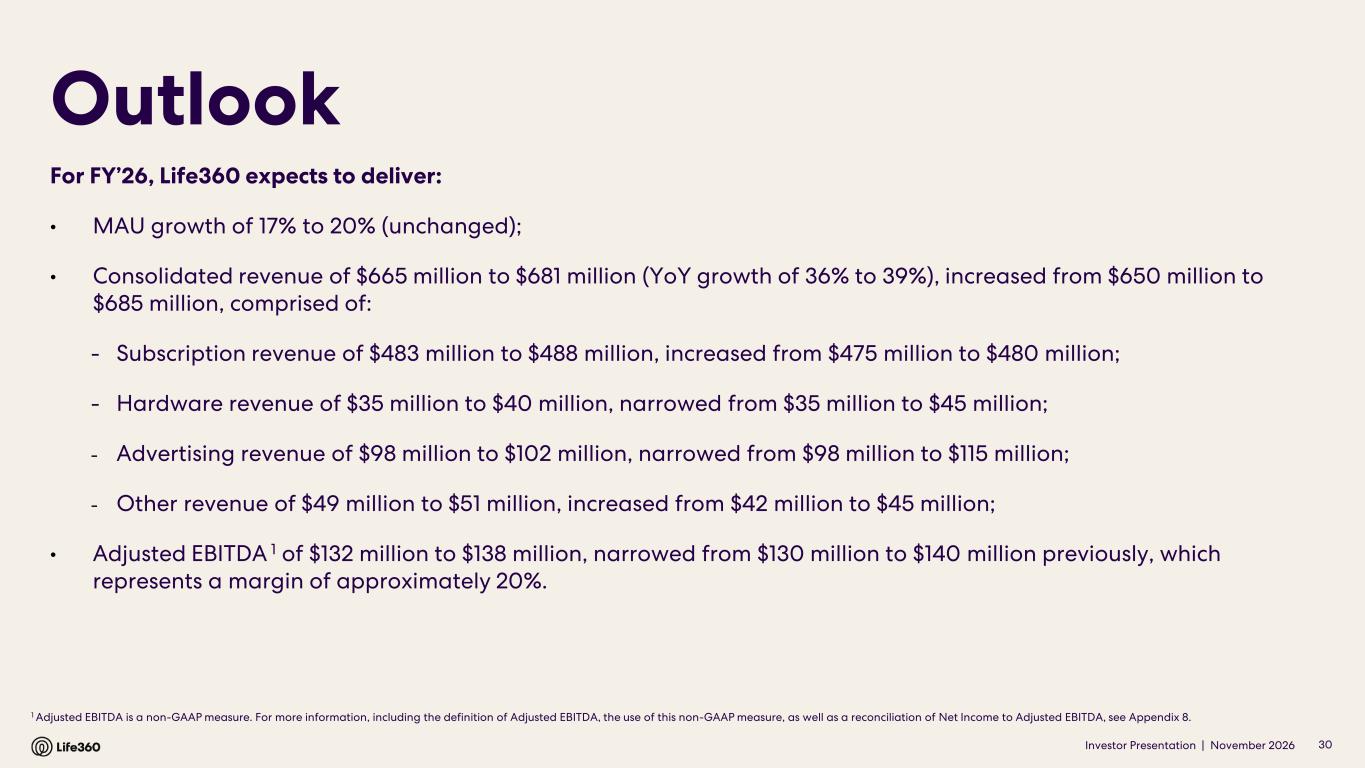
Investor Presentation | November 2026 1 Adjusted EBITDA is a non-GAAP measure. For more information, including the definition of Adjusted EBITDA, the use of this non-GAAP measure, as well as a reconciliation of Net Income to Adjusted EBITDA, see Appendix 8. Outlook 30 For FY’26, Life360 expects to deliver: • MAU growth of 17% to 20% (unchanged); • Consolidated revenue of $665 million to $681 million (YoY growth of 36% to 39%), increased from $650 million to $685 million, comprised of: - Subscription revenue of $483 million to $488 million, increased from $475 million to $480 million; - Hardware revenue of $35 million to $40 million, narrowed from $35 million to $45 million; - Advertising revenue of $98 million to $102 million, narrowed from $98 million to $115 million; - Other revenue of $49 million to $51 million, increased from $42 million to $45 million; • Adjusted EBITDA 1 of $132 million to $138 million, narrowed from $130 million to $140 million previously, which represents a margin of approximately 20%.

Investor Presentation | November 2026 06 Appendix I N V E S T O R U P D A T E 02 | FINANCIAL PERFORMANCE 03 | OPERATIONAL PERFORMANCE 05 | OUTLOOK 06 | APPENDIX04 | AI HIGHLIGHTS01 | HIGHLIGHTS
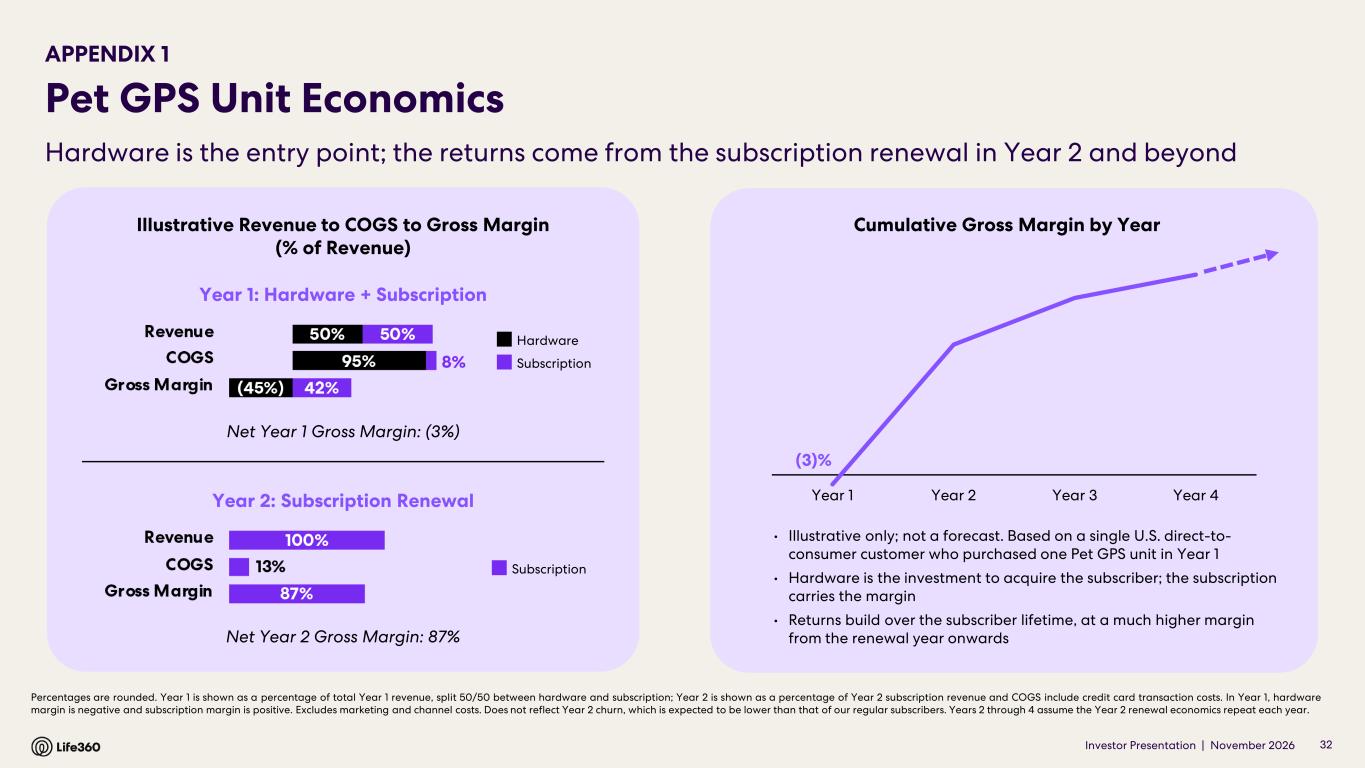
Investor Presentation | November 2026 Pet GPS Unit Economics Hardware is the entry point; the returns come from the subscription renewal in Year 2 and beyond APPENDIX 1 Percentages are rounded. Year 1 is shown as a percentage of total Year 1 revenue, split 50/50 between hardware and subscription; Year 2 is shown as a percentage of Year 2 subscription revenue and COGS include credit card transaction costs. In Year 1, hardware margin is negative and subscription margin is positive. Excludes marketing and channel costs. Does not reflect Year 2 churn, which is expected to be lower than that of our regular subscribers. Years 2 through 4 assume the Year 2 renewal economics repeat each year. Illustrative Revenue to COGS to Gross Margin (% of Revenue) Year 1: Hardware + Subscription Year 2: Subscription Renewal Hardware Subscription Net Year 1 Gross Margin: (3%) Net Year 2 Gross Margin: 87% 32 Cumulative Gross Margin by Year Year 1 Year 2 Year 3 Year 4 • Illustrative only; not a forecast. Based on a single U.S. direct-to- consumer customer who purchased one Pet GPS unit in Year 1 • Hardware is the investment to acquire the subscriber; the subscription carries the margin • Returns build over the subscriber lifetime, at a much higher margin from the renewal year onwards (3)% Subscription
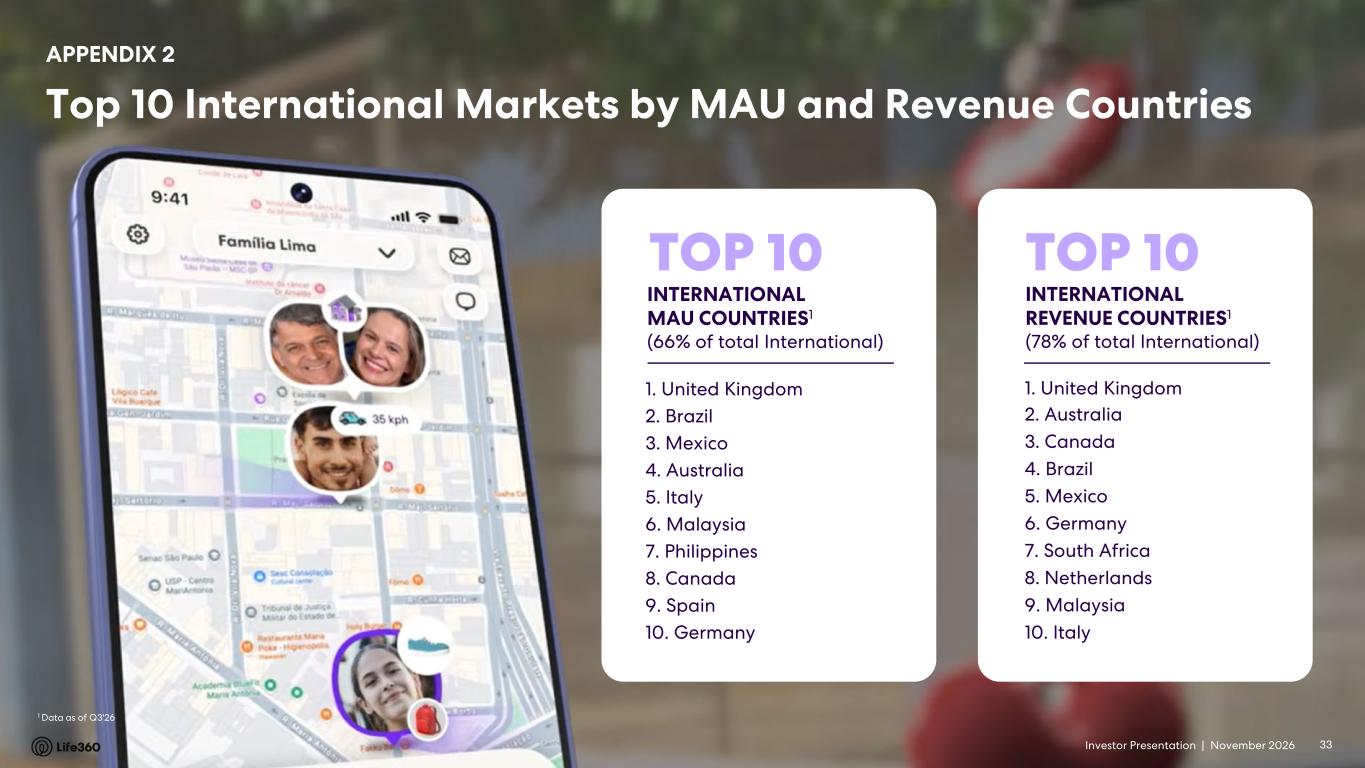
Investor Presentation | November 2026 TOP 10 1 Data as of Q3'26 33 TOP 10 APPENDIX 2 Top 10 International Markets by MAU and Revenue Countries 1. United Kingdom 2. Brazil 3. Mexico 4. Australia 5. Italy 6. Malaysia 7. Philippines 8. Canada 9. Spain 10. Germany 1. United Kingdom 2. Australia 3. Canada 4. Brazil 5. Mexico 6. Germany 7. South Africa 8. Netherlands 9. Malaysia 10. Italy INTERNATIONAL REVENUE COUNTRIES1 (78% of total International) INTERNATIONAL MAU COUNTRIES1 (66% of total International)
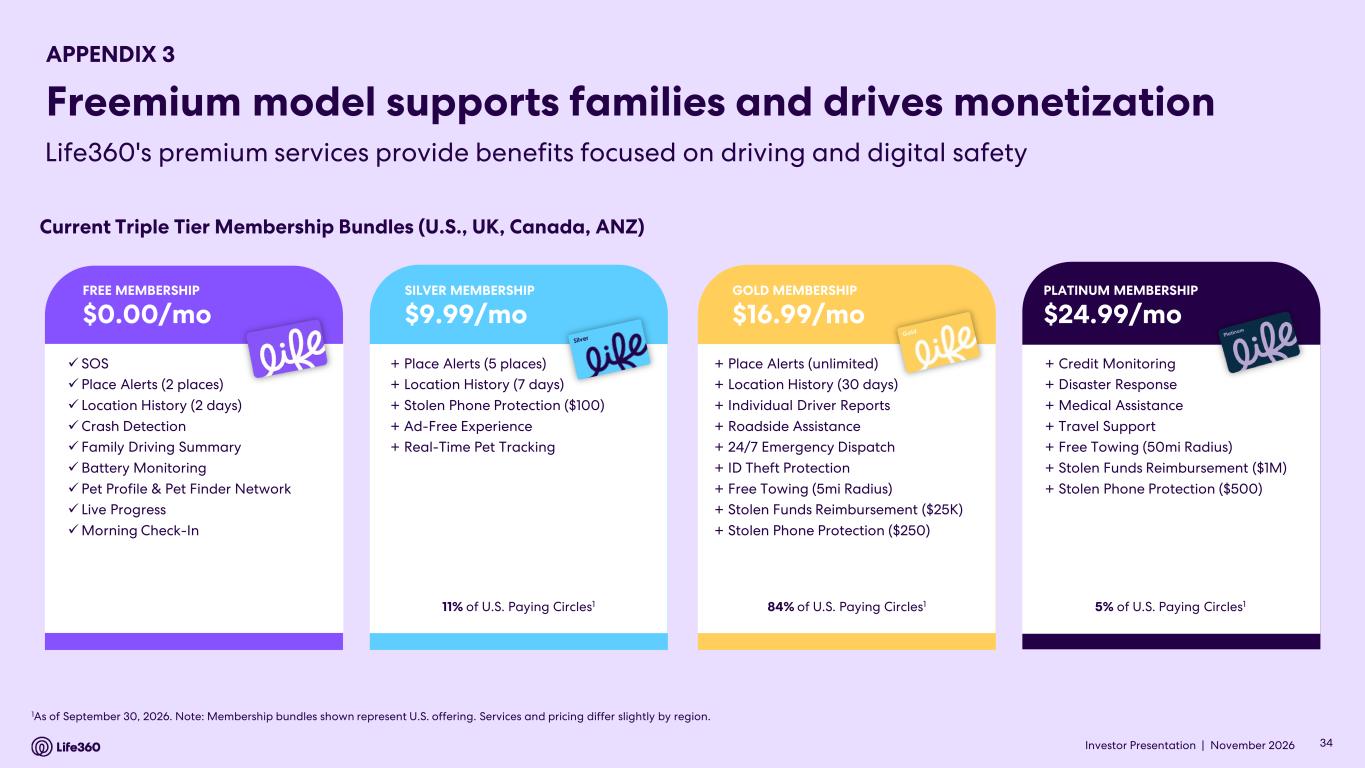
Investor Presentation | November 2026 1As of September 30, 2026. Note: Membership bundles shown represent U.S. offering. Services and pricing differ slightly by region. Current Triple Tier Membership Bundles (U.S., UK, Canada, ANZ) + Place Alerts (5 places) + Location History (7 days) + Stolen Phone Protection ($100) + Ad-Free Experience + Real-Time Pet Tracking 11% of U.S. Paying Circles1 SILVER MEMBERSHIP $9.99/mo + Place Alerts (unlimited) + Location History (30 days) + Individual Driver Reports + Roadside Assistance + 24/7 Emergency Dispatch + ID Theft Protection + Free Towing (5mi Radius) + Stolen Funds Reimbursement ($25K) + Stolen Phone Protection ($250) 84% of U.S. Paying Circles1 GOLD MEMBERSHIP $16.99/mo + Credit Monitoring + Disaster Response + Medical Assistance + Travel Support + Free Towing (50mi Radius) + Stolen Funds Reimbursement ($1M) + Stolen Phone Protection ($500) 5% of U.S. Paying Circles1 PLATINUM MEMBERSHIP $24.99/mo SOS Place Alerts (2 places) Location History (2 days) Crash Detection Family Driving Summary Battery Monitoring Pet Profile & Pet Finder Network Live Progress Morning Check-In FREE MEMBERSHIP $0.00/mo 34 APPENDIX 3 Life360's premium services provide benefits focused on driving and digital safety Freemium model supports families and drives monetization
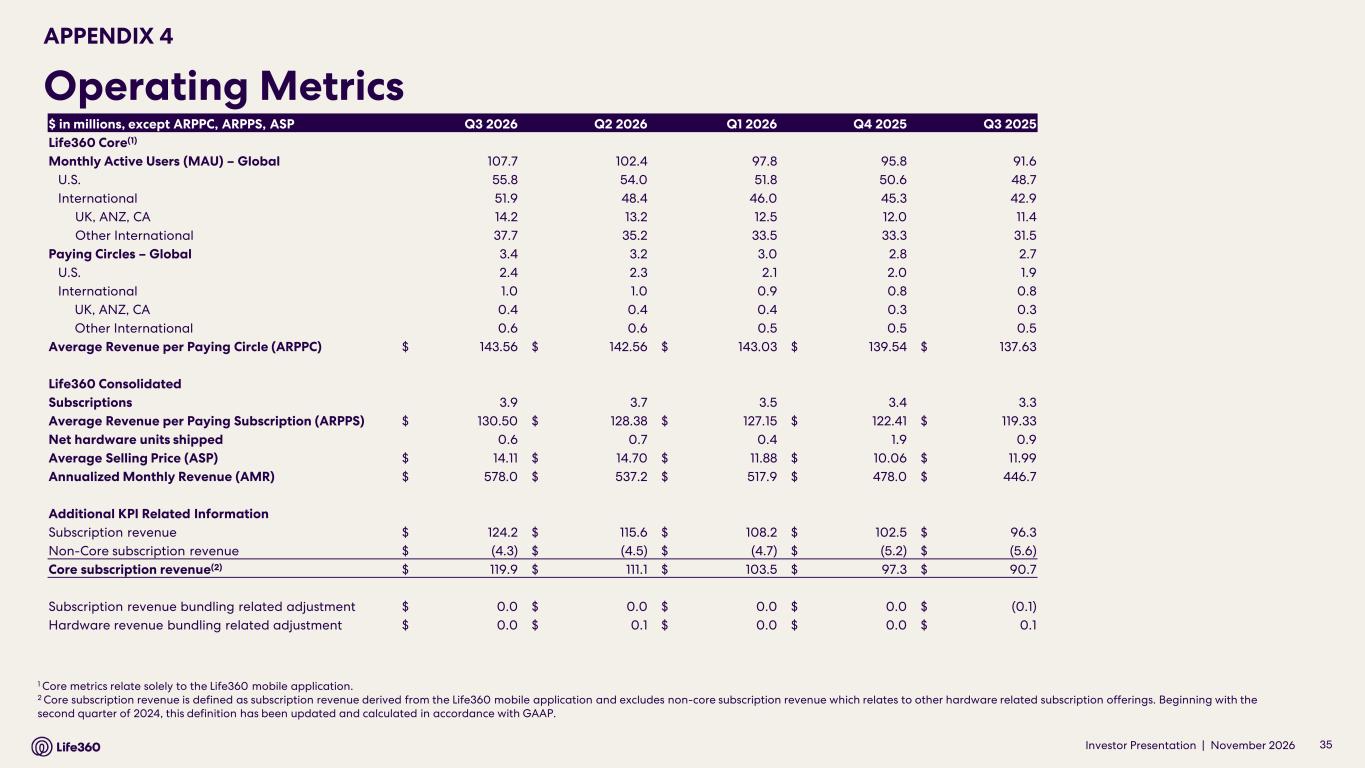
Investor Presentation | November 2026 APPENDIX 4 Operating Metrics 1 Core metrics relate solely to the Life360 mobile application. 2 Core subscription revenue is defined as subscription revenue derived from the Life360 mobile application and excludes non-core subscription revenue which relates to other hardware related subscription offerings. Beginning with the second quarter of 2024, this definition has been updated and calculated in accordance with GAAP. 35 $ in millions, except ARPPC, ARPPS, ASP Q3 2026 Q2 2026 Q1 2026 Q4 2025 Q3 2025 Life360 Core(1) Monthly Active Users (MAU) – Global 107.7 102.4 97.8 95.8 91.6 U.S. 55.8 54.0 51.8 50.6 48.7 International 51.9 48.4 46.0 45.3 42.9 UK, ANZ, CA 14.2 13.2 12.5 12.0 11.4 Other International 37.7 35.2 33.5 33.3 31.5 Paying Circles – Global 3.4 3.2 3.0 2.8 2.7 U.S. 2.4 2.3 2.1 2.0 1.9 International 1.0 1.0 0.9 0.8 0.8 UK, ANZ, CA 0.4 0.4 0.4 0.3 0.3 Other International 0.6 0.6 0.5 0.5 0.5 Average Revenue per Paying Circle (ARPPC) $ 143.56 $ 142.56 $ 143.03 $ 139.54 $ 137.63 Life360 Consolidated Subscriptions 3.9 3.7 3.5 3.4 3.3 Average Revenue per Paying Subscription (ARPPS) $ 130.50 $ 128.38 $ 127.15 $ 122.41 $ 119.33 Net hardware units shipped 0.6 0.7 0.4 1.9 0.9 Average Selling Price (ASP) $ 14.11 $ 14.70 $ 11.88 $ 10.06 $ 11.99 Annualized Monthly Revenue (AMR) $ 578.0 $ 537.2 $ 517.9 $ 478.0 $ 446.7 Additional KPI Related Information Subscription revenue $ 124.2 $ 115.6 $ 108.2 $ 102.5 $ 96.3 Non-Core subscription revenue $ (4.3) $ (4.5) $ (4.7) $ (5.2) $ (5.6) Core subscription revenue(2) $ 119.9 $ 111.1 $ 103.5 $ 97.3 $ 90.7 Subscription revenue bundling related adjustment $ 0.0 $ 0.0 $ 0.0 $ 0.0 $ (0.1) Hardware revenue bundling related adjustment $ 0.0 $ 0.1 $ 0.0 $ 0.0 $ 0.1
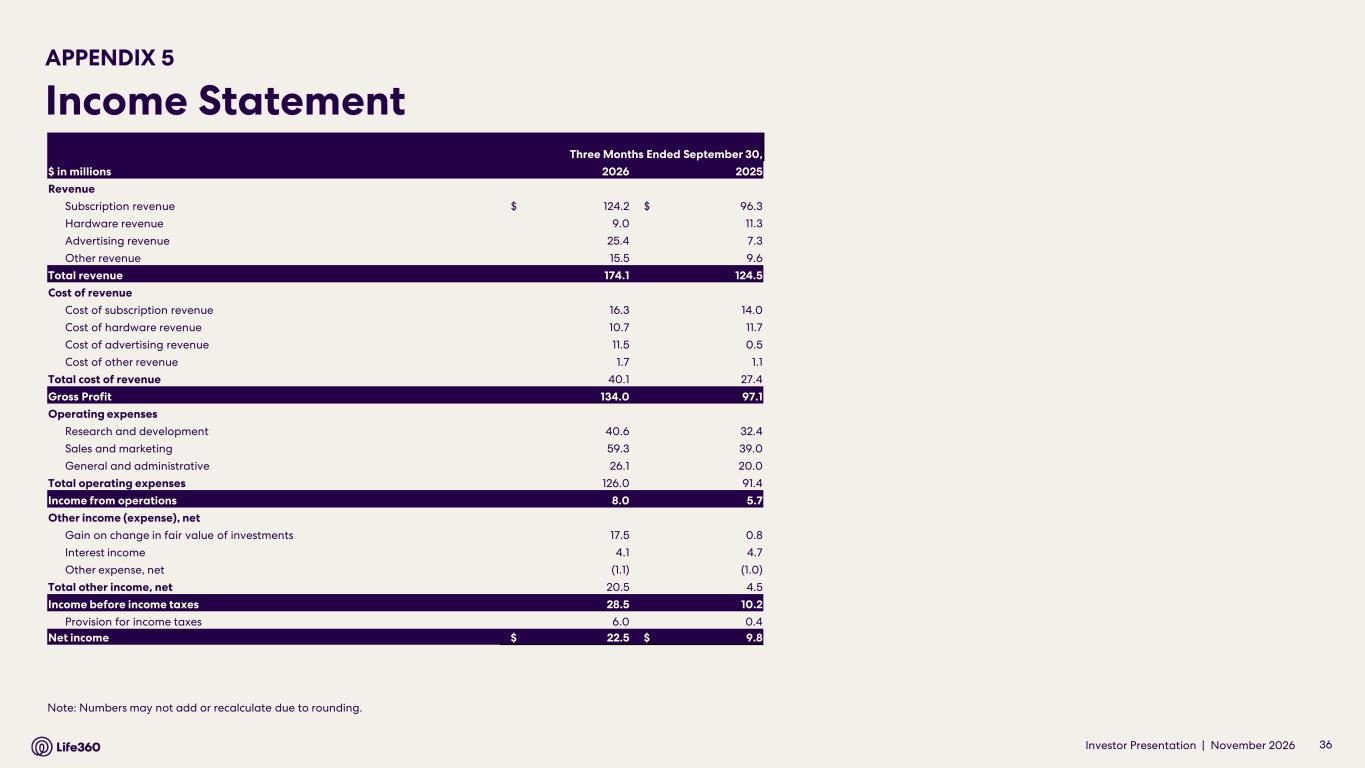
Investor Presentation | November 2026 APPENDIX 5 Income Statement 36 Note: Numbers may not add or recalculate due to rounding. Three Months Ended September 30, $ in millions 2026 2025 Revenue Subscription revenue $ 124.2 $ 96.3 Hardware revenue 9.0 11.3 Advertising revenue 25.4 7.3 Other revenue 15.5 9.6 Total revenue 174.1 124.5 Cost of revenue Cost of subscription revenue 16.3 14.0 Cost of hardware revenue 10.7 11.7 Cost of advertising revenue 11.5 0.5 Cost of other revenue 1.7 1.1 Total cost of revenue 40.1 27.4 Gross Profit 134.0 97.1 Operating expenses Research and development 40.6 32.4 Sales and marketing 59.3 39.0 General and administrative 26.1 20.0 Total operating expenses 126.0 91.4 Income from operations 8.0 5.7 Other income (expense), net Gain on change in fair value of investments 17.5 0.8 Interest income 4.1 4.7 Other expense, net (1.1) (1.0) Total other income, net 20.5 4.5 Income before income taxes 28.5 10.2 Provision for income taxes 6.0 0.4 Net income $ 22.5 $ 9.8
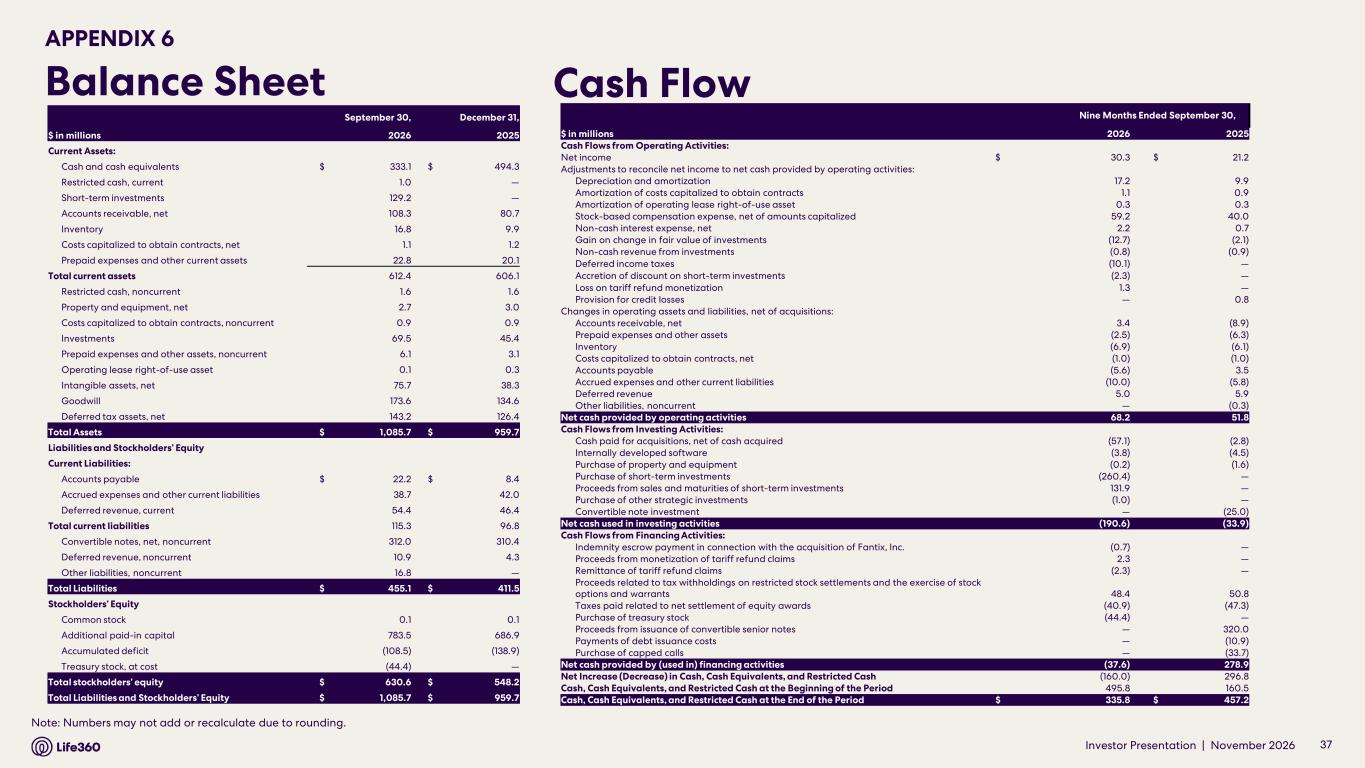
Investor Presentation | November 2026 APPENDIX 6 Balance Sheet Cash Flow 37 Note: Numbers may not add or recalculate due to rounding. September 30, December 31, $ in millions 2026 2025 Current Assets: Cash and cash equivalents $ 333.1 $ 494.3 Restricted cash, current 1.0 — Short-term investments 129.2 — Accounts receivable, net 108.3 80.7 Inventory 16.8 9.9 Costs capitalized to obtain contracts, net 1.1 1.2 Prepaid expenses and other current assets 22.8 20.1 Total current assets 612.4 606.1 Restricted cash, noncurrent 1.6 1.6 Property and equipment, net 2.7 3.0 Costs capitalized to obtain contracts, noncurrent 0.9 0.9 Investments 69.5 45.4 Prepaid expenses and other assets, noncurrent 6.1 3.1 Operating lease right-of-use asset 0.1 0.3 Intangible assets, net 75.7 38.3 Goodwill 173.6 134.6 Deferred tax assets, net 143.2 126.4 Total Assets $ 1,085.7 $ 959.7 Liabilities and Stockholders’ Equity Current Liabilities: Accounts payable $ 22.2 $ 8.4 Accrued expenses and other current liabilities 38.7 42.0 Deferred revenue, current 54.4 46.4 Total current liabilities 115.3 96.8 Convertible notes, net, noncurrent 312.0 310.4 Deferred revenue, noncurrent 10.9 4.3 Other liabilities, noncurrent 16.8 — Total Liabilities $ 455.1 $ 411.5 Stockholders’ Equity Common stock 0.1 0.1 Additional paid-in capital 783.5 686.9 Accumulated deficit (108.5) (138.9) Treasury stock, at cost (44.4) — Total stockholders’ equity $ 630.6 $ 548.2 Total Liabilities and Stockholders’ Equity $ 1,085.7 $ 959.7 Nine Months Ended September 30, $ in millions 2026 2025 Cash Flows from Operating Activities: Net income $ 30.3 $ 21.2 Adjustments to reconcile net income to net cash provided by operating activities: Depreciation and amortization 17.2 9.9 Amortization of costs capitalized to obtain contracts 1.1 0.9 Amortization of operating lease right-of-use asset 0.3 0.3 Stock-based compensation expense, net of amounts capitalized 59.2 40.0 Non-cash interest expense, net 2.2 0.7 Gain on change in fair value of investments (12.7) (2.1) Non-cash revenue from investments (0.8) (0.9) Deferred income taxes (10.1) — Accretion of discount on short-term investments (2.3) — Loss on tariff refund monetization 1.3 — Provision for credit losses — 0.8 Changes in operating assets and liabilities, net of acquisitions: Accounts receivable, net 3.4 (8.9) Prepaid expenses and other assets (2.5) (6.3) Inventory (6.9) (6.1) Costs capitalized to obtain contracts, net (1.0) (1.0) Accounts payable (5.6) 3.5 Accrued expenses and other current liabilities (10.0) (5.8) Deferred revenue 5.0 5.9 Other liabilities, noncurrent — (0.3) Net cash provided by operating activities 68.2 51.8 Cash Flows from Investing Activities: Cash paid for acquisitions, net of cash acquired (57.1) (2.8) Internally developed software (3.8) (4.5) Purchase of property and equipment (0.2) (1.6) Purchase of short-term investments (260.4) — Proceeds from sales and maturities of short-term investments 131.9 — Purchase of other strategic investments (1.0) — Convertible note investment — (25.0) Net cash used in investing activities (190.6) (33.9) Cash Flows from Financing Activities: Indemnity escrow payment in connection with the acquisition of Fantix, Inc. (0.7) — Proceeds from monetization of tariff refund claims 2.3 — Remittance of tariff refund claims (2.3) — Proceeds related to tax withholdings on restricted stock settlements and the exercise of stock options and warrants 48.4 50.8 Taxes paid related to net settlement of equity awards (40.9) (47.3) Purchase of treasury stock (44.4) — Proceeds from issuance of convertible senior notes — 320.0 Payments of debt issuance costs — (10.9) Purchase of capped calls — (33.7) Net cash provided by (used in) financing activities (37.6) 278.9 Net Increase (Decrease) in Cash, Cash Equivalents, and Restricted Cash (160.0) 296.8 Cash, Cash Equivalents, and Restricted Cash at the Beginning of the Period 495.8 160.5 Cash, Cash Equivalents, and Restricted Cash at the End of the Period $ 335.8 $ 457.2
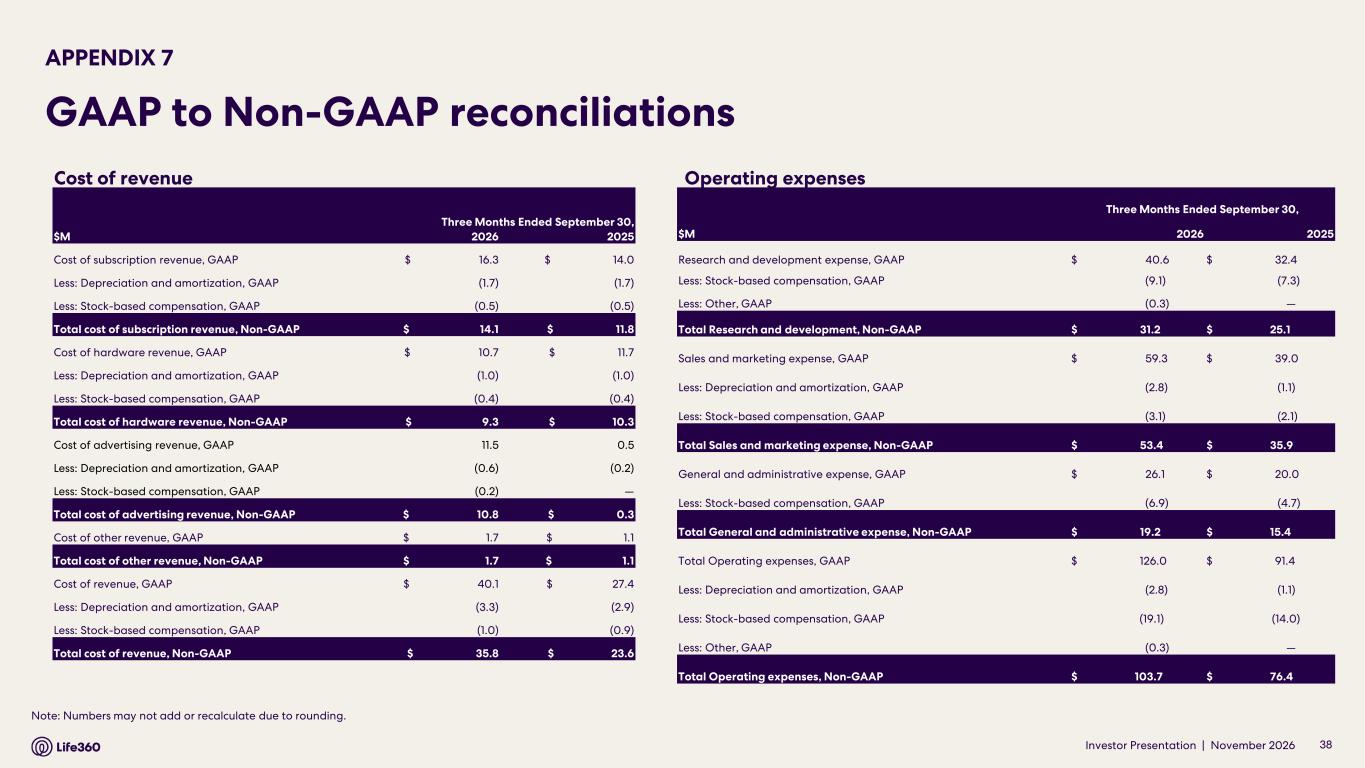
Investor Presentation | November 2026 Operating expenses APPENDIX 7 GAAP to Non-GAAP reconciliations 38 Note: Numbers may not add or recalculate due to rounding. Cost of revenue Three Months Ended September 30, $M 2026 2025 Cost of subscription revenue, GAAP $ 16.3 $ 14.0 Less: Depreciation and amortization, GAAP (1.7) (1.7) Less: Stock-based compensation, GAAP (0.5) (0.5) Total cost of subscription revenue, Non-GAAP $ 14.1 $ 11.8 Cost of hardware revenue, GAAP $ 10.7 $ 11.7 Less: Depreciation and amortization, GAAP (1.0) (1.0) Less: Stock-based compensation, GAAP (0.4) (0.4) Total cost of hardware revenue, Non-GAAP $ 9.3 $ 10.3 Cost of advertising revenue, GAAP 11.5 0.5 Less: Depreciation and amortization, GAAP (0.6) (0.2) Less: Stock-based compensation, GAAP (0.2) — Total cost of advertising revenue, Non-GAAP $ 10.8 $ 0.3 Cost of other revenue, GAAP $ 1.7 $ 1.1 Total cost of other revenue, Non-GAAP $ 1.7 $ 1.1 Cost of revenue, GAAP $ 40.1 $ 27.4 Less: Depreciation and amortization, GAAP (3.3) (2.9) Less: Stock-based compensation, GAAP (1.0) (0.9) Total cost of revenue, Non-GAAP $ 35.8 $ 23.6 Three Months Ended September 30, $M 2026 2025 Research and development expense, GAAP $ 40.6 $ 32.4 Less: Stock-based compensation, GAAP (9.1) (7.3) Less: Other, GAAP (0.3) — Total Research and development, Non-GAAP $ 31.2 $ 25.1 Sales and marketing expense, GAAP $ 59.3 $ 39.0 Less: Depreciation and amortization, GAAP (2.8) (1.1) Less: Stock-based compensation, GAAP (3.1) (2.1) Total Sales and marketing expense, Non-GAAP $ 53.4 $ 35.9 General and administrative expense, GAAP $ 26.1 $ 20.0 Less: Stock-based compensation, GAAP (6.9) (4.7) Total General and administrative expense, Non-GAAP $ 19.2 $ 15.4 Total Operating expenses, GAAP $ 126.0 $ 91.4 Less: Depreciation and amortization, GAAP (2.8) (1.1) Less: Stock-based compensation, GAAP (19.1) (14.0) Less: Other, GAAP (0.3) — Total Operating expenses, Non-GAAP $ 103.7 $ 76.4
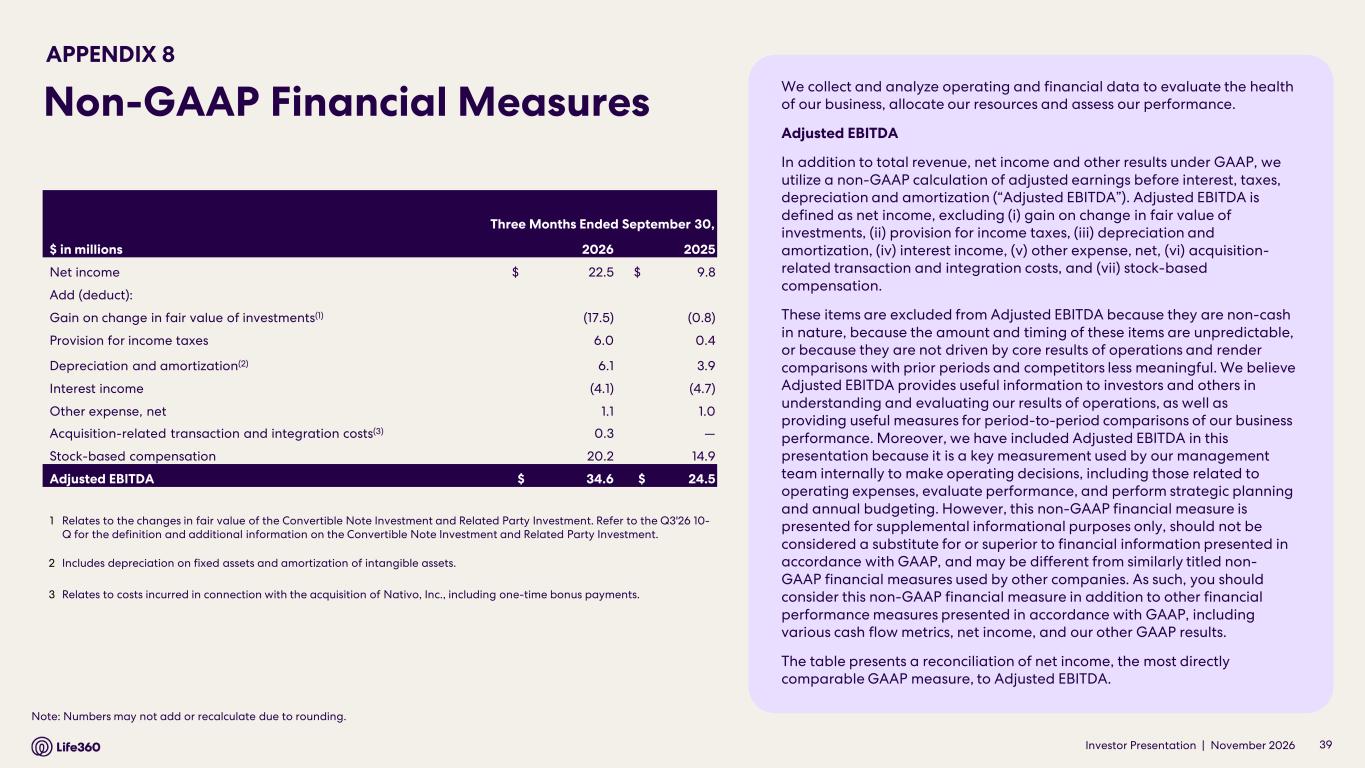
Investor Presentation | November 2026 We collect and analyze operating and financial data to evaluate the health of our business, allocate our resources and assess our performance. Adjusted EBITDA In addition to total revenue, net income and other results under GAAP, we utilize a non-GAAP calculation of adjusted earnings before interest, taxes, depreciation and amortization (“Adjusted EBITDA”). Adjusted EBITDA is defined as net income, excluding (i) gain on change in fair value of investments, (ii) provision for income taxes, (iii) depreciation and amortization, (iv) interest income, (v) other expense, net, (vi) acquisition- related transaction and integration costs, and (vii) stock-based compensation. These items are excluded from Adjusted EBITDA because they are non-cash in nature, because the amount and timing of these items are unpredictable, or because they are not driven by core results of operations and render comparisons with prior periods and competitors less meaningful. We believe Adjusted EBITDA provides useful information to investors and others in understanding and evaluating our results of operations, as well as providing useful measures for period-to-period comparisons of our business performance. Moreover, we have included Adjusted EBITDA in this presentation because it is a key measurement used by our management team internally to make operating decisions, including those related to operating expenses, evaluate performance, and perform strategic planning and annual budgeting. However, this non-GAAP financial measure is presented for supplemental informational purposes only, should not be considered a substitute for or superior to financial information presented in accordance with GAAP, and may be different from similarly titled non- GAAP financial measures used by other companies. As such, you should consider this non-GAAP financial measure in addition to other financial performance measures presented in accordance with GAAP, including various cash flow metrics, net income, and our other GAAP results. The table presents a reconciliation of net income, the most directly comparable GAAP measure, to Adjusted EBITDA. 39 APPENDIX 8 Note: Numbers may not add or recalculate due to rounding. 1 Relates to the changes in fair value of the Convertible Note Investment and Related Party Investment. Refer to the Q3'26 10- Q for the definition and additional information on the Convertible Note Investment and Related Party Investment. 2 Includes depreciation on fixed assets and amortization of intangible assets. 3 Relates to costs incurred in connection with the acquisition of Nativo, Inc., including one-time bonus payments. Three Months Ended September 30, $ in millions 2026 2025 Net income $ 22.5 $ 9.8 Add (deduct): Gain on change in fair value of investments(1) (17.5) (0.8) Provision for income taxes 6.0 0.4 Depreciation and amortization(2) 6.1 3.9 Interest income (4.1) (4.7) Other expense, net 1.1 1.0 Acquisition-related transaction and integration costs(3) 0.3 — Stock-based compensation 20.2 14.9 Adjusted EBITDA $ 34.6 $ 24.5 Non-GAAP Financial Measures

Thank You 04 | OUTLOOK 05 | APPENDIX01 | HIGHLIGHTS 02 | FINANCIAL PERFORMANCE 03 | OPERATIONAL PERFORMANCE