
UNITED STATES
SECURITIES AND EXCHANGE COMMISSION
Washington, D.C. 20549
______________
FORM 10-Q
QUARTERLY REPORT PURSUANT TO SECTION 13 OR 15(d) OF THE SECURITIES EXCHANGE ACT OF 1934 | |||||
For the quarterly period ended | |||||
OR
TRANSITION REPORT PURSUANT TO SECTION 13 OR 15(d) OF THE SECURITIES EXCHANGE ACT OF 1934 | |||||
For the transition period from __________ to __________ | |||||
Commission File Number 001-42120
(Exact name of registrant as specified in its charter)
(State or other jurisdiction of incorporation or organization) | (I.R.S. Employer Identification No.) | ||||
(Address of principal executive office)(1) | (Zip Code) | ||||
Tel: (415 ) 484-5244
(Registrant's telephone number, including area code)
1900 South Norfolk Street, Suite 310
San Mateo, CA 94403
(Former name, former address and former fiscal year, if changed since last report)
Securities registered pursuant to Section 12(b) of the Act:
| Title of each class | Trading Symbol(s) | Name of each exchange on which registered | ||||||
Indicate by check mark whether the registrant: (1) has filed all reports required to be filed by Section 13 or 15(d) of the Securities Exchange Act of 1934 during the preceding 12 months (or for such shorter period that the registrant was required to file such reports), and (2) has been subject to such filing requirements for the past 90 days. Yes x No o
Indicate by check mark whether the registrant has submitted electronically every Interactive Data File required to be submitted pursuant to Rule 405 of Regulation S-T (§232.405 of this chapter) during the preceding 12 months (or for such shorter period that the registrant was required to submit such files). Yes x No o
Indicate by check mark whether the registrant is a large accelerated filer, an accelerated filer, a non-accelerated filer, a smaller reporting company, or an emerging growth company. See the definitions of “large accelerated filer,” “accelerated filer,” “smaller reporting company” and “emerging growth company” in Rule 12b-2 of the Exchange Act.
x | Accelerated filer | o | ||||||||||||
| Non-accelerated filer | o | Smaller reporting company | ||||||||||||
| Emerging growth company | ||||||||||||||
If an emerging growth company, indicate by check mark if the registrant has elected not to use the extended transition period for complying with any new or revised financial accounting standards provided pursuant to Section 13(a) of the Exchange Act. o
Indicate by check mark whether the registrant is a shell company (as defined in Rule 12b-2 of the Exchange Act). Yes o No x
As of November 3, 2026, the registrant had 81,755,320 shares of common stock, par value $0.001 per share, including shares underlying all issued and outstanding Chess Depositary Interests (“CDIs”), outstanding.
____________________
(1)We are a Delaware corporation with a globally distributed workforce and no corporate headquarters. Under the Securities and Exchange Commission's rules, we are required to designate a “principal executive office.” For purposes of this report, we have designated our mailing address in San Francisco, California as our principal executive office.
Life360, Inc.
Form 10-Q for the Quarter Ended September 30, 2026
Table of Contents
| Page | ||||||||
In this report, unless otherwise stated or the context otherwise indicates, the terms “Life360,” “the Company,” “we,” “us,” “our,” and similar references refer to Life360, Inc. and its consolidated subsidiaries. The Life360 logo, and other trademarks, trade names, or service marks of Life360, Inc. appearing in this Quarterly Report on Form 10-Q are the property of Life360, Inc. All other trademarks, trade names, and service marks appearing in this Quarterly Report on Form 10-Q are the property of their respective owners. Solely for convenience, the trademarks and trade names in this report may be referred to without the ® and ™ symbols, but such references should not be construed as any indicator that their respective owners will not assert their rights thereto.
FORWARD-LOOKING STATEMENTS
This Quarterly Report on Form 10-Q (this “Quarterly Report”) contains forward-looking statements within the meaning of the Private Securities Litigation Reform Act of 1995 that are based on our management’s beliefs and assumptions and on information currently available to our management. We intend such forward-looking statements to be covered by the safe harbor provisions for forward-looking statements contained in Section 21E of the Securities Exchange Act of 1934, as amended (the “Exchange Act”). These forward-looking statements include statements regarding, among other things, (a) our expectations regarding our results of operations and key performance indicators, (b) key factors affecting our performance, (c) our growth strategy, (d) our future financing plans, (e) our anticipated needs for, and use of, working capital, (f) our expectations regarding investment in strategic initiatives, (g) our expectations regarding our capital allocation and financing activities, including the effect of the capped call transactions entered into in connection with the pricing of our 0.00% convertible senior notes due June 1, 2030 (the "Notes"), our ability to satisfy our repayment, repurchase, or conversion obligations under the Notes, the effect of any conversion trigger events on the Notes and the capped call transactions, and the execution, timing, suspension, or discontinuation of our share repurchase program, (h) our financial and operational guidance and outlook, including with respect to Monthly Active User (“MAU”) growth, revenue, and other key metrics, (i) our ability to successfully integrate and realize the anticipated benefits of our recent acquisitions, (j) our integrations with third-party artificial intelligence (“AI”) platforms, and (k) the outcome and costs of pending legal proceedings and arbitrations, including mass arbitration demands. They are generally identifiable by use of the words: “may,” “might,” “will,” “could,” “would,” “should,” “expect,” “plan,” “anticipate,” “intend,” “seek,” “believe,” “estimate,” “predict,” “potential,” “continue,” “contemplate,” “possible,” or the negative of these terms or other comparable terminology, although not all forward-looking statements contain these words. We caution you that the foregoing list may not contain all of the forward-looking statements made in this Quarterly Report. These forward-looking statements are subject to risks and uncertainties, many of which are outside of our control, including risks related to our business, market risks, our need for additional capital, and the risk that our products and services may not perform as expected, as described in “Risk Factors” under Part II, Item 1A in this Quarterly Report, Part II, Item 1A in our previous Quarterly Report on Form 10-Q for the quarter ended June 30, 2026, filed with the Securities and Exchange Commission (the “SEC”) on August 10, 2026, and under Part I, Item 1A of the Company’s Form 10-K for the year ended December 31, 2025, filed with the SEC on March 2, 2026 (“Annual Report”), as well as in other sections of this report, as such risks may be updated in subsequent filings with the SEC or the Australian Securities Exchange (“ASX”). In light of these risks and uncertainties, there can be no assurance that the forward-looking statements contained in this filing will in fact occur. You should not place undue reliance on these forward-looking statements.
The forward-looking statements are not historical facts, but rather are based on current expectations, estimates, assumptions and projections about our industry, business and future financial results. The forward-looking statements speak only as of the date on which they are made, and, except to the extent required by federal securities laws, we undertake no obligation to update any forward-looking statements to reflect events or circumstances after the date on which the statements are made or to reflect the occurrence of unanticipated events. Our actual results could differ materially from the results contemplated by these forward-looking statements due to a number of factors, including, but not limited to, those discussed in “Risk Factors” under Part II, Item 1A in this Quarterly Report, Part II, Item 1A in our previous Quarterly Report on Form 10-Q for the quarter ended June 30, 2026, and Part I, Item 1A in our Annual Report, and other sections in this Quarterly Report.
PART I - FINANCIAL INFORMATION
Item 1. Financial Statements (unaudited)
1
Condensed Consolidated Balance Sheets
(Dollars in U.S. $, in thousands, except share and per share data)
(unaudited)
| September 30, 2026 | December 31, 2025 | ||||||||||
| Assets | |||||||||||
| Current Assets: | |||||||||||
| Cash and cash equivalents | $ | $ | |||||||||
| Restricted cash, current | |||||||||||
Short-term investments | |||||||||||
Accounts receivable, net(1) | |||||||||||
| Inventory | |||||||||||
| Costs capitalized to obtain contracts, net | |||||||||||
| Prepaid expenses and other current assets | |||||||||||
| Total current assets | |||||||||||
| Restricted cash, noncurrent | |||||||||||
| Property and equipment, net | |||||||||||
| Costs capitalized to obtain contracts, noncurrent | |||||||||||
Investments (2)(3) | |||||||||||
Prepaid expenses and other assets, noncurrent | |||||||||||
| Operating lease right-of-use asset | |||||||||||
| Intangible assets, net | |||||||||||
Goodwill | |||||||||||
Deferred tax assets, net | |||||||||||
| Total Assets | $ | $ | |||||||||
| Liabilities and Stockholders’ Equity | |||||||||||
| Current Liabilities: | |||||||||||
| Accounts payable | $ | $ | |||||||||
| Accrued expenses and other current liabilities | |||||||||||
Deferred revenue, current(4) | |||||||||||
| Total current liabilities | |||||||||||
| Convertible notes, net, noncurrent | |||||||||||
Deferred revenue, noncurrent(5) | |||||||||||
| Other liabilities, noncurrent | |||||||||||
| Total Liabilities | $ | $ | |||||||||
Commitments and Contingencies (Note 10) | |||||||||||
| Stockholders’ Equity | |||||||||||
Common Stock, $ | |||||||||||
Additional paid-in capital | |||||||||||
Accumulated deficit | ( | ( | |||||||||
Accumulated other comprehensive income | |||||||||||
Treasury stock, at cost; | ( | ||||||||||
Total stockholders’ equity | |||||||||||
Total Liabilities and Stockholders’ Equity | $ | $ | |||||||||
(1) Includes related party receivables of zero and $3 as of September 30, 2026, and December 31, 2025, respectively.
(2) Includes $19,617 and $24,726 measured using the fair value option as of September 30, 2026, and December 31, 2025, respectively, related to the Convertible Note Investment. Refer to Note 6, "Fair Value Measurements" for additional information.
(3) Includes the Related Party Investment of $23,719 and $5,882 as of September 30, 2026, and December 31, 2025, respectively and the Related Party Warrant of $14,319 and $3,898 as of September 30, 2026, and December 31, 2025. Refer to Note 6, "Fair Value Measurements" and Note 14, "Related-Party Transactions" for additional information.
(4) Includes related party deferred revenue, current of $4,367 and $780 as of September 30, 2026, and December 31, 2025.
(5) Includes related party deferred revenue, noncurrent of $9,740 and $2,242 as of September 30, 2026, and December 31, 2025, respectively.
See accompanying notes to the condensed consolidated financial statements (unaudited).
2
Condensed Consolidated Statements of Operations and Comprehensive Income
(Dollars in U.S. $, in thousands, except share and per share data)
(unaudited)
| Three Months Ended September 30, | Nine Months Ended September 30, | ||||||||||||||||||||||
| 2026 | 2025 | 2026 | 2025 | ||||||||||||||||||||
| Subscription revenue | $ | $ | $ | $ | |||||||||||||||||||
Hardware revenue(1) | |||||||||||||||||||||||
Advertising revenue | |||||||||||||||||||||||
Other revenue(2) | |||||||||||||||||||||||
| Total revenue | |||||||||||||||||||||||
| Cost of subscription revenue | |||||||||||||||||||||||
Cost of hardware revenue(3) | |||||||||||||||||||||||
Cost of advertising revenue | |||||||||||||||||||||||
| Cost of other revenue | |||||||||||||||||||||||
| Total cost of revenue | |||||||||||||||||||||||
| Gross profit | |||||||||||||||||||||||
| Operating expenses: | |||||||||||||||||||||||
| Research and development | |||||||||||||||||||||||
| Sales and marketing | |||||||||||||||||||||||
| General and administrative | |||||||||||||||||||||||
| Total operating expenses | |||||||||||||||||||||||
| Income (loss) from operations | ( | ||||||||||||||||||||||
| Other income (expense): | |||||||||||||||||||||||
Gain on change in fair value of investments(4) | |||||||||||||||||||||||
Interest income | |||||||||||||||||||||||
Other expense, net | ( | ( | ( | ( | |||||||||||||||||||
| Total other income, net | |||||||||||||||||||||||
Income before income taxes | |||||||||||||||||||||||
| Provision for (benefit from) income taxes | ( | ( | |||||||||||||||||||||
| Net income | $ | $ | $ | $ | |||||||||||||||||||
| Net income per share, basic (Note 15) | $ | $ | $ | $ | |||||||||||||||||||
| Net income per share, diluted (Note 15) | $ | $ | $ | $ | |||||||||||||||||||
| Weighted-average shares used in computing net income per share, basic (Note 15) | |||||||||||||||||||||||
| Weighted-average shares used in computing net income per share, diluted (Note 15) | |||||||||||||||||||||||
| Comprehensive income | |||||||||||||||||||||||
| Net income | $ | $ | $ | $ | |||||||||||||||||||
| Change in foreign currency translation adjustment | |||||||||||||||||||||||
Unrealized loss on available-for-sale securities, net of tax | ( | ( | |||||||||||||||||||||
| Total comprehensive income | $ | $ | $ | $ | |||||||||||||||||||
(2) Includes related party other revenue of $3,851 and $4,335 for the three and nine months ended September 30, 2026, respectively, and $195 and $682 for the three and nine months ended September 30, 2025, respectively.
(3) Includes related party cost of hardware revenue of zero and $62 for the three and nine months ended September 30, 2026, and $137
(4) Includes a related party gain of $17,837 zero and $882 for the three and nine months ended September 30, 2025, respectively.
See accompanying notes to the condensed consolidated financial statements (unaudited).
3
Condensed Consolidated Statements of Stockholders’ Equity
(Dollars in U.S. $, in thousands, except share and per share data)
(unaudited)
| Common Stock | Treasury Stock | Additional Paid-In Capital | Accumulated Deficit | Accumulated Other Comprehensive Income (Loss) | Total Stockholders’ Equity | ||||||||||||||||||||||||||||||||||||||||||
| Shares | Amount | Shares | Amount | ||||||||||||||||||||||||||||||||||||||||||||
Balance at December 31, 2025 | $ | $ | $ | $ | ( | $ | $ | ||||||||||||||||||||||||||||||||||||||||
| Exercise of stock options | — | — | — | — | — | ||||||||||||||||||||||||||||||||||||||||||
| Vesting of restricted stock units | — | — | ( | — | — | ||||||||||||||||||||||||||||||||||||||||||
| Taxes paid related to the settlement of equity awards, net of settlement proceeds received | — | — | — | — | ( | — | — | ( | |||||||||||||||||||||||||||||||||||||||
| Stock-based compensation expense | — | — | — | — | — | — | |||||||||||||||||||||||||||||||||||||||||
| Shares issued in connection with an acquisition | — | — | — | — | |||||||||||||||||||||||||||||||||||||||||||
| Change in foreign currency translation adjustment | — | — | — | — | — | — | ( | ( | |||||||||||||||||||||||||||||||||||||||
| Unrealized gain on available-for-sale securities, net of tax | — | — | — | — | — | — | |||||||||||||||||||||||||||||||||||||||||
| Net income | — | — | — | — | — | — | |||||||||||||||||||||||||||||||||||||||||
| Balance at March 31, 2026 | $ | $ | $ | $ | ( | $ | $ | ||||||||||||||||||||||||||||||||||||||||
| Exercise of stock options | — | — | — | — | — | ||||||||||||||||||||||||||||||||||||||||||
| Vesting of restricted stock units | — | — | — | — | — | ||||||||||||||||||||||||||||||||||||||||||
| Taxes paid related to the settlement of equity awards, net of settlement proceeds received | — | — | — | — | ( | — | — | ( | |||||||||||||||||||||||||||||||||||||||
| Stock-based compensation expense | — | — | — | — | — | — | |||||||||||||||||||||||||||||||||||||||||
| Change in foreign currency translation adjustment | — | — | — | — | — | — | ( | ( | |||||||||||||||||||||||||||||||||||||||
| Purchase of treasury stock | — | — | ( | ( | — | — | — | ( | |||||||||||||||||||||||||||||||||||||||
| Unrealized loss on available-for-sale securities, net of tax | — | — | — | — | — | — | ( | ( | |||||||||||||||||||||||||||||||||||||||
| Net income | — | — | — | — | — | — | |||||||||||||||||||||||||||||||||||||||||
| Balance at June 30, 2026 | $ | ( | $ | ( | $ | $ | ( | $ | ( | $ | |||||||||||||||||||||||||||||||||||||
| Exercise of stock options | — | — | — | — | |||||||||||||||||||||||||||||||||||||||||||
| Vesting of restricted stock units | — | — | — | — | — | — | — | ||||||||||||||||||||||||||||||||||||||||
| Taxes paid related to the settlement of equity awards, net of settlement proceeds received | — | — | — | — | ( | — | — | ( | |||||||||||||||||||||||||||||||||||||||
| Stock-based compensation expense | — | — | — | — | — | — | |||||||||||||||||||||||||||||||||||||||||
4
| Shares issued in connection with an acquisition | — | — | — | — | — | ||||||||||||||||||||||||||||||||||||||||||
| Change in foreign currency translation adjustment | — | — | — | — | — | — | |||||||||||||||||||||||||||||||||||||||||
| Purchase of treasury stock | — | — | ( | ( | — | — | — | ( | |||||||||||||||||||||||||||||||||||||||
| Unrealized loss on available-for-sale securities, net of tax | — | — | — | — | — | — | ( | ( | |||||||||||||||||||||||||||||||||||||||
| Net income | — | — | — | — | — | — | |||||||||||||||||||||||||||||||||||||||||
| Balance at September 30, 2026 | $ | ( | $ | ( | $ | $ | ( | $ | $ | ||||||||||||||||||||||||||||||||||||||
See accompanying notes to the condensed consolidated financial statements (unaudited).
5
Condensed Consolidated Statements of Stockholders’ Equity
(Dollars in U.S. $, in thousands, except share and per share data)
(unaudited)
| Common Stock | Additional Paid-In Capital | Accumulated Deficit | Accumulated Other Comprehensive Income (Loss) | Total Stockholders’ Equity | |||||||||||||||||||||||||||||||
| Shares | Amount | ||||||||||||||||||||||||||||||||||
| Balance at December 31, 2024 | $ | $ | $ | ( | $ | $ | |||||||||||||||||||||||||||||
| Exercise of stock options | — | — | — | ||||||||||||||||||||||||||||||||
| Vesting of restricted stock units | ( | — | — | ||||||||||||||||||||||||||||||||
| Taxes paid related to the settlement of equity awards, net of settlement proceeds received | — | — | ( | — | — | ( | |||||||||||||||||||||||||||||
| Stock-based compensation expense | — | — | — | — | |||||||||||||||||||||||||||||||
| Shares issued in connection with an acquisition | — | — | — | ||||||||||||||||||||||||||||||||
| Change in foreign currency translation adjustment | — | — | — | — | |||||||||||||||||||||||||||||||
| Net income | — | — | — | — | |||||||||||||||||||||||||||||||
| Balance at March 31, 2025 | $ | $ | $ | ( | $ | $ | |||||||||||||||||||||||||||||
| Exercise of stock options | — | — | |||||||||||||||||||||||||||||||||
| Vesting of restricted stock units | — | — | — | ||||||||||||||||||||||||||||||||
| Taxes paid related to the settlement of equity awards, net of settlement proceeds received | — | — | ( | — | — | ( | |||||||||||||||||||||||||||||
| Stock-based compensation expense | — | — | — | — | |||||||||||||||||||||||||||||||
Purchase of capped calls related to the June 2025 Convertible Notes, net of tax | — | — | ( | — | — | ( | |||||||||||||||||||||||||||||
| Change in foreign currency translation adjustment | — | — | — | — | ( | ( | |||||||||||||||||||||||||||||
| Net income | — | — | — | — | |||||||||||||||||||||||||||||||
| Balance at June 30, 2025 | $ | $ | $ | ( | $ | ( | $ | ||||||||||||||||||||||||||||
| Exercise of stock options | — | — | — | ||||||||||||||||||||||||||||||||
| Exercise of warrants | — | — | — | — | — | ||||||||||||||||||||||||||||||
| Vesting of restricted stock units | — | ( | — | — | ( | ||||||||||||||||||||||||||||||
| Taxes paid related to the settlement of equity awards, net of settlement proceeds received | — | — | ( | — | — | ( | |||||||||||||||||||||||||||||
| Stock-based compensation expense | — | — | — | — | |||||||||||||||||||||||||||||||
| Change in foreign currency translation adjustment | — | — | — | — | |||||||||||||||||||||||||||||||
| Net income | — | — | — | — | |||||||||||||||||||||||||||||||
| Balance at September 30, 2025 | $ | $ | $ | ( | $ | $ | |||||||||||||||||||||||||||||
See accompanying notes to the condensed consolidated financial statements (unaudited).
6
Condensed Consolidated Statements of Cash Flows
(Dollars in U.S. $, in thousands)
(unaudited)
| Nine Months Ended September 30, | |||||||||||
| 2026 | 2025 | ||||||||||
| Cash Flows from Operating Activities: | |||||||||||
| Net income | $ | $ | |||||||||
| Adjustments to reconcile net income to net cash provided by operating activities: | |||||||||||
| Depreciation and amortization | |||||||||||
| Amortization of costs capitalized to obtain contracts | |||||||||||
| Amortization of operating lease right-of-use asset | |||||||||||
| Stock-based compensation expense, net of amounts capitalized | |||||||||||
| Non-cash interest expense, net | |||||||||||
Gain on change in fair value of investments | ( | ( | |||||||||
Non-cash revenue from investments | ( | ( | |||||||||
| Deferred income taxes | ( | ||||||||||
Accretion of discount on short-term investments | ( | ||||||||||
| Loss on tariff refund monetization | |||||||||||
| Provision for credit losses | |||||||||||
| Changes in operating assets and liabilities, net of acquisitions: | |||||||||||
| Accounts receivable, net | ( | ||||||||||
| Prepaid expenses and other assets | ( | ( | |||||||||
| Inventory | ( | ( | |||||||||
| Costs capitalized to obtain contracts, net | ( | ( | |||||||||
| Accounts payable | ( | ||||||||||
| Accrued expenses and other current liabilities | ( | ( | |||||||||
| Deferred revenue | |||||||||||
| Other liabilities, noncurrent | ( | ||||||||||
| Net cash provided by operating activities | |||||||||||
| Cash Flows from Investing Activities: | |||||||||||
| Cash paid for acquisitions, net of cash acquired | ( | ( | |||||||||
| Internally developed software | ( | ( | |||||||||
| Purchase of property and equipment | ( | ( | |||||||||
Purchase of short-term investments | ( | ||||||||||
Proceeds from sales and maturities of short-term investments | |||||||||||
Purchase of other strategic investments | ( | ||||||||||
| Convertible note investment | ( | ||||||||||
| Net cash used in investing activities | ( | ( | |||||||||
| Cash Flows from Financing Activities: | |||||||||||
Indemnity escrow payment in connection with the acquisition of Fantix, Inc. | ( | ||||||||||
| Proceeds from monetization of tariff refund claims | |||||||||||
Remittance of tariff refund claims | ( | ||||||||||
| Proceeds related to tax withholdings on restricted stock settlements and the exercise of stock options and warrants | |||||||||||
| Taxes paid related to net settlement of equity awards | ( | ( | |||||||||
Purchase of treasury stock | ( | ||||||||||
| Proceeds from issuance of convertible senior notes | |||||||||||
| Payments of debt issuance costs | ( | ||||||||||
| Purchase of capped calls | ( | ||||||||||
| Net cash provided by (used in) financing activities | ( | ||||||||||
| Net Increase (Decrease) in Cash, Cash Equivalents, and Restricted Cash | ( | ||||||||||
7
| Cash, Cash Equivalents, and Restricted Cash at the Beginning of the Period | |||||||||||
| Cash, Cash Equivalents, and Restricted Cash at the End of the Period | $ | $ | |||||||||
| Supplemental disclosure: | |||||||||||
| Cash paid during the period for taxes | $ | $ | |||||||||
Cash received from a related party | |||||||||||
Cash payments included in the measurement of operating lease liabilities | |||||||||||
| Non-cash investing and financing activities: | |||||||||||
Fair value of stock issued in connection with acquisitions | |||||||||||
Liabilities incurred in connection with acquisitions | |||||||||||
| Property and equipment included within accrued expenses and other current liabilities | |||||||||||
| Stock-based compensation included in internally developed software | |||||||||||
Conversion of Related Party SAFE to Related Party Investment | |||||||||||
Incremental fair value of Related Party Warrant included in deferred revenue | |||||||||||
The following table presents the cash, cash equivalents, and restricted cash reported within the condensed consolidated statements of cash flows shown above:
| September 30, 2026 | September 30, 2025 | ||||||||||
| Cash and cash equivalents | $ | $ | |||||||||
| Restricted cash, current | |||||||||||
| Restricted cash, noncurrent | |||||||||||
| Total cash, cash equivalents, and restricted cash | $ | $ | |||||||||
See accompanying notes to the condensed consolidated financial statements (unaudited).
8
1. Nature of Business
Life360, Inc. (the “Company”) is a leading technology platform connecting millions of people throughout the world to the people, pets, and things they care about most. The Company has created a new category at the intersection of family, technology, and safety to help keep families connected and safe. The Company’s core offering, the Life360 mobile application, includes features like communications, driving safety, digital safety, and location sharing. Beyond the everyday, Life360 also provides much-needed protection and saves lives, which is crucial for families in emergency situations such as natural disasters, vehicle collisions, physical property theft, and digital identity theft. The Life360 mobile application operates under a “freemium” model where its core offering is available to members at no charge, with additional membership subscription options that are available but not required.
In addition to the Life360 mobile application, the Company also offers hardware tracking devices through the sale of Tile by Life360, Inc. (“Tile”) and Life360 Pet GPS products to keep members close to the people, pets, and things they care about most. The Company’s suite of product and service offerings, including the Life360 and Tile mobile applications, and related third-party services, is system and platform-agnostic, allowing its products and services to work seamlessly for its members, regardless of the devices they use.
The Company also generates advertising revenue through the placement of third-party advertisements on its platform and across third-party publisher networks through the Company’s advertising technology platform, and other revenue through partnerships and the sale of aggregated, non-personally identifiable data for data insight purposes.
2. Summary of Significant Accounting Policies
Included below are select significant accounting policies. Refer to Note 2, "Summary of Significant Accounting Policies" in the Company’s Annual Report for a full list of the Company’s significant accounting policies.
Basis of Presentation and Consolidation
The condensed consolidated balance sheet as of December 31, 2025, included herein, was derived from the audited financial statements as of that date. In the opinion of the Company’s management, the condensed consolidated financial statements reflect all normal recurring adjustments necessary to provide a fair presentation of the Company’s financial position, results of operations, stockholders’ equity, and cash flows for the interim periods presented. Operating results for these interim periods are not necessarily indicative of the Company’s future results of operations.
The condensed consolidated financial statements should be read in conjunction with the audited consolidated financial statements and notes thereto included in the Company’s Annual Report.
In 2026, the Company revised its presentation of Advertising revenue and Cost of advertising revenue in the condensed consolidated statements of operations and comprehensive income. These amounts were previously included within Other revenue and Cost of other revenue, respectively. During the current period, the Company also revised its presentation of Investments in the condensed consolidated balance sheets, which were previously included within Prepaid expenses and other assets, noncurrent. These changes were made to provide more meaningful information to financial statement users. Comparative prior period amounts have been reclassified to conform to the current period presentation. These reclassifications had no impact on net income or total assets.
9
Revenue Recognition
There have been no significant changes to the Company’s revenue recognition policies as disclosed in its Annual Report on Form 10-K for the year ended December 31, 2025. Revenue recognition disclosures have been updated in line with the presentation of Advertising revenue in the condensed consolidated statements of operations and comprehensive income.
Advertising Revenue
Advertising revenue is generated from advertisers, advertising agencies, and platform partners through managed advertising arrangements, programmatic and open marketplace channels, self-service advertising, and other advertising services. Advertisements are placed across both the Company’s own properties and third-party publisher networks. These offerings include audience targeting, advertising technology solutions, and related professional services, facilitated by the Company’s advertising technology platform.
Managed advertising arrangements are direct sales of advertising inventory to advertisers and agencies, where the Company provides campaign management and optimization services. Programmatic advertising refers to the automated buying and selling of advertising inventory through open marketplace and other programmatic channels, including auction-based bidding on advertising exchanges. This includes exchange-based transactions where advertising inventory is made available to all buyers through both the Company’s advertising platform and third-party advertising exchanges. Self-service advertising consists of advertising media spend, platform access fees, and other advertising services through the Company's advertising technology platform. Other advertising-related services include professional services and measurement and analytics solutions.
The Company’s advertising arrangements may include multiple promised services, which are evaluated to determine whether they represent distinct performance obligations, with revenue allocated to each distinct performance obligation based on its relative standalone selling price. Consideration is typically based on a per-impression or similar usage-based model, but may also include fixed fees or revenue-sharing arrangements. When arrangements involve third-party inventory or services, the Company evaluates whether it acts as the principal or agent in the transaction and reports revenue on a gross basis when it acts as the principal in the transaction, or on a net basis when it acts as an agent. Revenue from advertising arrangements, including variable consideration, is recognized in the period in which impressions are delivered or related services are performed.
Other Revenue
The Company’s other revenue consists of data and partnership revenue. Refer to the Company’s Annual Report on Form 10-K for the year ended December 31, 2025 for additional detail regarding the components and revenue recognition for data revenue.
Partnership revenue includes lead generation offerings and agreements with third parties that provide access to anonymized data insights on the Company’s mobile platform. Under these agreements, the Company may earn a percentage of the revenue generated from data insights. Revenue is recorded on a gross basis if the Company acts as the principal in the transaction, or a net basis if the Company acts as the agent. Variable consideration from partnership arrangements is recognized in the period in which the related services are delivered.
Cost of Revenue
Cost of Advertising Revenue
Cost of advertising revenue includes cloud-based hosting costs supporting the Company’s advertising technology platform, amortization of acquired intangibles and internally developed software, third-party data and content licensing costs, personnel-related costs, and allocated overhead, such as facilities, including rent and utilities, and shared information technology costs. For advertising revenue recognized on a gross basis, cost of advertising revenue includes traffic acquisition costs, which represent amounts paid to third-party publishers for advertising placements and inventory access. Personnel-related expenses include salaries, bonuses, benefits, and stock-based compensation for advertising operations personnel.
10
Cost of Other Revenue
Cost of other revenue includes cloud-based hosting costs as well as costs of product operations functions and personnel-related costs associated with the Company’s data platforms.
Use of Estimates
The preparation of the Company’s condensed consolidated financial statements in conformity with GAAP requires management to make certain estimates, judgments, and assumptions that affect the reported amounts of assets, liabilities, net revenue, and expenses. Significant items subject to such estimates, judgments, and assumptions include:
•revenue recognition, including the determination of selling prices for distinct performance obligations sold in multiple performance obligation arrangements, the period over which revenue is recognized for certain arrangements, and estimated delivery dates for orders with title transfer upon delivery;
•allowance for credit losses and product returns;
•promotional and marketing allowances;
•inventory valuation;
•average useful customer life;
•valuation of stock-based awards, including market-based restricted stock units (“MRSUs”);
•achievement of performance-based restricted stock units (“PRSUs”);
•legal contingencies;
•impairment of long-lived assets and goodwill;
•valuation of non-cash consideration, contingent consideration, investments, convertible notes, and embedded derivatives;
•useful lives of long-lived assets; and
•income taxes including valuation allowances on deferred tax assets.
The Company bases its estimates and judgments on historical experience and on various assumptions that it believes are reasonable under the circumstances. Actual results could differ significantly from those estimates.
Recently Adopted Accounting Pronouncements
In July 2025, the Financial Accounting Standards Board (“FASB”) issued Accounting Standards Update (“ASU”) 2025-05, Financial Instruments - Credit Losses (Topic 326): Measurement of Credit Losses for Accounts Receivable and Contract Assets. The ASU introduces a practical expedient for estimating expected credit losses on current accounts receivable and current contract assets arising from revenue transactions from contracts with customers. The updates in this ASU are effective for annual periods beginning after December 15, 2025, and interim periods within those annual periods. The Company adopted this ASU on January 1, 2026 on a prospective basis. The adoption of this ASU did not have a material impact on the Company’s consolidated financial statements or related disclosures.
Accounting Pronouncements Not Yet Adopted
In May 2026, the FASB issued ASU 2026-02, Environmental Credits and Environmental Credit Obligations (Topic 818). This ASU provides requirements for the recognition, measurement, presentation, and disclosure for environmental credits and related environmental credit obligations for entities that generate, purchase, or receive environmental credits or have a regulatory compliance obligation that may be settled using environmental credits. The ASU is effective for annual periods beginning after December 15, 2027 and interim periods within those annual periods, with early adoption permitted. The Company is currently evaluating the impact of adopting this ASU on its consolidated financial statements and disclosures.
11
In December 2025, the FASB issued ASU 2025-11, Interim Reporting (Topic 270) Narrow-Scope Improvements. The ASU clarifies and reorganizes interim reporting guidance, including disclosure requirements related to events occurring since the end of the most recent annual reporting period, and improves the presentation and usability of interim financial statement disclosures. The ASU is effective for interim reporting periods within fiscal years beginning after December 15, 2027, with early adoption permitted. The Company is currently evaluating the impact of this ASU on its interim financial reporting and does not expect the adoption of this ASU to have a material impact on its consolidated financial statements.
In September 2025, the FASB issued ASU 2025-07, Derivatives and Hedging (Topic 815) and Revenue from Contracts with Customers (Topic 606): Derivatives Scope Refinements and Scope Clarification for Share-Based Noncash Consideration from a Customer in a Revenue Contract. The ASU narrows the scope of derivative accounting by excluding certain non-exchange-traded contracts whose terms are based on the normal operations or activities of one of the parties, and clarifies that share-based noncash consideration received from a customer in a revenue contract should be accounted for under ASC 606 until the right to the consideration becomes unconditional. The ASU is effective for annual periods beginning after December 15, 2026, and interim periods within those annual periods, with early adoption permitted. The Company does not expect the adoption of this ASU to have a material impact on its financial position or results of operations.
In September 2025, the FASB issued ASU 2025-06, Intangibles - Goodwill and Other - Internal-Use Software (Subtopic 350-40): Targeted Improvements to the Accounting for Internal-Use Software. The ASU eliminates project stages and requires software cost capitalization to begin after management has authorized and committed to funding the software project and it is probable the project will be completed and used to perform the function intended. The ASU also requires additional property, plant and equipment disclosures for all capitalized software costs. The ASU is effective for annual periods beginning after December 15, 2027, and interim periods within those years, with early adoption permitted. The Company is currently evaluating the impact of this ASU on its consolidated financial statements and related disclosures.
Concentrations of Risk and Significant Customers
Major Customers
The Company’s customers primarily consist of individual consumers, who subscribe to the Company’s product offerings through its third-party platforms (each a “Channel Partner”), advertising customers, data and partnership revenue customers, and retail partners, who purchase hardware tracking devices from the Company and resell them directly to individual consumers. Any changes in customer preferences and trends or changes in terms of use of Channel Partners’ platforms could have an adverse impact on the Company’s results of operations and financial condition.
12
The following tables set forth the information about Channel Partners that processed revenue transactions and advertising and retail partners who accounted for more than 10% of revenue or accounts receivable, respectively:
| Percentage of Revenue | |||||||||||||||||||||||
| Three Months Ended September 30, | Nine Months Ended September 30, | ||||||||||||||||||||||
| 2026 | 2025 | 2026 | 2025 | ||||||||||||||||||||
| Channel Partner (Apple) | % | % | % | % | |||||||||||||||||||
Channel and Advertising Partner (Google) | % | % | % | % | |||||||||||||||||||
| Percentage of Gross Accounts Receivable | |||||||||||
| As of September 30, | As of December 31, | ||||||||||
| 2026 | 2025 | ||||||||||
| Channel Partner (Apple) | % | % | |||||||||
| Channel and Advertising Partner (Google) | * | % | |||||||||
| Retail and Advertising Partner A | * | % | |||||||||
Supplier Concentration
The Company currently outsources the manufacturing of its hardware devices to a sole contract manufacturer. Although there are a limited number of manufacturers, management believes that other suppliers could provide similar manufacturing services on comparable terms.
Cash and Cash Equivalents
The Company considers all highly liquid investment securities with remaining maturities at the date of purchase of three months or less to be cash equivalents. Cash and cash equivalents include deposits, money market funds, and U.S. Treasury securities. Money market funds are valued using quoted market prices and therefore are classified within Level 1 of the fair value hierarchy.
Restricted Cash
The restricted cash, current balance of $1.0 million as of September 30, 2026, primarily relates to cash held in escrow to fund potential third-party fees. There was no restricted cash, current balance as of December 31, 2025. The restricted cash, noncurrent balance of $1.6
Short-Term Investments
The Company classifies all marketable debt securities that have maturities at the time of purchase greater than three months as short-term investments. The appropriate classification is determined at the time of purchase and reevaluated at each balance sheet date. These securities have been classified as available-for-sale as they represent funds readily available for current operations, and the Company has the ability and intent to liquidate them at any time to meet its operating cash needs, if necessary. The Company’s available-for-sale securities are recorded at fair value each reporting period. The majority of the securities are valued using quoted prices of similar instruments and are thus classified within Level 2 of the fair value hierarchy. The Company reports the unrealized gain (loss) on available-for-sale securities, net of tax, as a component of stockholders’ equity, except for the changes in allowance for expected credit losses, which are recorded in other income (expense), net on the condensed consolidated statements of operations and comprehensive income. The Company records accrued interest on these securities within prepaid expenses and other current assets on the condensed consolidated balance sheets. Realized gains and losses on sales of available-for-sale securities are determined using the specific identification method and are recognized in other income (expense), net, in the period of sale, with the related unrealized gain or loss reclassified from accumulated other comprehensive income to earnings.
13
3. Segment and Geographic Revenue
The Company operates as one operating segment. Operating segments are defined as components of an entity for which separate financial information is regularly evaluated by the chief operating decision maker (“CODM”), which is the Company’s Chief Executive Officer, in deciding how to allocate resources and assess performance. The Company’s CODM evaluates financial information and resources and assesses the performance of these resources on a consolidated basis. There is no expense or asset information that is supplemental to information disclosed within the condensed consolidated financial statements, that is regularly provided to the CODM. The allocation of resources and assessment of performance of the operating segment is based on consolidated net income and functional expenses as reported on our condensed consolidated statements of operations and comprehensive income. Because the Company operates as one operating segment, financial segment information, including expense and asset information, can be found in the condensed consolidated financial statements. All material long-lived assets are based in the U.S.
Revenue by geography is generally based on the address of the customer as defined in the contract with the customer. The following table sets forth revenue by geographic region for the periods presented (in thousands):
| Three Months Ended September 30, | Nine Months Ended September 30, | ||||||||||||||||||||||
| 2026 | 2025 | 2026 | 2025 | ||||||||||||||||||||
| North America | $ | $ | $ | $ | |||||||||||||||||||
| Europe, Middle East, and Africa | |||||||||||||||||||||||
| Other international regions | |||||||||||||||||||||||
| Total revenue | $ | $ | $ | $ | |||||||||||||||||||
The Company’s revenues in the U.S. were $150.9 million, or 87 %, of total revenue for the three months ended September 30, 2026 and $104.6 million, or 84 %, of total revenue for the three months ended September 30, 2025. The Company’s revenues in the U.S. were $409.2 million, or 86 %, of total revenue for the nine months ended September 30, 2026 and $291.6 million, or 85 %, of total revenue for the nine months ended September 30, 2025.
4. Deferred Revenue
Deferred revenue consists primarily of payments received and accounts receivable recorded in advance of revenue recognition under the Company’s subscription service arrangements and is recognized as the revenue recognition criteria are met. The Company primarily invoices its customers for its subscription services arrangements in advance. Deferred revenue also includes balances related to future performance obligations for hardware, advertising, and other revenue. Amounts anticipated to be recognized within one year of the balance sheet date are recorded as deferred revenue, current and the remaining portion is recorded as deferred revenue, noncurrent on the condensed consolidated balance sheets.
During the three and nine months ended September 30, 2026, the Company recognized revenue of $6.3 million and $43.8 million, respectively, that was included in the deferred revenue balance at December 31, 2025. During the three and nine months ended September 30, 2025, the Company recognized revenue of $5.9 million and $37.5 million, respectively, that was included in the deferred revenue balance at December 31, 2024.
Remaining performance obligations represent the amount of contracted future revenue not yet recognized as the amounts relate to undelivered performance obligations, including both deferred revenue and non-cancellable contracted amounts that will be invoiced and recognized as revenue in future periods. As permitted in ASC 606, Revenue from Contracts with Customers, and specifically ASC 606-10-50-14(a), the Company has excluded from this amount variable consideration allocated entirely to wholly unsatisfied performance obligations. Revenue expected to be recognized in connection with remaining performance obligations was $205.1 million as of September 30, 2026, of which the Company expects 47 % to be recognized over the next twelve months .
14
5. Short-Term Investments
Short-term investments consist of marketable debt securities, which are comprised of U.S. Treasury securities. The Company classifies its short-term investments as available-for-sale. Available-for-sale investments are carried at fair value, with unrealized gains and losses on available-for-sale securities, net of tax reported as a component of accumulated other comprehensive income in the condensed consolidated balance sheets. Unrealized gains and losses represent fair value adjustments due to changes in market interest rates and are realized only if the securities are sold prior to maturity. Realized gains and losses are included in net income. The Company does not intend to sell, nor expects to be required to sell, these securities before recovery of their amortized cost basis.
In 2026, the Company deployed surplus cash into a managed portfolio of U.S. Treasury securities and U.S. government money market funds. U.S. Treasury securities with original maturities greater than three months and up to twelve months at the date of purchase are classified as short-term investments. U.S. Treasury securities with original maturities of three months or less at the date of purchase and U.S. government money market funds are classified as cash equivalents.
As of September 30, 2026, the Company’s short-term investments consisted of the following (in thousands):
Gross Unrealized | |||||||||||||||||||||||
Cost | Gains | Losses | Total Estimated Fair Value | ||||||||||||||||||||
| U.S. Treasury securities | $ | $ | $ | ( | $ | ||||||||||||||||||
Total Short-term investments | $ | $ | $ | ( | $ | ||||||||||||||||||
As of September 30, 2026, all short-term investments had contractual maturities of less than one year. The Company did not record an allowance for credit losses on its short-term investments during the three and nine months ended September 30, 2026.
The Company recognized $115.0 million and $131.9 million in proceeds from the sale or maturity of short-term investments during the three and nine months ended September 30, 2026, respectively. Realized gains or losses were immaterial during the three and nine months ended September 30, 2026.
Accrued interest income on short-term investments was $0.4 million as of September 30, 2026 and is included within prepaid expenses and other current assets on the condensed consolidated balance sheet.
6. Fair Value Measurements
The Company measures and reports certain assets and liabilities at fair value each reporting period using a fair value hierarchy that prioritizes the use of observable inputs and minimizes the use of unobservable inputs when measuring fair value. A financial instrument’s classification within the fair value hierarchy is based upon the lowest level of input that is significant to the fair value measurement.
The Company measures certain non-marketable equity securities and warrant investments at fair value on a nonrecurring basis in accordance with ASC 321, Investments - Equity Securities. Instruments are remeasured to fair value when observable price changes in orderly transactions for an identical or a similar investment of the same issuer occur.
The three levels of inputs that may be used to measure fair value are as follows:
Level 1 – Observable inputs, such as quoted prices in active markets for identical assets or liabilities.
Level 2 – Observable inputs other than Level 1 prices, such as quoted prices for similar assets or liabilities, or other inputs that are observable or can be corroborated by observable market data for substantially the full term of the assets or liabilities.
Level 3 – Valuations based on unobservable inputs to the valuation methodology and including data about assumptions market participants would use in pricing the asset or liability based on the best information available under the circumstances.
15
The recorded carrying amounts of certain financial instruments, including cash and cash equivalents, prepaid expenses, accounts payable, and accounts receivable as of September 30, 2026 and December 31, 2025, approximate fair value due to their short-term maturities.
Recurring Fair Value Measurements
The Company measures and reports certain assets and liabilities at fair value on a recurring basis. The fair value of these assets and liabilities as of September 30, 2026 and December 31, 2025 are classified as follows (in thousands):
| As of September 30, 2026 | |||||||||||||||||||||||
| Level 1 | Level 2 | Level 3 | Total | ||||||||||||||||||||
| Assets: | |||||||||||||||||||||||
Cash and cash equivalents: | |||||||||||||||||||||||
| Money market funds | $ | $ | $ | $ | |||||||||||||||||||
| U.S. Treasury securities | |||||||||||||||||||||||
Short-term investments: | |||||||||||||||||||||||
| U.S. Treasury securities | |||||||||||||||||||||||
Investments: | |||||||||||||||||||||||
| Convertible Note Investment | |||||||||||||||||||||||
| Total assets | $ | $ | $ | $ | |||||||||||||||||||
| As of December 31, 2025 | |||||||||||||||||||||||
| Level 1 | Level 2 | Level 3 | Total | ||||||||||||||||||||
| Assets: | |||||||||||||||||||||||
| Cash and cash equivalents: | |||||||||||||||||||||||
| Money market funds | $ | $ | $ | $ | |||||||||||||||||||
Investments: | |||||||||||||||||||||||
| Convertible Note Investment | |||||||||||||||||||||||
| Total assets | $ | $ | $ | $ | |||||||||||||||||||
The change in fair value of the Level 3 instruments are as follows (in thousands):
| Nine Months Ended September 30, 2026 | |||||
Convertible Note Investment | |||||
Fair value, beginning of the year | $ | ||||
| Changes in fair value | ( | ||||
Fair value, end of period | $ | ||||
16
Convertible Note Investment
In May 2025, the Company entered into a series of transactions with Aura Consolidated Group, Inc. (“Aura”) including (i) a 3-year advertising partnership and revenue sharing agreement intended to expand the Company’s advertising revenue and other revenue channels and subscription membership offerings, and (ii) a $25.0 million convertible note investment by the Company into Aura (“Convertible Note Investment”). The note bears zero interest and matures on May 12, 2030. The principal is due at maturity and includes both optional and mandatory conversion features, which may result in conversion into the issuer’s equity upon the occurrence of specific events, including financing events, change in control, or at maturity. The Company elected to apply the fair value option in accordance with ASC 825, Financial Instruments, to account for the hybrid instrument as a single financial instrument. As a result, the entire instrument is measured at fair value, with changes recognized within Gain on change in fair value of investments on the condensed consolidated statements of operations and comprehensive income. A loss from change in fair value of $0.4 million and $5.1 million was recognized for the three and nine months ended September 30, 2026, respectively. A gain from changes in fair value of $0.8 million and $1.2 million was recognized for the three and nine months ended September 30, 2025, respectively. The Convertible Note Investment is included within investments on the condensed consolidated balance sheet.
The Company classifies the Convertible Note Investment as Level 3 due to the absence of relevant observable inputs. The fair value of the Convertible Note Investment was determined using a scenario-based, probability-weighted option pricing model. Significant assumptions include the discount rate as well as the timing and probability weighting of each settlement scenario.
Nonrecurring Fair Value Measurements
The Company measures certain non-marketable equity securities and warrant investments at fair value on a nonrecurring basis in accordance with ASC 321, Investments - Equity Securities, which are included within Investments on the condensed consolidated balance sheet. Additionally, the Company measures and reports certain assets at fair value each reporting period. For additional information, refer to Note 8, "Balance Sheet Components". Instruments that are remeasured to fair value when observable price changes in orderly transactions for an identical or a similar investment of the same issuer occur are considered Level 2 investments.
Related Party Investment
The Company’s preferred stock investment in a related party (the “Related Party Investment”) is classified within Level 2 of the fair value hierarchy as the valuation is based on an observable price for identical or similar shares that are not readily determinable. In August 2026, the related party completed a new round of preferred stock financing, which resulted in an observable price change based on the issuance of identical or similar preferred stock. As a result, a $17.8 No observable price changes were recorded during the three months ended September 30, 2025. A $0.9 million gain related to an observable price change was recorded during the nine months ended September 30, 2025. Cumulative gains recorded since the initial investment were $18.7 million as of September 30, 2026. The carrying value of the Related Party Investment was $23.7 million and $5.9 million as of September 30, 2026, and December 31, 2025, respectively, and is included within Investments on the condensed consolidated balance sheet.
Related Party Warrant
In 2024, the Company was granted a warrant to purchase shares of common stock in a related party (the “Related Party Warrant”). The grant was considered non-cash consideration in the transaction price of the technology exclusivity and revenue share agreement with the related party. The Company measured the Related Party Warrant at fair value on the date of issuance. In September 2026, the revenue share agreement and the terms of the Related Party Warrant were amended and accounted for as a contract modification. The incremental fair value of the warrant modification was approximately $10.4 million and was recorded as an increase to the Related Party Warrant and to deferred revenue, which is amortized to Other revenue over the term of the amended revenue share agreement. The Company classifies the Related Party Warrant as Level 3 due to the absence of relevant observable inputs.
The incremental fair value of the Related Party Warrant was determined as of the modification date using an option pricing model. Significant assumptions include expected volatility, the probability of vesting, and a discount for lack of marketability.
17
The carrying value of the Related Party Warrant was $14.3 million and $3.9 million as of September 30, 2026, and December 31, 2025, respectively, and is included within investments on the condensed consolidated balance sheet. Refer to Note 14, "Related-Party Transactions" for more information.
7. Business Combinations
Nativo, Inc.
On November 9, 2025, the Company entered into an Agreement and Plan of Reorganization with Nativo, Inc. (“Nativo”) to acquire 100 % of the outstanding equity interests of Nativo. Nativo is an advertising technology company that provides advertising serving, content distribution, and measurement solutions to publishers and advertisers. The acquisition accelerates and expands the Company’s advertising capabilities and monetization opportunities by leveraging Nativo's advertising technology and established publisher and advertiser relationships. The transaction closed on January 2, 2026, and has been accounted for as a business combination in accordance with ASC 805 - Business Combinations. The total consideration was $104.0 million, consisting of approximately $75.9 million in cash and $28.0 million in common stock, equivalent to 435,599 shares. The $75.9 million in cash consideration includes a $16.3 million indemnification holdback amount which is payable 24 months from the transaction close date upon satisfaction of certain obligations. The Company incurred transaction-related expenses of $3.8 million during the year ended December 31, 2025. No
The following table summarizes the acquisition date fair values of consideration transferred and net assets acquired (in thousands):
| Fair Value | |||||
Purchase consideration: | |||||
Cash consideration | $ | ||||
Equity consideration | |||||
Deferred purchase price liability | |||||
Total purchase consideration | $ | ||||
Assets acquired and liabilities assumed: | |||||
Cash and cash equivalents | $ | ||||
Accounts receivable, net | |||||
Prepaid expenses and other current assets | |||||
Intangible assets: | |||||
Trade name | |||||
| Technology | |||||
Customer relationships | |||||
| Goodwill | |||||
Deferred tax asset, noncurrent | |||||
Accounts payable | ( | ||||
Accrued expenses and other current liabilities | ( | ||||
Deferred revenue, current | ( | ||||
Total assets acquired and liabilities assumed | $ | ||||
18
The total purchase consideration has been allocated on a preliminary basis to the assets acquired, including intangible assets, and liabilities assumed based on their fair values as of the date of the acquisition, with the excess recorded to goodwill. The preliminary allocation may be subject to adjustment during the measurement period of up to 12 months from the date of acquisition including, but not limited to, intangible assets and income taxes. Any changes in the fair values of the assets acquired and liabilities assumed during the measurement period may result in adjustments to goodwill. Goodwill, which is not deductible for tax purposes, is primarily attributable to the value of expected synergies from the business combination, the assembled workforce, and growth opportunities.
The $46.5 million of identified intangible assets recognized in connection with the acquisition are subject to amortization using the straight-line method over the following estimated useful lives:
| Useful Life | |||||
| Trade name | |||||
| Technology | |||||
| Customer relationships | |||||
The deferred purchase price liability of $16.3 million represents the present value of the indemnification holdback amount of approximately $17.8 million, which is payable to the sellers 24 months following the acquisition close date upon satisfaction of certain obligations. The deferred purchase price liability was discounted to present value based on a market rate of interest commensurate with the 24 month payment term. This has been recorded in Other liabilities, noncurrent on the Company’s condensed consolidated balance sheet.
The Company has not presented the pro forma results of operations for the acquisition as the impact is not material to the Company’s condensed consolidated results of operations.
8. Balance Sheet Components
Accounts receivable, net
Accounts receivable, net consists of the following (in thousands):
| As of September 30, | As of December 31, | ||||||||||
| 2026 | 2025 | ||||||||||
| Accounts receivable | $ | $ | |||||||||
| Allowance for credit losses | ( | ( | |||||||||
| Total accounts receivable, net | $ | $ | |||||||||
Accounts receivable, net is presented net of the allowance for credit losses, which represents management’s estimate of expected credit losses based on historical trends, current economic conditions, and other relevant factors as of September 30, 2026 and December 31, 2025, respectively.
Included in accounts receivable, net are unbilled receivables, which are amounts that have not yet been invoiced to customers as of the balance sheet date, but are contractually owed to the Company. As of September 30, 2026 and December 31, 2025, unbilled receivables were $18.7 million and $10.3 million, respectively.
19
Inventory
Inventory consists of the following (in thousands):
| As of September 30, | As of December 31, | ||||||||||
| 2026 | 2025 | ||||||||||
| Raw materials | $ | $ | |||||||||
| Finished goods | |||||||||||
| Total inventory | $ | $ | |||||||||
There were no
Prepaid Expenses and Other Current Assets
Prepaid expenses and other current assets consist of the following (in thousands):
| As of September 30, | As of December 31, | ||||||||||
| 2026 | 2025 | ||||||||||
| Prepaid expenses | $ | $ | |||||||||
| Interest receivable | |||||||||||
| Other receivables | |||||||||||
| Total prepaid expenses and other current assets | $ | $ | |||||||||
Prepaid expenses primarily consist of advance payments for cloud platform costs, insurance, inventory, advertising, and other costs incurred in the ordinary course of business. Other receivables primarily consist of refunds owed to the Company and other amounts which the Company is expected to receive in less than twelve months.
Property and Equipment, net
Property and equipment, net consists of the following (in thousands):
| As of September 30, | As of December 31, | ||||||||||
| 2026 | 2025 | ||||||||||
| Computer equipment | $ | $ | |||||||||
| Leasehold improvements | |||||||||||
| Production manufacturing equipment | |||||||||||
| Construction in progress | |||||||||||
| Furniture and fixtures | |||||||||||
| Total property and equipment, gross | |||||||||||
| Less: accumulated depreciation | ( | ( | |||||||||
| Total property and equipment, net | $ | $ | |||||||||
For the three and nine months ended September 30, 2026, depreciation expense was $0.2 million and $0.6 million, respectively, and for the three and nine months ended September 30, 2025, depreciation expense was $0.1 million and $0.3 million, respectively.
There was no
20
Investments
Investments consist of the following (in thousands):
| As of September 30, | As of December 31, | ||||||||||
| 2026 | 2025 | ||||||||||
Convertible Note Investment | $ | $ | |||||||||
Data Revenue Partner Warrant | |||||||||||
Related Party Investment | |||||||||||
Related Party Warrant | |||||||||||
Other strategic investments | |||||||||||
Total Investments | $ | $ | |||||||||
As of September 30, 2026, Investments included the Convertible Note Investment, a warrant to purchase shares of preferred stock of a data partner (the “Data Revenue Partner Warrant”), the Related Party Investment, the Related Party Warrant, and other strategic investments in privately-held companies. As of December 31, 2025, Investments included the Convertible Note Investment, the Data Revenue Partner Warrant, the Related Party Investment, and the Related Party Warrant. Refer to Note 6, "Fair Value Measurements" and Note 14, "Related-Party Transactions" for additional information.
Prepaid expenses and other assets, noncurrent
Prepaid expenses and other assets, noncurrent, which was $6.1 million and $3.1 million as of September 30, 2026 and December 31, 2025, respectively, primarily consist of cloud platform costs.
Leases
The Company leases office space under a non-cancellable operating lease with a remaining lease term of 0.2 years, which includes the option to extend the lease.
The Company did not have any finance leases as of September 30, 2026 or December 31, 2025.
The components of lease expense are as follows (in thousands):
| Three Months Ended September 30, | Nine Months Ended September 30, | ||||||||||||||||||||||
| 2026 | 2025 | 2026 | 2025 | ||||||||||||||||||||
Operating lease cost (1) | $ | $ | $ | $ | |||||||||||||||||||
(1) Amounts include short-term leases, which are immaterial.
Supplemental balance sheet information related to leases is as follows (in thousands, except lease term):
| As of September 30, | As of December 31, | ||||||||||
| 2026 | 2025 | ||||||||||
| Operating lease right-of-use asset | $ | $ | |||||||||
| Weighted-average remaining term for operating lease (in years) | |||||||||||
The weighted-average discount rate used to measure the present value of the operating lease liabilities was 5.0
21
Maturities of the Company’s operating lease liability, which does not include short-term leases, as of September 30, 2026 were as follows (in thousands):
| Operating leases | |||||
| Remainder of 2026 | $ | ||||
| Total future minimum lease payments | |||||
| Less imputed interest | |||||
| Total operating lease liability | $ | ||||
Goodwill and Intangible Assets, net
Intangible assets, net consists of the following (in thousands):
| As of September 30, 2026 | |||||||||||||||||
| Gross | Accumulated Amortization | Net | |||||||||||||||
| Trade name | $ | $ | ( | $ | |||||||||||||
| Technology | ( | ||||||||||||||||
| Customer relationships | ( | ||||||||||||||||
Internally developed software | ( | ||||||||||||||||
| Total | $ | $ | ( | $ | |||||||||||||
| As of December 31, 2025 | |||||||||||||||||
| Gross | Accumulated Amortization | Net | |||||||||||||||
| Trade name | $ | $ | ( | $ | |||||||||||||
| Technology | ( | ||||||||||||||||
| Customer relationships | ( | ||||||||||||||||
Internally developed software | ( | ||||||||||||||||
| Total | $ | $ | ( | $ | |||||||||||||
For the three and nine months ended September 30, 2026, the Company capitalized $1.5 million and $4.9 million, respectively, in internally developed software. For the three and nine months ended September 30, 2025, the Company capitalized $1.3 million and $5.4 million, respectively, in internally developed software.
During the three and nine months ended September 30, 2026, the Company completed an immaterial acquisition. The transaction was accounted for as an asset acquisition as it did not meet the definition of a business combination. The acquired assets consisted entirely of developed technology and had a fair value of $2.6 3 years.
For the three and nine months ended September 30, 2026, amortization expense was $5.9 million and $16.6 million, respectively. For the three and nine months ended September 30, 2025, amortization expense was $3.8 million and $9.6 million, respectively.
During the three and nine months ended September 30, 2026 and 2025, there was no
22
As of September 30, 2026, the estimated remaining amortization expense for intangible assets by fiscal year is as follows (in thousands):
| Amount | |||||
| Remainder of 2026 | $ | ||||
| 2027 | |||||
| 2028 | |||||
| 2029 | |||||
| 2030 | |||||
| Thereafter | |||||
| Total future amortization expense | |||||
| Internally developed software not yet in service | |||||
| Total | $ | ||||
The weighted-average remaining useful lives of the Company’s acquired intangible assets, excluding internally developed software projects that were not yet in service, are as follows:
| Weighted-Average Remaining Useful Life | |||||||||||
| As of September 30, | As of December 31, | ||||||||||
| 2026 | 2025 | ||||||||||
| Trade name | |||||||||||
| Technology | |||||||||||
| Customer relationships | |||||||||||
| Internally developed software | |||||||||||
As of September 30, 2026 and December 31, 2025, the Company had $1.2 million and $2.8 million of capitalized internally developed software projects that were not yet in service, respectively. These projects have been excluded from the weighted-average remaining useful life calculation for internally developed software in the table above.
As of September 30, 2026 and December 31, 2025, goodwill was $173.6 million and $134.6 million, respectively. Goodwill increased $39.0 million in connection with the acquisition of Nativo. Refer to Note 7, "Business Combinations" for additional information. No
Accrued Expenses and Other Current Liabilities
Accrued expenses and other current liabilities consist of the following (in thousands):
| As of September 30, | As of December 31, | ||||||||||
| 2026 | 2025 | ||||||||||
| Accrued vendor expenses | $ | $ | |||||||||
| Customer related promotions and discounts | |||||||||||
| Accrued compensation | |||||||||||
| Sales return reserves | |||||||||||
| Other current liabilities | |||||||||||
| Total accrued expenses and other current liabilities | $ | $ | |||||||||
As of September 30, 2026, other current liabilities primarily relate to taxes payable and inventory received but not yet billed. As of December 31, 2025, other current liabilities primarily relate to the Company’s deferred purchase price liability related to the Fantix, Inc. acquisition, inventory received but not yet billed, and taxes payable.
23
Other Liabilities, noncurrent
Other liabilities, noncurrent consist of the deferred purchase price liability recorded in connection with the acquisition of Nativo, which was $16.8 million and zero as of September 30, 2026 and December 31, 2025, respectively.
The deferred purchase price liability was recorded at present value using a market rate of interest commensurate with the 24 month payment term, with the discount accreted to interest expense over the 24 month holdback period. As of September 30, 2026, the Company had recognized approximately $0.5 million of non-cash interest accretion within other income (expense), net in the condensed consolidated statements of operations and comprehensive income. Refer to Note 7, "Business Combinations" for additional information on the acquisition of Nativo.
9. Convertible Notes
June 2025 Convertible Notes
In June 2025, the Company issued $320.0 million aggregate principal amount of 0.00 % convertible senior notes due June 1, 2030. The June 2025 Convertible Notes are senior unsecured obligations and do not bear regular interest. Each $1,000 principal amount of the notes is initially convertible into 12.3501 shares of the Company’s common stock, which represents a conversion price of approximately $80.97 per share, subject to adjustment upon the occurrence of specified events. In certain circumstances, including conversions in connection with a make-whole fundamental change, the conversion rate may be increased, resulting in a conversion price as low as $61.11 . However, the maximum number of shares issuable per $1,000 principal amount is capped at 16.3639, which is subject to the same adjustment provisions as the initial conversion rate.
The June 2025 Convertible Notes are convertible at the option of the holders prior to the close of business on the business day immediately preceding March 1, 2030, only under the following circumstances: (1) during any fiscal quarter (and only during such quarter) beginning after September 30, 2025, if the closing price of the Company’s common stock for at least 20 trading days in any 30 consecutive trading day period ending on the last trading day of the prior fiscal quarter is greater than or equal to 130 % of the then-applicable conversion price; (2) during the five business days immediately following any 10 consecutive trading day period in which the trading price per $1,000 principal amount of notes was less than 98 % of the product of the closing price of the Company’s common stock and the conversion rate on each applicable trading day, following a request for such determination by a holder; (3) if the Company calls the notes for redemption, at any time prior to the close of business on the second scheduled trading day immediately preceding the redemption date; or (4) upon the occurrence of specified corporate events, such as certain mergers, reorganizations, or other changes of control.
The June 2025 Convertible Notes are convertible at the option of the holders on or after March 1, 2030, at any time prior to the close of business on the second scheduled trading day prior to the maturity date. Upon conversion, the Company will settle the principal portion of any June 2025 Convertible Notes in cash. Any amounts due on conversion over the principal portion may be settled, at the Company’s election, in cash, shares of common stock, or a combination thereof.
The Company may not redeem the June 2025 Convertible Notes prior to June 5, 2028. On or after that date, the Company may redeem all or a portion of the notes for cash if the closing price of the Company’s common stock has been at least 130 % of the conversion price then in effect for at least 20 trading days (whether or not consecutive) during a 30 consecutive trading day period ending on the trading day immediately preceding the date on which the Company provides notice of redemption. The redemption price will equal the principal amount of the notes to be redeemed, plus any accrued and unpaid interest up to, but excluding, the redemption date.
Upon the occurrence of a fundamental change, which includes certain change-of-control transactions, a delisting of the Company’s common stock, or a liquidation event, holders may require the Company to repurchase up to 100 % of their notes, plus accrued and unpaid special interest, if any, to, but excluding, the fundamental change repurchase date for cash.
The Company accounts for the June 2025 Convertible Notes entirely as a liability in accordance with ASC 470-20, Debt with Conversion and Other Options, as amended by ASU 2020-06. The embedded conversion feature is not separately accounted for as it does not require bifurcation under ASC 815, Derivatives and Hedging, as it is considered clearly and closely related to the host debt contract and does not meet the criteria for derivative accounting. The notes were issued at par and are recorded net of debt issuance costs.
24
As of September 30, 2026, the June 2025 Convertible Notes are classified as noncurrent as the conditions allowing holders of the notes to convert have not been met and the notes are not redeemable until June 5, 2028. The balance has been recorded within convertible notes, net, noncurrent on the Company’s condensed consolidated balance sheet.
The net carrying amount of the June 2025 Convertible Notes consists of the following (in thousands):
| As of September 30, | As of December 31, | ||||||||||
| 2026 | 2025 | ||||||||||
| Principal | $ | $ | |||||||||
| Unamortized debt issuance costs | ( | ( | |||||||||
| Net carrying amount | $ | $ | |||||||||
The debt issuance costs are amortized to interest expense over the term of the June 2025 Convertible Notes using the effective interest rate method. The effective interest rate used to amortize the debt issuance costs is 0.68 %. Interest expense recognized related to the June 2025 Convertible Notes was $0.5 million and $1.6 million for the three and nine months ended September 30, 2026, respectively. Interest expense recognized related to the June 2025 Convertible Notes was $0.5 million and $0.7 million for the three and nine months ended September 30, 2025, respectively. Interest expense is included within other income (expense), net on the condensed consolidated statements of operations and comprehensive income.
The estimated fair value of the June 2025 Convertible Notes, which we classify as Level 2 financial instruments, was determined using observable market prices. As of September 30, 2026, the estimated fair value of the June 2025 Convertible Notes was $290.1 million.
June 2025 Capped Calls
In connection with the pricing of the June 2025 Convertible Notes, the Company entered into privately-negotiated capped call transactions with certain dealer counterparties (the “June 2025 Capped Calls”). The June 2025 Capped Calls have an initial strike price of approximately $80.97 per share, which corresponds to the initial conversion price of the June 2025 Convertible Notes and is subject to certain adjustments. The June 2025 Capped Calls have a cap price of $122.22 per share, which is also subject to certain adjustments. The $33.7 million cost incurred in connection with the June 2025 Capped Calls was recorded as a reduction to Additional paid-in capital on the Company’s condensed consolidated balance sheet. This was partially offset by an $8.0 million increase to Additional paid-in capital related to the release of the associated valuation allowance in 2025. Conditions triggering adjustments to the initial strike price and the initial cap price of these capped calls are similar to those causing adjustments for the June 2025 Convertible Notes.
25
10. Commitments and Contingencies
Purchase Commitments
The Company has contractual commitments with our cloud platform provider and contract manufacturer that are non-cancellable. As of September 30, 2026, future non-cancellable commitments under these arrangements were as follows (in thousands):
Amount | |||||
| Remainder of 2026 | $ | ||||
| 2027 | |||||
| Total purchase commitments | $ | ||||
Contingencies
From time to time, the Company may have certain contingent liabilities that arise in the ordinary course of business activities. The Company accrues a liability for such matters when it is probable that future expenditures will be made, and such expenditures can be reasonably estimated. The Company is not subject to any current pending legal matters or claims that the Company believes could have a material adverse effect on its financial position, results of operations, or cash flows.
Indemnification
To date, the Company has not incurred significant costs and has not accrued any material liabilities in the accompanying condensed consolidated financial statements as a result of its indemnification obligations.
Litigation and Arbitration
Occasionally, the Company is involved in various legal proceedings, formal and informal dispute resolution processes, which may include arbitration or litigation, claims, and government investigations in the ordinary course of business. The outcome of litigation and other legal matters is inherently uncertain, though the Company intends to vigorously defend against any such matters. In making a determination regarding accruals, using available information, the Company evaluates the likelihood of an unfavorable outcome in legal or regulatory proceedings to which the Company is a party and records a loss contingency when it is probable a liability has been incurred and the amount of the loss can be reasonably estimated. When the Company determines an unfavorable outcome is not probable or reasonably estimable, the Company does not accrue for any potential litigation loss. Actual outcomes of these legal and regulatory proceedings may materially differ from the Company’s estimates.
From time to time, the Company is subject to "mass arbitration" demands, in which a large number of claimants assert similar claims against the Company in arbitration within a short period of time. Mass arbitration proceedings can result in significant administrative and arbitrator fees payable to the administering provider, which may be assessed irrespective of the merits of the underlying claims and in advance of any determination of liability. The Company is currently a respondent in more than one such proceeding, including the matter described below.
On August 14, 2023, plaintiffs Stephanie Ireland-Gordy and Shannon Ireland-Gordy filed a putative class action lawsuit against Tile, Life360, and Amazon.com, Inc. in the U.S. District Court for the Northern District of California (the “Court”), seeking damages as well as injunctive and declaratory relief. An amended complaint was filed on April 26, 2024, adding named plaintiffs Melissa Broad and Jane Doe. Plaintiffs allege that Tile trackers were used by third parties to monitor their movements without their consent, and assert product liability and other claims. On February 14, 2025, the Company filed a Motion to Dismiss. On August 6, 2025, the Court granted the Company’s Motion to Dismiss the claims of the Ireland-Gordy plaintiffs with prejudice and the remaining plaintiffs' claims are stayed pending an appeal of the Court's ruling on the Company’s Motion to Compel Arbitration, which was granted-in-part and denied-in-part. On March 3, 2026, the U.S. Court of Appeals for the Ninth Circuit ruled in the Company’s favor, reversing the district court’s partial denial of the Motion to Compel Arbitration and directing that all remaining claims be compelled to arbitration. The deadline for plaintiffs to file a petition for a writ of certiorari with the U.S. Supreme Court passed on June 1, 2026 without a petition having been filed. At this time, a loss is neither probable nor reasonably estimable, and as a result, no legal accrual has been recorded on the condensed consolidated balance sheets as of September 30, 2026.
26
In July 2025, the Keller Postman law firm filed arbitration demands with JAMS on behalf of approximately 8,600 claimants alleging that Life360’s advertising practices did not comply with the California Unruh Civil Rights Act by serving ads based on claimants’ protected characteristics such as age and gender. The Company believes it has substantial defenses and intends to vigorously defend the matter.
Following the filing of these demands, JAMS issued an invoice to the Company in the amount of approximately $17.0 million (the “JAMS Invoice”) for the initial mandatory filing fees associated with the proceeding. The Company believes that the claims should instead be administered by the National Arbitration and Mediation (“NAM”) pursuant to the Company’s Terms of Service and filed a petition to compel arbitration before NAM in the California Superior Court, County of San Mateo. In October 2026, the court denied the Company’s petition as to one claimant, ruling that such claimant’s arbitration would remain with JAMS but found that the Company had disputed the appropriate forum in good faith; fees associated with that claimant’s arbitration have been addressed separately and are not included in the amount above. The Company believes it has meritorious grounds to appeal the October ruling and is evaluating its options, including an appeal. The Company’s petition to compel remains pending as to the remaining claimants, with a hearing scheduled for February 2027. The JAMS Invoice is being held in abeyance by JAMS until a court determines that the remaining claims must be arbitrated before JAMS and is not currently due or payable. If the Company’s petition is denied as to the remaining claimants, the JAMS invoice may become payable in whole or in part, and the Company may be required to pay some or all of the JAMS Invoice. At this time, a loss associated with the underlying claims is neither probable nor reasonably estimable, and no accrual for damages has been recorded. The Company is currently unable to estimate the reasonably possible loss or range of loss, if any, associated with the underlying claims.
The Company receives claims and other threats of litigation from customers in the ordinary course of business. These claims are arbitrable and the Company accrues various costs for these claims, including arbitration fees, legal fees and costs. At this time, a loss is neither probable nor reasonably estimable from any such claims, and as a result, no legal accruals have been recorded on the condensed consolidated balance sheet as of September 30, 2026.
No litigation reserve was recorded on the condensed consolidated balance sheets as of September 30, 2026 and December 31, 2025.
11. Common and Treasury Stock
Common Stock
The Company has the following potentially outstanding common stock reserved for issuance:
| As of September 30, | As of December 31, | ||||||||||
| 2026 | 2025 | ||||||||||
| Issuances under stock incentive plan, stock options | |||||||||||
| Issuances upon vesting of restricted stock units | |||||||||||
| Shares reserved for shares available to be granted but not granted yet | |||||||||||
In May 2026, the Company’s Board of Directors authorized a share repurchase program allowing the deployment of up to $225.0 million to repurchase the Company’s outstanding common stock (the “Repurchase Program”). The Repurchase Program has no expiration date, does not obligate the Company to acquire a specific number of shares, and may be modified, suspended, or discontinued at any time. Repurchases may be made from time to time in the open market, in privately-negotiated transactions, in block trades, and/or through Rule 10b5-1 trading plans and Rule 10b-18 transactions, depending on market conditions and applicable rules and regulations. The Company accounts for treasury stock under the cost method.
During the three months ended September 30, 2026, the Company repurchased 666,336 shares of common stock for an aggregate purchase price of $31.2 million, and an average price of $46.85 per share, including commissions. During the nine months ended September 30, 2026, the Company repurchased 981,098 shares of common stock for an aggregate purchase price of $44.4 million, and an average price of $45.30 per share, including commissions. As of September 30, 2026, $180.6 million remained available under the Repurchase Program.
27
12. Equity Incentive Plan
2011 Equity Incentive Plan
The Company’s equity incentive plan allows the Company to grant restricted stock units (“RSUs”), which includes time-based, performance-based, and market-based restricted stock units, restricted stock, and stock options to employees and consultants of the Company and any of the Company’s parent, subsidiaries, or affiliates, and to the members of the Board of Directors.
Time-Based Restricted Stock Units
Time-based restricted stock units (“TRSUs”) generally vest based on continued service over a specified period, which is typically four years . Each TRSU represents the right to receive one share of common stock upon vesting. The fair value of TRSUs is determined based on the closing price of the Company’s common stock on the date of grant. Stock-based compensation expense for these awards is recognized on a straight-line basis over the requisite service period and is offset by actual forfeitures as they occur.
Performance-Based Restricted Stock Units
PRSUs are granted primarily to executive officers and, in limited cases, to certain other senior-level employees. Vesting is based on continued service and the attainment of certain financial performance metrics, including revenue and Adjusted Earnings Before Interest, Taxes, Depreciation and Amortization targets, over a one-year performance period, as established and approved by the Board of Directors. The number of shares issued upon vesting may be greater or lesser than the target award amount depending on actual performance, and shares attained above target will be recognized as awards granted in the period earned.
The Company granted 235,600 PRSUs during the nine months ended September 30, 2026 with the weighted-average grant-date fair value per share of $39.78 . The fair value of PRSUs is determined based on the closing price of the Company’s common stock on the date of grant. Stock-based compensation expense is recognized on a graded-vesting basis for multi-tranche awards and on a straight-line basis for single-tranche awards, based on the estimated probability of achieving the performance conditions, which is reassessed each period. If achievement of the performance conditions is not considered probable, all previously recognized stock-based compensation expense related to the unvested awards is reversed.
Market-Based Restricted Stock Units
MRSUs are granted to certain executive officers. Vesting is based on continued service and the Company’s total shareholder return during one-year , two-year , and three-year performance periods as measured relative to the group of companies comprising the S&P Software and Services Select Index. The number of shares issued upon vesting may be greater or lesser than the target award amount depending on actual performance, and shares attained above target will be recognized as awards granted in the period earned.
The Company granted 106,936 MRSUs during the nine months ended September 30, 2026 with the weighted-average grant-date fair value per share of $39.31 . Stock-based compensation expense is recognized on a graded-vesting basis over the service period and is not adjusted for actual performance outcomes.
The Company determined the fair value of the MRSUs granted using a Monte Carlo simulation model with the following assumptions:
Tranche 1 | Tranche 2 | Tranche 3 | |||||||||||||||
| Expected volatility | |||||||||||||||||
Risk-free interest rate based on U.S. Treasury yields | |||||||||||||||||
Expected term (years) | |||||||||||||||||
Weighted-average grant-date fair value per share | $ | $ | $ | ||||||||||||||
28
RSUs, including TRSUs, PRSUs, and MRSUs
RSU activity for the period presented is as follows:
| Number of Shares | Weighted-average grant-date fair value | ||||||||||
| Balance as of December 31, 2025 | $ | ||||||||||
RSUs granted | |||||||||||
RSUs vested and settled | ( | ||||||||||
RSUs cancelled/forfeited | ( | ||||||||||
| Balance as of September 30, 2026 | $ | ||||||||||
As of September 30, 2026, there was total unrecognized stock-based compensation expense for outstanding RSUs of $181.6 million to be recognized over a weighted-average period of approximately 2.9 years. This amount is comprised of unrecognized compensation expense of $168.0 million related to outstanding TRSUs, $7.8 million related to outstanding PRSUs, and $5.8 million related to outstanding MRSUs.
The number of RSUs vested and settled includes shares of common stock that the Company withheld on behalf of employees to satisfy the minimum statutory tax withholding requirements.
Stock Options
Stock option activity for the periods presented is as follows (in thousands, except share and per share data):
| Number of Shares Underlying Outstanding Options | Weighted-Average Exercise Price per Share | Weighted-Average Remaining Contractual Life (in Years) | Aggregate Intrinsic Value | ||||||||||||||||||||
| Balance as of December 31, 2025 | $ | $ | |||||||||||||||||||||
| Options exercised | ( | ||||||||||||||||||||||
| Options cancelled/forfeited | ( | ||||||||||||||||||||||
| Balance as of September 30, 2026 | |||||||||||||||||||||||
| Exercisable as of September 30, 2026 | $ | $ | |||||||||||||||||||||
As of September 30, 2026, there was no unrecognized stock-based compensation expense for outstanding stock options.
Stock-Based Compensation
Stock-based compensation expense was allocated as follows (in thousands):
| Three Months Ended September 30, | Nine Months Ended September 30, | ||||||||||||||||||||||
| 2026 | 2025 | 2026 | 2025 | ||||||||||||||||||||
| Cost of subscription revenue | $ | $ | $ | $ | |||||||||||||||||||
| Cost of hardware revenue | |||||||||||||||||||||||
Cost of advertising revenue | |||||||||||||||||||||||
| Total cost of revenue | |||||||||||||||||||||||
| Research and development | |||||||||||||||||||||||
| Sales and marketing | |||||||||||||||||||||||
| General and administrative | |||||||||||||||||||||||
Total stock-based compensation expense, net of amounts capitalized | $ | $ | $ | $ | |||||||||||||||||||
29
There was $0.3 million and $1.1 million of capitalized stock-based compensation costs recognized during the three and nine months ended September 30, 2026, respectively. There was $0.3 million and $0.9 million of capitalized stock-based compensation costs recognized during the three and nine months ended September 30, 2025, respectively.
13. Income Taxes
The provision for income taxes for interim quarterly reporting periods is based on the Company's estimates of the effective tax rates for the full fiscal year, in accordance with ASC 740-270, Income Taxes, Interim Reporting. ASC 740-270-25-2 requires that an annual effective tax rate be determined and such annual effective rate be applied to year-to-date income/loss in interim periods. The effective tax rate in any quarter may be subject to fluctuations during the year as new information is obtained, which may positively or negatively affect the assumptions used to estimate the annual effective tax rate, including factors such as valuation allowances against deferred tax assets, the recognition or de-recognition of tax benefits related to uncertain tax positions, if any, and changes in or the interpretation of tax laws in jurisdictions where the Company conducts business.
Accounting for income taxes for interim periods generally requires the provision for income taxes to be determined by applying an estimate of the annual effective tax rate for the full fiscal year to income or loss before income taxes, excluding unusual or infrequently occurring discrete items, for the reporting period.
For the three and nine months ended September 30, 2026, the Company recorded a provision for income taxes of $6.0 million and a benefit from income taxes of $9.7 million, respectively. The effective tax rate differs from the U.S. federal statutory rate primarily due to executive compensation and other non-deductible expenses, tax credits, and discrete tax benefits recognized during the quarter, which were primarily related to excess tax benefits for stock-based compensation.
For the three and nine months ended September 30, 2025, the Company recorded a provision for income taxes of $0.4 million and a benefit from income taxes of $0.2 million, respectively.
14. Related-Party Transactions
Hubble Transactions
In 2024, the Company entered into a strategic partnership and series of transactions with Hubble Network, Inc. (“Hubble”), including (i) a technology exclusivity and revenue share agreement (“Hubble Agreement”) beginning on November 12, 2024; (ii) a Hubble SAFE investment (“Related Party SAFE”); and (iii) Hubble’s issuance of a warrant to purchase common stock (“Related Party Warrant”). Hubble is a related party because Alex Haro, Hubble’s founder and CEO, is a co-founder, former executive, and current member of the Company’s Board of Directors.
In September 2026, the Company and Hubble amended the Hubble Agreement and the Related Party Warrant concurrently (collectively, the “2026 Related Party Amendments”). The amendments (i) extended the Hubble Agreement’s initial term from five years to six years , (ii) established a fixed revenue-share payment for the nine months ended September 30, 2026, and each year thereafter through 2029, and (iii) modified the vesting terms of the Related Party Warrant, converting half of the unvested shares to time-based vesting in equal quarterly installments from 2027 through 2028, and extending the remaining milestone deadlines by one year, with no change to exercise price or share count. The Company accounted for this as a contract modification and, using an option-pricing model, recorded incremental fair value of approximately $10.4 million, recorded as an increase to the Related Party Warrant and to deferred revenue, amortized to Other revenue over the term of the 2026 Related Party Amendments. The grant of the Related Party Warrant was considered non-cash consideration in the transaction price of the Hubble Agreement, which the Company measured at fair value on the date of issuance. As of September 30, 2026, 2,049,191 shares of the Related Party Warrant have vested.
In August 2026, Hubble completed a new preferred financing round on terms similar to the Company’s existing holding (the “Related Party Investment”), resulting in an observable price change in the Related Party Investment and a gain recorded within gain on change in fair value of investments. In April 2025, the Related Party SAFE converted into the Related Party Investment, also resulting in an observable price change and a gain recorded within gain on change in fair value of investments. Refer to Note 6, "Fair Value Measurements" for additional information.
30
The following tables include related party impact on amounts recognized in the condensed consolidated statements of operations and comprehensive income as follows (in thousands):
| Three Months Ended September 30, | Nine Months Ended September 30, | ||||||||||||||||||||||
| 2026 | 2025 | 2026 | 2025 | ||||||||||||||||||||
Hardware revenue | $ | $ | $ | $ | |||||||||||||||||||
Other revenue | |||||||||||||||||||||||
Cost of hardware revenue | |||||||||||||||||||||||
Gain on change in fair value of investments | |||||||||||||||||||||||
The $3.7 million of revenue-share payments recognized for the three months ended September 30, 2026, reflects the revised revenue-share terms under the 2026 Related Party Amendments.
The following table includes related party impact on amounts recorded on the condensed consolidated balance sheets as follows (in thousands):
| As of September 30, | As of December 31, | ||||||||||
| 2026 | 2025 | ||||||||||
| Accounts receivable | $ | $ | |||||||||
| Investments | |||||||||||
| Deferred revenue, current | |||||||||||
| Deferred revenue, noncurrent | |||||||||||
15. Net Income Per Share
Basic net income per share is calculated by dividing net income available to common stockholders by the weighted-average number of shares of common stock outstanding for the period. Diluted net income per share reflects the potential dilution that could occur if options, RSUs, warrants, or other securities with features that could result in the issuance of common stock were exercised or converted to common stock using the treasury-stock method.
In connection with the June 2025 Convertible Notes, the Company applied the if-converted method under ASC 260, Earnings Per Share, to calculate diluted earnings per share. Since the June 2025 Convertible Notes require principal settlement in cash and only the premium is potentially settled in shares, the Company includes the incremental dilutive shares (the conversion spread) in the denominator only when the average stock price exceeds the conversion price. For the three and nine months ended September 30, 2026, the June 2025 Convertible Notes were not dilutive, and therefore no incremental shares were included in diluted EPS.
The following table presents the calculation of basic and diluted net income per share (in thousands, except share and per share information):
| Three Months Ended September 30, | Nine Months Ended September 30, | ||||||||||||||||||||||
| 2026 | 2025 | 2026 | 2025 | ||||||||||||||||||||
Net income | $ | $ | $ | $ | |||||||||||||||||||
| Weighted-average shares outstanding: | |||||||||||||||||||||||
| Basic | |||||||||||||||||||||||
Dilutive effect of outstanding options, RSUs, warrants, or other securities | |||||||||||||||||||||||
| Diluted | |||||||||||||||||||||||
Net income per share: | |||||||||||||||||||||||
Basic | $ | $ | $ | $ | |||||||||||||||||||
| Diluted | $ | $ | $ | $ | |||||||||||||||||||
31
Certain potential shares of common stock were excluded from the diluted net income per share calculation as their inclusion would have been antidilutive. Excluded shares are as follows:
| Three Months Ended September 30, | Nine Months Ended September 30, | ||||||||||||||||||||||
| 2026 | 2025 | 2026 | 2025 | ||||||||||||||||||||
| Issuances upon vesting of restricted stock units | |||||||||||||||||||||||
| Issuances upon conversion of convertible notes | |||||||||||||||||||||||
| Total | |||||||||||||||||||||||
16. Subsequent Events
In November 2026, the Company purchased 290,738 preferred shares for $5.0 million in a financing round of a related party. Refer to Note 14, "Related-Party Transactions" for more information on related parties.
32
Item 2. Management’s Discussion and Analysis of Financial Condition and Results of Operations
The following discussion and analysis of our financial condition and results of operations should be read in conjunction with our condensed consolidated financial statements and related notes appearing elsewhere in this Quarterly Report and our Annual Report on Form 10-K for the year ended December 31, 2025, filed with the SEC on March 2, 2026 (“Annual Report”). In addition to historical financial information, the following discussion contains forward-looking statements that are based upon current plans, expectations, and beliefs that involve risks and uncertainties. Our actual results could differ materially from those discussed in the forward-looking statements as a result of a variety of factors, including but not limited to those discussed in Part II, Item 1A of this Quarterly Report, Part II, Item 1A in our previous Quarterly Report on Form 10-Q for the quarter ended June 30, 2026, and Part I, Item 1A in our Annual Report.
Overview
Life360 is a leading technology platform used to locate the people, pets, and things that matter most to families. Life360 is creating a new category at the intersection of family, technology, and safety to help keep families connected and safe. Our core offering, the Life360 mobile application, includes features that range from communications to driving safety and location sharing. The Life360 mobile application operates under a “freemium” model where its core offering is available to members at no charge, with additional membership subscription options that are available but not required. We also generate revenue through hardware subscription services and the sale of hardware tracking devices. By offering devices and integrated software to members, we have expanded our addressable market to provide members of all ages with a vertically integrated, cross-platform solution of scale. We also generate advertising revenue through the placement of third-party advertisements on our platform and across third-party publisher networks through our advertising technology platform, and other revenue through partnerships and the sale of aggregated, non-personally identifiable data for data insight purposes.
Key Factors Affecting Our Performance
We believe that our results of operations are affected by a number of factors, such as: the ability to remain a trusted brand; attracting, retaining, and converting members; maintaining efficient member acquisition; the ability to attract new and repeat purchasers of our hardware tracking devices; growth in Average Revenue per Paying Circle (“ARPPC”); expanding the offerings on our platform; attracting and retaining talent; seasonality; international expansion; and growth and monetization of advertising offerings. We discuss each of these factors in more detail under the heading “Item 7. Management’s Discussion and Analysis of Financial Condition and Results of Operations—Key Factors Affecting Our Performance” in our Annual Report. While we do not have control of all factors affecting our results of operations, we work diligently to influence and manage those factors which we can impact to enhance our results of operations.
Key Components of Our Results of Operations
The following discussion describes certain line items in our condensed consolidated statements of operations and comprehensive income.
Revenue
Subscription Revenue
We generate revenue primarily from sales of subscriptions on our platform, including Life360 and Tile. Revenue is recognized ratably over the related contractual term generally beginning on the date that our platform is made available to a customer. Our subscription agreements typically have monthly or annual contractual terms. Our agreements are generally non-cancellable during the contract term. We typically bill in advance for monthly and annual contracts. Amounts that have been billed are initially recorded as deferred revenue until the revenue is recognized.
Hardware Revenue
We generate our hardware revenue from the sale of hardware tracking devices and related accessories. For hardware and accessories, revenue is recognized at the time products are delivered. We sell hardware tracking devices and accessories through a number of channels including our website and online retail.
33
Advertising Revenue
Advertising revenue consists of fees earned from the placement of third-party advertisements across our own properties and third-party publisher networks. We generate advertising revenue through both direct relationships with brands and advertisers as well as through programmatic advertising networks. Advertisements are displayed to users in the form of in-app display advertisements and sponsored placements. Advertising revenue is driven primarily by the number of impressions delivered and the rates at which those impressions are sold.
Other Revenue
Other revenue consists of data and partnership revenue. We generate data revenue primarily through an arrangement with a key data partner that provides location-based analytics to customers in the retail and real estate sectors, municipalities, and other private and public organizations. The agreement permits commercialization of certain aggregated and de-identified data and provides for fixed and variable monthly revenue amounts. We generate partnership revenue through agreements with third parties which grant them access to anonymized data insights, through revenue-share payments from a related party, and through the recognition of revenue related to a warrant to purchase common stock of a related party (“Related Party Warrant”). Refer to Note 14, "Related-Party Transactions" for more information on the related party transactions.
Cost of Revenue and Gross Margin
Cost of Subscription Revenue
Cost of subscription revenue primarily consists of expenses related to hosting our services and providing support to our free and paying subscribers. These expenses include personnel-related costs associated with our cloud-based infrastructure and our customer support organization, third-party hosting fees, software and maintenance costs, outside services associated with the delivery of our subscription services, amortization of acquired intangibles and internally developed software, allocated overhead, such as facilities, including rent, utilities, depreciation on equipment shared by all departments, credit card and transaction processing fees, and shared information technology costs. Personnel-related expenses include salaries, bonuses, benefits, and stock-based compensation for operations personnel.
We plan to continue increasing the capacity and enhancing the capability and reliability of our infrastructure to support member growth and increased use of our platform. We expect that cost of revenue will increase in absolute dollars in future periods.
Cost of Hardware Revenue
Cost of hardware revenue consists of product costs, including hardware production, contract manufacturers for production, shipping and handling, packaging, fulfillment, personnel-related expenses, manufacturing and equipment depreciation, warehousing, tariff costs, customer support costs, credit card and transaction processing fees, warranty replacement, write-downs of excess and obsolete inventory, amortization of acquired intangibles, and allocated overhead, such as facilities, including rent and utilities, and shared information technology costs. Personnel-related expenses include salaries, bonuses, benefits, and stock-based compensation for operations personnel.
Cost of Advertising Revenue
Cost of advertising revenue includes cloud-based hosting costs supporting our advertising technology platform, amortization of acquired intangibles and internally developed software, third-party data and content licensing costs, personnel-related costs, and allocated overhead, such as facilities, including rent and utilities, and shared information technology costs. For advertising revenue recognized on a gross basis, cost of advertising revenue includes traffic acquisition costs, which represent amounts paid to third-party publishers for advertising placements and inventory access. Personnel-related expenses include salaries, bonuses, benefits, and stock-based compensation for advertising operations personnel.
Cost of Other Revenue
Cost of other revenue includes cloud-based hosting costs as well as costs of product operations functions and personnel-related costs associated with our data platforms.
34
Gross Profit and Gross Profit Margin
Our gross profit has been, and may in the future be, influenced by several factors, including timing of capital expenditures and related depreciation expense, increases in infrastructure costs, component costs, tariffs, contract manufacturing and supplier pricing, and foreign currency exchange rates. Gross profit and gross profit margin may fluctuate over time based on the factors described above.
Operating Expenses
Our operating expenses consist of research and development, sales and marketing, and general and administrative expenses.
Research and Development
Our research and development expenses consist primarily of personnel-related costs for our engineering, product, and design teams, usage-based fees for third-party artificial intelligence (“AI”) tools, material costs of building and developing prototypes for new products, mobile app development, and allocated overhead. We believe that continued investment in our platform is important for our growth. We intend to continue to invest in research and development to bring new customer experiences and devices to market and expand our platform capabilities.
Sales and Marketing
Our sales and marketing expenses consist primarily of commissions to our third-party platforms (each a “Channel Partner”), personnel-related costs, brand marketing costs, lead generation costs, growth media and other marketing spend to support strategic initiatives, sales incentives, sponsorships, amortization of acquired intangibles, bad debt expense, and allocated overhead. Commission payments to Channel Partners in connection with annual subscription sales of our mobile application on third-party store platforms are considered to be incremental and recoverable costs of obtaining a contract with a customer and are expensed as incurred or deferred and amortized over an estimated period of benefit of three years depending on the subscription type.
We plan to continue to invest in sales and marketing to grow our member base and increase our brand awareness, including marketing efforts to continue to drive our business model. We expect that sales and marketing expenses will increase in absolute dollars in future periods and will fluctuate as a percentage of revenue. The trend and timing of sales and marketing expenses will depend in part on the timing of marketing campaigns.
General and Administrative
Our general and administrative expenses consist primarily of employee-related costs for our legal, finance, human resources, and other administrative teams, as well as certain executive officers. In addition, general and administrative expenses include allocated overhead, outside legal, accounting, and other professional fees, and non-income-based taxes. We expect general and administrative expenses will increase in absolute dollars as our business grows.
Other Income (Expense)
Gain on Change in Fair Value of Investments
The Company measures certain non-marketable equity securities, including the Company’s preferred stock investment in a related party (the “Related Party Investment”) and the Related Party Warrant, at fair value on a nonrecurring basis in accordance with ASC 321, Investments - Equity Securities. The Company also elected the fair value option under ASC 825, Financial Instruments, to measure its convertible note investment in Aura Consolidated Group, Inc. (“Convertible Note Investment”) at fair value each reporting period.
Gain on change in fair value of investments reflects changes in the fair value of the Convertible Note Investment and observable price changes in the Related Party Investment. Refer to Note 14, "Related-Party Transactions" for more information on the related party transactions.
35
Interest Income
Interest income consists of interest earned on our cash and cash equivalents balances received from bank deposits, money market funds, and short-term investments, as well as the amortization of discounts on our short-term investments and cash equivalents.
Other Expense, Net
Other expense, net consists of foreign currency exchange gains/(losses) related to the remeasurement of certain assets and liabilities of our foreign subsidiaries that are denominated in currencies other than the functional currency of the subsidiary, foreign exchange transaction gains/(losses), interest expense primarily related to convertible notes and the deferred purchase price liability related to the acquisition of Nativo, Inc. (“Nativo”), and a loss related to the monetization of tariff refund claims.
Provision for (Benefit from) Income Taxes
Provision for (benefit from) income taxes consists of U.S. federal and state income taxes and foreign income taxes in jurisdictions in which we conduct business. Deferred income taxes reflect the net tax effect of temporary differences between the carrying amount of assets and liabilities for financial reporting purposes and the amounts used for income tax purposes.
36
Results of Operations
The following tables set forth our condensed consolidated statements of operations and comprehensive income for the three and nine months ended September 30, 2026 and 2025 (in thousands, except percentages).
| Three Months Ended September 30, | Nine Months Ended September 30, | ||||||||||||||||||||||||||||||||||
| 2026 | 2025 | % Change | 2026 | 2025 | % Change | ||||||||||||||||||||||||||||||
| Subscription revenue | $ | 124,193 | $ | 96,300 | 29 | % | $ | 348,023 | $ | 266,756 | 30 | % | |||||||||||||||||||||||
Hardware revenue | 8,996 | 11,312 | (20) | % | 23,328 | 32,485 | (28) | % | |||||||||||||||||||||||||||
Advertising revenue | 25,448 | 7,271 | 250 | % | 67,075 | 17,142 | 291 | % | |||||||||||||||||||||||||||
Other revenue | 15,500 | 9,614 | 61 | % | 37,793 | 27,119 | 39 | % | |||||||||||||||||||||||||||
| Total revenue | 174,137 | 124,497 | 40 | % | 476,219 | 343,502 | 39 | % | |||||||||||||||||||||||||||
Cost of subscription revenue(1) | 16,288 | 14,003 | 16 | % | 46,052 | 37,193 | 24 | % | |||||||||||||||||||||||||||
Cost of hardware revenue(1) | 10,682 | 11,700 | (9) | % | 24,867 | 30,491 | (18) | % | |||||||||||||||||||||||||||
Cost of advertising revenue(1) | 11,509 | 540 | 2,031 | % | 28,940 | 1,317 | 2,097 | % | |||||||||||||||||||||||||||
| Cost of other revenue | 1,667 | 1,119 | 49 | % | 4,904 | 3,316 | 48 | % | |||||||||||||||||||||||||||
Total cost of revenue(1) | 40,146 | 27,362 | 47 | % | 104,763 | 72,317 | 45 | % | |||||||||||||||||||||||||||
| Gross profit | 133,991 | 97,135 | 38 | % | 371,456 | 271,185 | 37 | % | |||||||||||||||||||||||||||
| Operating expenses: | |||||||||||||||||||||||||||||||||||
Research and development(1) | 40,609 | 32,410 | 25 | % | 127,279 | 95,071 | 34 | % | |||||||||||||||||||||||||||
Sales and marketing(1) | 59,320 | 39,024 | 52 | % | 168,657 | 113,205 | 49 | % | |||||||||||||||||||||||||||
General and administrative(1) | 26,091 | 20,010 | 30 | % | 75,684 | 53,037 | 43 | % | |||||||||||||||||||||||||||
Total operating expenses(1) | 126,020 | 91,444 | 38 | % | 371,620 | 261,313 | 42 | % | |||||||||||||||||||||||||||
| Income (loss) from operations | 7,971 | 5,691 | 40 | % | (164) | 9,872 | (102) | % | |||||||||||||||||||||||||||
| Other income (expense): | |||||||||||||||||||||||||||||||||||
| Gain on change in fair value of investments | 17,454 | 821 | 2,026 | % | 12,727 | 2,090 | 509 | % | |||||||||||||||||||||||||||
Interest income | 4,136 | 4,710 | (12) | % | 12,134 | 9,039 | 34 | % | |||||||||||||||||||||||||||
| Other expense, net | (1,107) | (1,002) | (10) | % | (4,064) | (3) | (135,367)% | ||||||||||||||||||||||||||||
| Total other income, net | 20,483 | 4,529 | 352 | % | 20,797 | 11,126 | 87 | % | |||||||||||||||||||||||||||
| Income before income taxes | 28,454 | 10,220 | 178 | % | 20,633 | 20,998 | (2) | % | |||||||||||||||||||||||||||
| Provision for (benefit from) income taxes | 5,964 | 427 | 1,297 | % | (9,697) | (179) | (5,317) | % | |||||||||||||||||||||||||||
| Net income | $ | 22,490 | $ | 9,793 | 130 | % | $ | 30,330 | $ | 21,177 | 43 | % | |||||||||||||||||||||||
| Change in foreign currency translation adjustment | 112 | 185 | (39) | % | 36 | 85 | (58) | % | |||||||||||||||||||||||||||
Unrealized loss on available-for-sale securities, net of tax | (23) | — | (100) | % | (82) | — | (100) | % | |||||||||||||||||||||||||||
| Total comprehensive income | $ | 22,579 | $ | 9,978 | 126 | % | $ | 30,284 | $ | 21,262 | 42 | % | |||||||||||||||||||||||
(1)Includes stock-based compensation expense as follows (in thousands, except percentages):
37
| Three Months Ended September 30, | Nine Months Ended September 30, | ||||||||||||||||||||||||||||||||||
| 2026 | 2025 | % Change | 2026 | 2025 | % Change | ||||||||||||||||||||||||||||||
| Cost of subscription revenue | $ | 512 | $ | 457 | 12 | % | $ | 1,527 | $ | 1,341 | 14 | % | |||||||||||||||||||||||
| Cost of hardware revenue | 370 | 406 | (9) | % | 989 | 1,080 | (8) | % | |||||||||||||||||||||||||||
Cost of advertising revenue | 152 | — | 100 | % | 432 | — | 100 | % | |||||||||||||||||||||||||||
| Total cost of revenue | 1,034 | 863 | 20 | % | 2,948 | 2,421 | 22 | % | |||||||||||||||||||||||||||
| Research and development | 9,093 | 7,282 | 25 | % | 26,582 | 20,772 | 28 | % | |||||||||||||||||||||||||||
| Sales and marketing | 3,141 | 2,063 | 52 | % | 8,542 | 5,436 | 57 | % | |||||||||||||||||||||||||||
| General and administrative | 6,882 | 4,658 | 48 | % | 21,154 | 11,356 | 86 | % | |||||||||||||||||||||||||||
Total stock-based compensation expense, net of amounts capitalized | $ | 20,150 | $ | 14,866 | 36 | % | $ | 59,226 | $ | 39,985 | 48 | % | |||||||||||||||||||||||
The following table sets forth our results of operations as a percentage of total revenue:
| Three Months Ended September 30, | Nine Months Ended September 30, | ||||||||||||||||||||||
| 2026 | 2025 | 2026 | 2025 | ||||||||||||||||||||
| Subscription revenue | 71 | % | 77 | % | 73 | % | 78 | % | |||||||||||||||
| Hardware revenue | 5 | % | 9 | % | 5 | % | 9 | % | |||||||||||||||
| Advertising revenue | 15 | % | 6 | % | 14 | % | 5 | % | |||||||||||||||
| Other revenue | 9 | % | 8 | % | 8 | % | 8 | % | |||||||||||||||
| Total revenue | 100 | % | 100 | % | 100 | % | 100 | % | |||||||||||||||
| Cost of subscription revenue | 9 | % | 11 | % | 10 | % | 11 | % | |||||||||||||||
| Cost of hardware revenue | 6 | % | 9 | % | 5 | % | 9 | % | |||||||||||||||
| Cost of advertising revenue | 7 | % | — | % | 6 | % | — | % | |||||||||||||||
| Cost of other revenue | 1 | % | 1 | % | 1 | % | 1 | % | |||||||||||||||
Total cost of revenue | 23 | % | 22 | % | 22 | % | 21 | % | |||||||||||||||
| Gross profit | 77 | % | 78 | % | 78 | % | 79 | % | |||||||||||||||
Operating expenses: | |||||||||||||||||||||||
| Research and development | 23 | % | 26 | % | 27 | % | 28 | % | |||||||||||||||
| Sales and marketing | 34 | % | 31 | % | 35 | % | 33 | % | |||||||||||||||
| General and administrative | 15 | % | 16 | % | 16 | % | 15 | % | |||||||||||||||
| Total operating expenses | 72 | % | 73 | % | 78 | % | 76 | % | |||||||||||||||
| Income (loss) from operations | 5 | % | 5 | % | — | % | 3 | % | |||||||||||||||
| Other income (expense): | |||||||||||||||||||||||
| Gain on change in fair value of investments | 10 | % | 1 | % | 3 | % | 1 | % | |||||||||||||||
| Interest income | 2 | % | 4 | % | 3 | % | 3 | % | |||||||||||||||
| Other expense, net | (1) | % | (1) | % | (1) | % | — | % | |||||||||||||||
| Total other income, net | 12 | % | 4 | % | 4 | % | 3 | % | |||||||||||||||
| Income before income taxes | 16 | % | 8 | % | 4 | % | 6 | % | |||||||||||||||
| Provision for (benefit from) income taxes | 3 | % | — | % | (2) | % | — | % | |||||||||||||||
| Net income | 13 | % | 8 | % | 6 | % | 6 | % | |||||||||||||||
| Change in foreign currency translation adjustment | — | % | — | % | — | % | — | % | |||||||||||||||
| Unrealized loss on available-for-sale securities, net of tax | — | % | — | % | — | % | — | % | |||||||||||||||
| Total comprehensive income | 13 | % | 8 | % | 6 | % | 6 | % | |||||||||||||||
38
Revenue
| Three Months Ended September 30, | Change | Nine Months Ended September 30, | Change | ||||||||||||||||||||||||||||||||||||||||||||
| 2026 | 2025 | $ | % | 2026 | 2025 | $ | % | ||||||||||||||||||||||||||||||||||||||||
| (in thousands, except percentages) | |||||||||||||||||||||||||||||||||||||||||||||||
| Subscription revenue | $ | 124,193 | $ | 96,300 | $ | 27,893 | 29 | % | $ | 348,023 | $ | 266,756 | $ | 81,267 | 30 | % | |||||||||||||||||||||||||||||||
| Hardware revenue | 8,996 | 11,312 | (2,316) | (20) | % | 23,328 | 32,485 | (9,157) | (28) | % | |||||||||||||||||||||||||||||||||||||
| Advertising revenue | 25,448 | 7,271 | 18,177 | 250 | % | 67,075 | 17,142 | 49,933 | 291 | % | |||||||||||||||||||||||||||||||||||||
| Other revenue | 15,500 | 9,614 | 5,886 | 61 | % | 37,793 | 27,119 | 10,674 | 39 | % | |||||||||||||||||||||||||||||||||||||
| Total revenue | $ | 174,137 | $ | 124,497 | $ | 49,640 | 40 | % | $ | 476,219 | $ | 343,502 | $ | 132,717 | 39 | % | |||||||||||||||||||||||||||||||
Subscription revenue increased $27.9 million, or 29%, during the three months ended September 30, 2026 as compared to the three months ended September 30, 2025, primarily due to a 26% growth in Paying Circles and an 18% growth in total subscriptions. Additionally, subscription revenue in the current period benefited from a 4% uplift in ARPPC. Please refer to the “Key Performance Indicators” section for definitions of key performance indicators (“KPIs”).
Hardware revenue decreased $2.3 million, or 20%, during the three months ended September 30, 2026 as compared to the three months ended September 30, 2025. The decline was primarily driven by a 32% decrease in Net hardware units shipped.
Advertising revenue increased $18.2 million, or 250%, during the three months ended September 30, 2026 as compared to the three months ended September 30, 2025. This was primarily driven by a $16.2 million increase in managed advertising, largely attributable to the acquisition of Nativo as well as an increase in spending from existing advertisers. Also attributable to Nativo were increases of $1.0 million in self-service advertising and $1.0 million in other advertising revenue. We expect advertising revenue to grow as we continue to expand advertiser relationships and increase advertising inventory across the Life360 platform.
Other revenue increased $5.9 million, or 61%, during the three months ended September 30, 2026 as compared to the three months ended September 30, 2025. This was due to a $4.3 million increase in partnership revenue, primarily driven by $3.7 million of revenue-share payments, which reflects the revised terms under the September 2026 amendments (the “2026 Related Party Amendments”). Refer to Note 14, "Related-Party Transactions" for more information. Data revenue also increased $1.6 million, primarily attributable to increased data volumes resulting from user growth.
Subscription revenue increased $81.3 million, or 30%, during the nine months ended September 30, 2026 as compared to the nine months ended September 30, 2025, primarily driven by a 26% growth in Paying Circles and 18% growth in total subscriptions. Additionally, subscription revenue in the current period benefited from a 6% uplift in ARPPC.
Hardware revenue decreased $9.2 million, or 28%, during the nine months ended September 30, 2026 as compared to the nine months ended September 30, 2025. The decline was primarily driven by a 25% decrease in Net hardware units shipped, primarily attributable to the strategic exit of the brick-and-mortar retail channel, and a $0.6 million reduction in revenue related to bundled offerings.
Advertising revenue increased $49.9 million, or 291%, during the nine months ended September 30, 2026 as compared to the nine months ended September 30, 2025. This was primarily driven by a $42.9 million increase in managed advertising, largely attributable to the acquisition of Nativo as well as an increase in spending from existing advertisers. Also attributable to the acquisition of Nativo, were increases of $3.2 million in self-service advertising, $3.1 million in other advertising revenue, and $0.7 million in programmatic advertising. We expect advertising revenue to grow as we continue to expand advertiser relationships and increase advertising inventory across the Life360 platform.
Other revenue increased $10.7 million, or 39%, during the nine months ended September 30, 2026 as compared to the nine months ended September 30, 2025. This was due to a $5.5 million increase in partnership revenue, primarily driven by revenue-share payments under the 2026 Related Party Amendments. Data revenue also increased $5.2 million, primarily attributable to increased data volumes resulting from user growth.
39
Cost of Revenue, Gross Profit, and Gross Margin
| Three Months Ended September 30, | Change | Nine Months Ended September 30, | Change | ||||||||||||||||||||||||||||||||||||||||||||
| 2026 | 2025 | $ | % | 2026 | 2025 | $ | % | ||||||||||||||||||||||||||||||||||||||||
| (in thousands, except percentages) | |||||||||||||||||||||||||||||||||||||||||||||||
| Cost of subscription revenue | $ | 16,288 | $ | 14,003 | $ | 2,285 | 16% | $ | 46,052 | $ | 37,193 | $ | 8,859 | 24% | |||||||||||||||||||||||||||||||||
| Cost of hardware revenue | 10,682 | 11,700 | (1,018) | (9)% | 24,867 | 30,491 | (5,624) | (18)% | |||||||||||||||||||||||||||||||||||||||
| Cost of advertising revenue | 11,509 | 540 | 10,969 | 2,031% | 28,940 | 1,317 | 27,623 | 2,097% | |||||||||||||||||||||||||||||||||||||||
| Cost of other revenue | 1,667 | 1,119 | 548 | 49% | 4,904 | 3,316 | 1,588 | 48% | |||||||||||||||||||||||||||||||||||||||
| Total cost of revenue | 40,146 | 27,362 | 12,784 | 47% | 104,763 | 72,317 | 32,446 | 45% | |||||||||||||||||||||||||||||||||||||||
| Gross profit | $ | 133,991 | $ | 97,135 | $ | 36,856 | 38% | $ | 371,456 | $ | 271,185 | $ | 100,271 | 37% | |||||||||||||||||||||||||||||||||
| Gross margin: | |||||||||||||||||||||||||||||||||||||||||||||||
| Subscription | 87% | 85% | 87% | 86% | |||||||||||||||||||||||||||||||||||||||||||
| Hardware | (19)% | (3)% | (7)% | 6% | |||||||||||||||||||||||||||||||||||||||||||
Advertising | 55% | 93% | 57% | 92% | |||||||||||||||||||||||||||||||||||||||||||
| Other | 89% | 88% | 87% | 88% | |||||||||||||||||||||||||||||||||||||||||||
Total | 77% | 78% | 78% | 79% | |||||||||||||||||||||||||||||||||||||||||||
Cost of subscription revenue increased $2.3 million, or 16%, during the three months ended September 30, 2026 as compared to the three months ended September 30, 2025, primarily due to increases of $1.1 million in technology expenses and $0.4 million in hosting costs, attributable to higher revenue and Company growth. In addition, costs associated with premium membership offerings increased $0.8 million.
Subscription gross margin increased to 87% during the three months ended September 30, 2026 from 85% during the three months ended September 30, 2025, primarily due to a shift in product mix toward higher-priced offerings.
Cost of hardware revenue decreased $1.0 million, or 9%, during the three months ended September 30, 2026 as compared to the three months ended September 30, 2025, primarily attributable to decreases of $1.1 million in tariff costs from reduced tariff rates, $0.4 million in hardware product costs related to the reduced number of Net hardware units shipped, and $0.3 million in personnel-related and stock-based compensation costs due to lower headcount associated with the Company’s transition to an AI-native organization. These were partially offset by a $0.8 million increase in other cost of hardware revenue related expenses.
Hardware gross margin decreased to (19)% during the three months ended September 30, 2026 from (3)% during the three months ended September 30, 2025, primarily due to a shift in product mix, which was partially offset by lower tariff costs. We continue to prioritize hardware as a driver of subscription growth by optimizing pricing and bundling to increase subscription attachment over standalone hardware margin.
Cost of advertising revenue increased $11.0 million, or 2,031%, during the three months ended September 30, 2026 as compared to the three months ended September 30, 2025. The increase was primarily due to increases of $5.1 million in traffic acquisition costs, which is in line with the managed advertising revenue, $2.8 million in hosting costs, $1.7 million in personnel-related and stock-based compensation costs, $1.0 million in third-party data and content licensing costs, and $0.4 million in amortization of acquired technology, attributable to the acquisition of Nativo.
Advertising gross margin decreased to 55% during the three months ended September 30, 2026 from 93% during the three months ended September 30, 2025, primarily due to higher costs associated with our expanded advertising platform following the acquisition of Nativo, resulting in a shift in margin mix relative to our existing advertising offerings.
Cost of other revenue increased $0.5 million, or 49%, during the three months ended September 30, 2026 as compared to the three months ended September 30, 2025, due to an increase of $0.5 million in hosting costs to support growth in our data business.
Other gross margin increased to 89% during the three months ended September 30, 2026 from 88% during the three months ended September 30, 2025, primarily driven by an increase in other revenue related to revenue-share payments under the 2026 Related Party Amendments.
40
Cost of subscription revenue increased $8.9 million, or 24%, during the nine months ended September 30, 2026 as compared to the nine months ended September 30, 2025, primarily due to increases of $3.1 million in technology expenses, $1.8 million in hosting costs, $0.7 million in personnel-related and stock-based compensation costs, and $0.5 million in amortization of internally developed software related to the release of new features and significant updates on our platform, all attributable to Company growth. In addition, costs associated with premium membership offerings increased $2.8 million.
Subscription gross margin increased to 87% during the nine months ended September 30, 2026 from 86% during the nine months ended September 30, 2025, primarily due to a shift in product mix toward higher-priced offerings.
Cost of hardware revenue decreased by $5.6 million, or 18%, during the nine months ended September 30, 2026 as compared to the nine months ended September 30, 2025, primarily due to a $3.6 million benefit from the receipt of tariff refund claims and a $1.4 million decrease in tariff costs from reduced tariff rates. Also contributing were decreases of $0.7 million in personnel-related and stock-based compensation costs due to lower headcount associated with the Company’s transition to an AI-native organization, and $0.3 million in hardware product and freight costs, related to the reduced number of Net hardware units shipped. These decreases were partially offset by a $0.4 million increase in other cost of hardware revenue related expenses.
Hardware gross margin decreased to (7)% during the nine months ended September 30, 2026 from 6% during the nine months ended September 30, 2025, primarily due to a shift in product mix and a decline in hardware revenue from the Company’s strategic exit of the brick-and-mortar retail channel. We continue to prioritize hardware as a driver of subscription growth by optimizing pricing and bundling to increase subscription attachment over standalone hardware margin.
Cost of advertising revenue increased $27.6 million, or 2,097%, during the nine months ended September 30, 2026 as compared to the nine months ended September 30, 2025. The increase was primarily due to increases of $11.4 million in traffic acquisition costs, $8.0 million in hosting costs, $4.7 million in personnel-related and stock-based compensation costs, $2.3 million in third-party data and content licensing costs, and $1.2 million in amortization of acquired technology, all attributable to the acquisition of Nativo.
Advertising gross margin decreased to 57% during the nine months ended September 30, 2026 from 92% during the nine months ended September 30, 2025, primarily due to higher costs associated with our expanded advertising platform following the acquisition of Nativo, resulting in a shift in margin mix relative to our existing advertising offerings.
Cost of other revenue increased $1.6 million, or 48%, during the nine months ended September 30, 2026 as compared to the nine months ended September 30, 2025, due to an increase of $1.6 million in hosting costs to support growth in our data business.
Other gross margin decreased to 87% during the nine months ended September 30, 2026 from 88% during the nine months ended September 30, 2025, primarily due to higher hosting costs to support growth in our data business.
Research and development
| Three Months Ended September 30, | Change | Nine Months Ended September 30, | Change | ||||||||||||||||||||||||||||||||||||||||||||
| 2026 | 2025 | $ | % | 2026 | 2025 | $ | % | ||||||||||||||||||||||||||||||||||||||||
| (in thousands, except percentages) | |||||||||||||||||||||||||||||||||||||||||||||||
| Research and development | $ | 40,609 | $ | 32,410 | $ | 8,199 | 25 | % | $ | 127,279 | $ | 95,071 | $ | 32,208 | 34 | % | |||||||||||||||||||||||||||||||
Research and development expenses increased $8.2 million, or 25%, during the three months ended September 30, 2026 as compared to the three months ended September 30, 2025, primarily due to a $3.7 million increase in personnel-related and stock-based compensation costs, including those related to the acquisition of Nativo, a $2.1 million increase in technology and other expenses due to Company growth, and a $1.6 million increase in usage-based fees for third-party AI tools. Also contributing were a $0.5 million decrease in capitalized construction in progress costs, in line with the Company’s product development roadmap, and $0.3 million of Nativo integration costs.
41
Research and development expenses increased $32.2 million, or 34%, during the nine months ended September 30, 2026 as compared to the nine months ended September 30, 2025, primarily due to increases of $16.2 million in personnel-related and stock-based compensation costs, including those related to the acquisition of Nativo, a $6.7 million increase in technology and other costs due to Company growth, and a $3.0 million increase in usage-based fees for third-party AI tools. Also contributing were a $1.9 million decrease in capitalized construction in progress costs, in line with the Company’s product development roadmap, a $1.7 million increase in workplace restructuring costs associated with the Company’s transition to an AI-native organization, a $1.6 million increase in professional and outside services, $0.6 million of Nativo integration costs, and $0.5 million of lower capitalized internally developed software costs.
Sales and Marketing
| Three Months Ended September 30, | Change | Nine Months Ended September 30, | Change | ||||||||||||||||||||||||||||||||||||||||||||
| 2026 | 2025 | $ | % | 2026 | 2025 | $ | % | ||||||||||||||||||||||||||||||||||||||||
| (in thousands, except percentages) | |||||||||||||||||||||||||||||||||||||||||||||||
| Sales and marketing | $ | 59,320 | $ | 39,024 | $ | 20,296 | 52 | % | $ | 168,657 | $ | 113,205 | $ | 55,452 | 49 | % | |||||||||||||||||||||||||||||||
Sales and marketing expenses increased $20.3 million, or 52%, during the three months ended September 30, 2026 as compared to the three months ended September 30, 2025. This was primarily due to increases of $8.8 million in personnel-related and stock-based compensation costs and $1.8 million in amortization of acquired intangible assets, each primarily attributable to the acquisition of Nativo. Additional increases include $5.0 million in commissions to the Company’s Channel Partners, in line with the increase in subscription revenue, $4.1 million in growth media and other marketing costs due to the planned timing of spend to support strategic initiatives, and $0.6 million in technology and other expenses, attributable to Company growth.
Sales and marketing expenses increased $55.5 million, or 49%, during the nine months ended September 30, 2026 as compared to the nine months ended September 30, 2025. This was primarily due to increases of $19.8 million in personnel-related and stock-based compensation costs and $5.3 million in amortization of acquired intangible assets, each primarily attributable to the acquisition of Nativo. Additional increases include $15.0 million in commissions to the Company’s Channel Partners, in line with the increase in subscription revenue, $11.8 million in growth media and other marketing costs to support strategic initiatives, $2.6 million in technology and other expenses attributable to Company growth, $0.6 million in Nativo integration costs, and $0.4 million in severance costs related to the strategic exit of the brick-and-mortar retail channel.
General and Administrative
| Three Months Ended September 30, | Change | Nine Months Ended September 30, | Change | ||||||||||||||||||||||||||||||||||||||||||||
| 2026 | 2025 | $ | % | 2026 | 2025 | $ | % | ||||||||||||||||||||||||||||||||||||||||
| (in thousands, except percentages) | |||||||||||||||||||||||||||||||||||||||||||||||
| General and administrative | $ | 26,091 | $ | 20,010 | $ | 6,081 | 30 | % | $ | 75,684 | $ | 53,037 | $ | 22,647 | 43 | % | |||||||||||||||||||||||||||||||
General and administrative expenses increased $6.1 million, or 30%, during the three months ended September 30, 2026 as compared to the three months ended September 30, 2025. This was primarily due to increases of $3.9 million in personnel-related and stock-based compensation costs, $1.6 million in travel and entertainment costs for the Company’s annual event, and $0.6 million in technology and other expenses, all attributable to Company growth.
General and administrative expenses increased $22.6 million, or 43%, during the nine months ended September 30, 2026 as compared to the nine months ended September 30, 2025. This was primarily due to increases of $16.6 million in personnel-related and stock-based compensation costs, $2.4 million in travel and entertainment costs for the Company’s annual event, and $1.7 million in technology and other expenses, all attributable to Company growth. Additional increases include $1.2 million in warehouse relocation costs related to the move of certain hardware manufacturing operations and $0.7 million in Nativo integration costs.
42
Gain on Change in Fair Value of Investments
In April 2025, an observable price change related to the conversion of the Related Party SAFE into the Related Party Investment took place. As a result, a $0.9 million gain related to the observable price change was recognized during the nine months ended September 30, 2025. In August 2026, an observable price change in the Related Party Investment occurred, resulting in a $17.8 million gain during the three and nine months ended September 30, 2026. Refer to Note 14, "Related-Party Transactions" for more information.
In May 2025, the Company entered into the $25.0 million Convertible Note Investment and elected to apply the fair value option in accordance with ASC 825, Financial Instruments. As a result, a loss related to the revaluation of the Convertible Note Investment of $0.4 million and $5.1 million was recognized during the three and nine months ended September 30, 2026, respectively, compared to a gain of $0.8 million and $1.2 million for the three and nine months ended September 30, 2025, respectively.
Interest Income
Interest income decreased $0.6 million, or 12%, during the three months ended September 30, 2026 as compared to the three months ended September 30, 2025, primarily due to a decrease in average interest-earning cash equivalents and short-term investment balances.
Interest income increased $3.1 million, or 34%, during the nine months ended September 30, 2026 as compared to the nine months ended September 30, 2025, resulting from higher average gross yields and higher amortization of discounts on increased cash and cash equivalents and short-term investment balances.
Other Expense, Net
Other expense, net increased $0.1 million, or 10%, during the three months ended September 30, 2026 as compared to the three months ended September 30, 2025. This was primarily driven by a $0.3 million increase in interest expense related to the deferred purchase price liability from the acquisition of Nativo. The increase was partially offset by a $0.2 million decrease in foreign exchange losses. Refer to Note 7, "Business Combinations" and Note 8, "Balance Sheet Components" for additional information on the acquisition of Nativo and the related deferred purchase price liability.
Other expense, net increased $4.1 million, or 135,367%, during the nine months ended September 30, 2026 as compared to the nine months ended September 30, 2025. This was primarily driven by a $1.4 million increase in foreign exchange losses, a $1.3 million loss related to the monetization of tariff refunds, a $0.9 million increase in interest expense related to the June 2025 Convertible Notes, and a $0.5 million increase in interest expense related to the deferred purchase price liability from the acquisition of Nativo.
Provision for (benefit from) Income Taxes
Provision for income taxes increased $5.5 million during the three months ended September 30, 2026, as compared to the three months ended September 30, 2025, primarily due to changes in the Company's annual estimated effective tax rate because the Company no longer maintains a full valuation allowance on its U.S. deferred tax assets, partially offset by discrete tax benefits. For the three months ended September 30, 2026, we recorded a total income tax provision of $6.0 million, consisting of a $12.0 million expense based on the annual estimated effective tax rate, primarily reflecting income before income taxes for the period, offset by $6.0 million of discrete tax benefits, primarily related to stock-based compensation.
Benefit from income taxes increased $9.5 million during the nine months ended September 30, 2026, as compared to the nine months ended September 30, 2025, primarily because the Company no longer maintains a full valuation allowance on its U.S. deferred tax assets and to discrete tax benefits. For the nine months ended September 30, 2026, we recorded a total income tax benefit of $9.7 million, consisting of an $8.1 million expense based on the annual estimated effective tax rate, primarily reflecting income before income taxes for the period, more than offset by $17.8 million of discrete tax benefits, primarily related to stock-based compensation.
43
The annual estimated effective tax rate in any quarter may be subject to fluctuations during the year as new information is obtained, which may positively or negatively affect the assumptions used to estimate the annual effective tax rate. We maintain a full valuation allowance on our California state tax credits and Canadian Scientific Research and Experimental Development credits as we have concluded that it is not more likely than not that the deferred tax assets will be realized.
Key Performance Indicators
We review several operating metrics, including the following KPIs, to evaluate our business, measure our performance, identify trends affecting our business, develop financial forecasts, and make strategic decisions. We believe these KPIs are useful to investors because they allow for greater transparency with respect to key metrics used by management in its financial and operational decision-making, and they may be used by investors to help analyze the health of our business. KPIs are presented in millions, except ARPPC, Average Revenue per Paying Subscription (“ARPPS”) and net Average Selling Price (“ASP”); however, percentage changes are calculated based on actual results. As a result, percentage changes may not recalculate based on figures presented due to rounding. Please refer to “Results of Operations” for additional metrics management reviews in conjunction with the condensed consolidated financial statements.
Key Performance Indicators
| As of and for the Three Months Ended September 30, | As of and for the Nine Months Ended September 30, | ||||||||||||||||||||||||||||||||||
| 2026 | 2025 | % Change | 2026 | 2025 | % Change | ||||||||||||||||||||||||||||||
| (in millions, except ARPPC, ARPPS and ASP) | |||||||||||||||||||||||||||||||||||
| AMR | $ | 578.0 | $ | 446.7 | 29 | % | $ | 578.0 | $ | 446.7 | 29 | % | |||||||||||||||||||||||
| MAUs | 107.7 | 91.6 | 17 | % | 107.7 | 91.6 | 17 | % | |||||||||||||||||||||||||||
| Paying Circles | 3.4 | 2.7 | 26 | % | 3.4 | 2.7 | 26 | % | |||||||||||||||||||||||||||
ARPPC(1) | $ | 143.56 | $ | 137.63 | 4 | % | $ | 143.31 | $ | 135.05 | 6 | % | |||||||||||||||||||||||
| Subscriptions | 3.9 | 3.3 | 18 | % | 3.9 | 3.3 | 18 | % | |||||||||||||||||||||||||||
ARPPS(1) | $ | 130.50 | $ | 119.33 | 9 | % | $ | 128.76 | $ | 115.97 | 11 | % | |||||||||||||||||||||||
| Net hardware units shipped | 0.6 | 0.9 | (32) | % | 1.7 | 2.3 | (25) | % | |||||||||||||||||||||||||||
ASP(2) | $ | 14.11 | $ | 11.99 | 18 | % | $ | 13.84 | $ | 14.12 | (2) | % | |||||||||||||||||||||||
(1) Excludes revenue related to bundled Life360 subscription and hardware offerings, which was immaterial and $(0.1) million for the three and nine months ended September 30, 2026, and $(0.1) million and $(0.8) million for the three and nine months ended September 30, 2025, respectively.
(2) Excludes revenue related to bundled Life360 subscription and hardware offerings, which was immaterial and $0.1 million for the three and nine months ended September 30, 2026, and $0.1 million and $0.7 million for the three and nine months ended September 30, 2025, respectively.
Annualized Monthly Revenue
We use Annualized Monthly Revenue (“AMR”) to identify the annualized monthly value of active customer agreements at the end of a reporting period. AMR includes the annualized monthly value of subscription, data and partnership agreements. All components of these agreements that are not expected to recur are excluded. This does not represent revenue under GAAP on an annualized basis, as the operating metric can be impacted by start and end dates and renewal rates. AMR as of September 30, 2026, and 2025 was $578.0 million and $446.7 million, respectively, representing an increase of 29% year-over-year, which is largely attributable to continued subscriber growth and an increase in other recurring revenue.
Monthly Active Users
We have a large and growing global member base as of September 30, 2026. A Life360 Monthly Active User (“MAU”) is defined as a unique member who engages with our Life360 branded services each month, which includes both paying and non-paying members, and excludes certain members who have a delayed account setup. As of September 30, 2026 and 2025, we had approximately 107.7 million and approximately 91.6 million MAUs on the Life360 platform, respectively, representing an increase of 17% year-over-year. We believe this has been driven by continued new member growth and retention.
44
MAU growth trends for the three months ended September 30, 2026 remain consistent with the Company's previously disclosed full-year 2026 MAU growth expectation of approximately 17% to 20%, which reflected the impact of the Android-related registration issues disclosed and resolved earlier in the year.
Paying Circles
We define a Paying Circle as a group of Life360 members with a paying subscription who have been billed as of the end of period. Each subscription covers all members in the payor’s Circle so everyone in the Circle can utilize the benefits of a Life360 membership, including access to premium location, driving, digital and emergency safety insights and services.
As of September 30, 2026 and 2025, we had approximately 3.4 million and 2.7 million paid subscribers to services under our Life360 brand, respectively, representing an increase of 26% year-over-year. We grow the number of Paying Circles by increasing our free member base, converting free members to subscribers, and retaining them over time with the provision of high-quality family connectivity and safety services.
Average Revenue per Paying Circle
We define ARPPC as annualized subscription revenue recognized and derived from the Life360 mobile application, excluding revenue related to bundled Life360 subscription and hardware offerings, for the reported period, divided by the Average Paying Circles during the same period. Average Paying Circles are calculated by adding the number of Paying Circles as of the beginning of the period to the number of Paying Circles as of the end of the period, and then dividing by two.
For the three months ended September 30, 2026 and 2025, our ARPPC was $143.56 and $137.63, respectively, representing a 4% increase year-over-year. For the nine months ended September 30, 2026 and 2025, our ARPPC was $143.31 and $135.05, respectively, representing a 6% increase year-over-year.
ARPPC is a key indicator utilized by the Company to determine our effectiveness at monetizing Paying Circles through tiered product offerings. The year-over-year growth in ARPPC for the three months ended September 30, 2026, primarily reflects a shift in product mix toward higher-priced offerings and U.S. price increases in September 2026. The year-over-year growth in ARPPC for the nine months ended September 30, 2026, primarily reflects a shift in product mix toward higher-priced offerings and price increases for international users throughout 2025.
Subscriptions
We define Subscriptions as the number of paying subscribers associated with the Life360 and Tile brands who have been billed as of the end of the period.
As of September 30, 2026 and 2025, we had approximately 3.9 million and 3.3 million paid subscribers, respectively, to services under the Life360 and Tile brands, representing an increase of 18% year-over-year.
We have grown the number of Subscriptions by selling hardware units and increasing our free member base, converting free members to subscribers, and retaining them over time with the provision of location tracking and high-quality family and safety services.
Average Revenue per Paying Subscription
We define ARPPS as annualized total subscription revenue recognized and derived from Life360 and Tile subscriptions, excluding revenue related to bundled Life360 subscription and hardware offerings, for the reported period divided by the average number of paying subscribers during the same period. The average number of paying subscribers is calculated by adding the number of paying subscribers as of the beginning of the period to the number of paying subscribers as of the end of the period, and then dividing by two. Paying subscribers represent subscribers who have been billed as of the end of the period.
ARPPS for the three months ended September 30, 2026 and 2025 was $130.50 and $119.33, respectively, representing an increase of 9% year-over-year. ARPPS for the nine months ended September 30, 2026 and 2025 was $128.76 and $115.97, respectively, representing an increase of 11% year-over-year.
45
The year-over-year growth in ARPPS for the three and nine months ended September 30, 2026, primarily reflects a shift in product mix toward higher-priced offerings.
Net Hardware Units Shipped
Net hardware units shipped represents the number of tracking devices sold during a period, excluding certain hardware units related to bundled Life360 subscription and hardware offerings, net of returns by our retail partners and direct consumers. Selling units contributes to hardware revenue and ultimately increases the number of members eligible for a subscription.
For the three months ended September 30, 2026 and 2025, we sold approximately 0.6 million units and 0.9 million units, respectively, representing a decrease of 32% year-over-year. For the nine months ended September 30, 2026 and 2025, we sold approximately 1.7 million units and 2.3 million units, respectively, representing a decrease of 25% year-over-year.
The decrease in Net hardware units shipped was primarily due to the strategic exit of the brick-and-mortar retail channel and a decrease in online retail sales.
Net Average Selling Price
To determine the ASP of a unit, we divide hardware revenue recognized, excluding revenue related to bundled Life360 subscription and hardware offerings, for the reported period by the number of Net hardware units shipped during the same period. ASP is largely driven by the price we charge customers, including the price we charge our retail partners, net of customer allowances, and directly to consumers.
For the three months ended September 30, 2026 and 2025, the ASP per unit was $14.11 and $11.99, respectively, representing an increase of 18% year-over-year. For the nine months ended September 30, 2026 and 2025, the ASP per unit was $13.84 and $14.12, respectively, representing a decrease of 2% year-over-year. The increase in ASP for the three months ended September 30, 2026, was primarily driven by changes in channel mix and a decrease in discounts. The decrease in ASP for the nine months ended September 30, 2026, was primarily due to changes in channel mix, including the strategic exit of the brick-and-mortar retail channel.
Liquidity and Capital Resources
As of September 30, 2026, we had $465.0 million in cash and cash equivalents, restricted cash, and short-term investments. As of December 31, 2025, we had $495.8 million in cash and cash equivalents and restricted cash, with no short-term investments.
We believe our existing cash and cash equivalents and short-term investments, together with cash generated from subscriptions, hardware tracking devices, advertising activities, and partnerships, including the sale of aggregated, non-personally identifiable data for data insight purposes, will be sufficient to support working capital and capital expenditure requirements in line with our capital deployment strategy for the next 12 months. We may from time to time seek to raise additional capital based on a variety of factors, including our capital requirements and the relative favorability of conditions in the capital markets. If we are unable to raise additional capital on terms acceptable to us or generate cash flows necessary to expand our operations and invest in continued innovation, we may not be able to compete successfully, which would harm our business, financial condition, and results of operations. Beyond the next 12 months, our principal long-term capital commitment is the repayment or settlement of our $320.0 million aggregate principal amount of June 2025 Convertible Notes, with any principal portion settled in cash. We also expect to use cash to repurchase shares under our Share Repurchase Program, of which $180.6 million remained available as of September 30, 2026. Refer to Note 9, "Convertible Notes" and Note 11, "Common and Treasury Stock" for additional information.
46
Cash Flows
Our cash flow activities were as follows for the periods presented:
| Nine Months Ended September 30, | |||||||||||
| 2026 | 2025 | ||||||||||
| (in thousands) | |||||||||||
| Net cash provided by operating activities | $ | 68,152 | $ | 51,830 | |||||||
| Net cash used in investing activities | (190,579) | (33,928) | |||||||||
| Net cash provided by (used in) financing activities | (37,621) | 278,866 | |||||||||
| Net Increase (Decrease) in Cash, Cash Equivalents, and Restricted Cash | $ | (160,048) | $ | 296,768 | |||||||
Operating Activities
Our primary sources of operating cash are cash collections from our paying members for subscriptions to our platform, hardware tracking device sales, advertising revenue, and other revenue, which includes partnership revenue and revenue generated from the sale of aggregated, non-personally identifiable data for data insight purposes. Our primary uses of cash from operating activities are for employee-related expenditures, costs to acquire inventory, infrastructure-related costs, commissions paid to Channel Partners, and marketing expenses.
A number of our members pay in advance for annual subscriptions, while a majority pay in advance for monthly subscriptions. Deferred revenue consists of the unearned portion of customer billings, which is recognized as revenue in accordance with our revenue recognition policy. As of September 30, 2026 and December 31, 2025, we had deferred revenue of $65.3 million and $50.7 million, respectively, of which $54.4 million and $46.4 million is expected to be recorded as revenue in the following 12 months, provided all other revenue recognition criteria have been met.
For the nine months ended September 30, 2026, net cash provided by operating activities was $68.2 million. The primary factors affecting our operating cash flows during this period were our net income of $30.3 million, impacted by $55.4 million of non-cash adjustments, and $17.5 million of cash used by changes in our operating assets and liabilities. The non-cash adjustments primarily consist of stock-based compensation, depreciation and amortization, deferred income taxes, and a gain on the change in fair value of investments. The cash used by changes in our operating assets and liabilities was primarily due to decreases in accrued expenses and other current liabilities and accounts payable, as well as increases in inventory, costs capitalized to obtain contracts, net, and prepaid expenses and other current assets. This was partially offset by a decrease in accounts receivable and an increase in deferred revenue.
For the nine months ended September 30, 2025, net cash provided by operating activities was $51.8 million. The primary factors affecting our operating cash flows during this period were our net income of $21.2 million, impacted by $49.6 million of non-cash adjustments, and $18.9 million of cash used by changes in our operating assets and liabilities. The non-cash adjustments primarily consist of stock-based compensation and depreciation and amortization. The cash used by changes in our operating assets and liabilities was primarily due to a decrease in accrued expenses and other current liabilities, as well as increases in prepaid expenses and other current assets, accounts receivable, and inventory. These cash outflows were offset by an increase in deferred revenue and accounts payable.
Investing Activities
For the nine months ended September 30, 2026, net cash used in investing activities was $190.6 million, which was primarily related to the $260.4 million purchase of short-term investments and $57.1 million primarily related to the acquisition of Nativo, partially offset by $131.9 million of proceeds from sales and maturities of short-term investments. Refer to Note 7, "Business Combinations" for additional information on the acquisition of Nativo. Net cash used in investing activities also included capitalization of internally developed software costs in accordance with ASC 350-40, Intangibles - Goodwill and Other, Internal-Use Software.
For the nine months ended September 30, 2025, net cash used in investing activities was $33.9 million, which primarily related to the $25.0 million Convertible Note Investment. Net cash used in investing activities also included capitalization of internally developed software costs in accordance with ASC 350-40, Intangibles - Goodwill and Other, Internal-Use Software, and cash paid for an acquisition.
47
Financing Activities
For the nine months ended September 30, 2026, net cash used in financing activities was $37.6 million, which was primarily driven by $44.4 million of payments for the purchase of treasury stock, $40.9 million of taxes paid for the net settlement of equity awards and the $0.7 million indemnity escrow payment related to the Fantix acquisition. The cash payments were partially offset by $48.4 million of proceeds related to tax withholdings on restricted stock settlements and the exercise of stock options and warrants.
For the nine months ended September 30, 2025, net cash provided by financing activities was $278.9 million, which was primarily related to proceeds of $320.0 million from the issuance of the June 2025 Convertible Notes offset by payments of $10.9 million for debt issuance costs. In connection with the issuance of the June 2025 Convertible Notes, the Company paid $33.7 million in capped call transactions. Refer to Note 9, "Convertible Notes" for more information on the June 2025 Convertible Notes and the June 2025 Capped Calls. Financing activities also included $47.3 million of taxes paid for the net settlement of equity awards, offset by $50.8 million of proceeds related to tax withholdings on restricted stock settlements and the exercise of stock options and warrants.
Share Repurchase Program
In May 2026, the Company’s Board of Directors authorized a share repurchase program allowing the deployment of up to $225.0 million to repurchase the Company’s outstanding common stock (the “Repurchase Program”). The Repurchase Program has no expiration date, does not obligate the Company to acquire a specific number of shares, and may be modified, suspended, or discontinued at any time. Repurchases may be made from time to time in the open market, in privately-negotiated transactions, in block trades, and/or through Rule 10b5-1 trading plans and Rule 10b-18 transactions depending on market conditions and applicable rules and regulations.
During the three months ended September 30, 2026, we repurchased 666,336 shares of common stock for an aggregate purchase price of $31.2 million, including commissions. During the nine months ended September 30, 2026, we repurchased 981,098 shares of common stock for an aggregate purchase price of $44.4 million, including commissions. As of September 30, 2026, $180.6 million remained available under the Repurchase Program.
Obligations and Other Commitments
Our principal commitments consist of obligations under our operating leases for office space, and other purchase commitments. Information regarding our non-cancellable lease and other purchase commitments as of September 30, 2026, can be found in Note 8, "Balance Sheet Components" and Note 10, "Commitments and Contingencies" to our condensed consolidated financial statements.
Critical Accounting Policies and Significant Management Estimates
We prepare our condensed consolidated financial statements in accordance with GAAP. The preparation of condensed consolidated financial statements also requires us to make estimates and assumptions that affect the reported amounts of assets, liabilities, revenues, costs and expenses, and related disclosures. We base our estimates on historical experience and on various other assumptions that we believe to be reasonable under the circumstances. Actual results could differ significantly from the estimates made by our management. To the extent that there are differences between our estimates and actual results, our future financial statement presentation, financial condition, results of operations, and cash flows will be affected. Our significant accounting policies are discussed in Note 2, "Summary of Significant Accounting Policies" in our Annual Report. There were no significant changes to these policies during the nine months ended September 30, 2026.
48
Item 3. Quantitative and Qualitative Disclosures About Market Risk
We are exposed to market risk in the ordinary course of our business. Market risk represents the risk of loss that may impact our financial position due to adverse changes in financial market prices and rates. Our market risk exposure is primarily the result of fluctuations in interest rates and foreign currency exchange rates.
Interest Rate Risk
As of September 30, 2026, we had $252.7 million of cash equivalents invested in money market funds and U.S. Treasury securities. In addition, we held $129.2 million of U.S. Treasury securities classified as available-for-sale securities. As of December 31, 2025, we had $332.8 million of cash equivalents invested in money market funds and no U.S. Treasury securities.
Our cash and cash equivalents are held for working capital purposes. The U.S. Treasury securities have contractual maturities of less than one year. Available-for-sale securities are recorded at fair value, with unrealized gains and losses recorded in accumulated other comprehensive income.
As of September 30, 2026 and December 31, 2025, a hypothetical 10% relative change in interest rates would not have a material impact on our condensed consolidated financial statements.
Foreign Currency Exchange Risk
Our reporting currency and functional currency is the U.S. dollar. The majority of our sales are denominated in U.S. dollars, and therefore our revenue is not currently subject to significant foreign currency risk. Our operating expenses are denominated in the currencies of the countries in which our operations are located, which is primarily in the U.S. Our condensed consolidated results of operations and cash flows are, therefore, subject to fluctuations due to changes in foreign currency exchange rates and may be adversely affected in the future due to changes in foreign exchange rates. To date, we have not entered into any active hedging arrangements with respect to foreign currency risk or other derivative financial instruments, although we may choose to do so in the future. We do not believe that a hypothetical 1,000 basis-point increase or decrease in the relative value of the U.S. dollar to other currencies would have a material effect on our operating results.
Inflation Risk
We do not believe that inflation has had a material effect on our business, results of operations, or financial condition. Nonetheless, if our costs were to become subject to significant inflationary pressures, we may not be able to fully offset such higher costs. Our inability or failure to do so could harm our business, results of operations, or financial condition.
Item 4. Controls and Procedures
Evaluation of Disclosure Controls and Procedures
Our management, with the participation of our Chief Executive Officer and Chief Financial Officer, evaluated the effectiveness of our disclosure controls and procedures as of September 30, 2026 pursuant to Rule 13a‑15 under the Securities Exchange Act of 1934, as amended (the “Exchange Act”). The term “disclosure controls and procedures” means controls and other procedures of a company that are designed to ensure that information required to be disclosed by a company in the reports that it files or submits under the Exchange Act is recorded, processed, summarized, and reported within the time periods specified in the SEC’s rules and forms. Disclosure controls and procedures include, without limitation, controls and procedures designed to ensure that information required to be disclosed by a company in the reports that it files or submits under the Exchange Act is accumulated and communicated to the Company’s management, including its principal executive and principal financial officers, as appropriate to allow timely decisions regarding required disclosure. Based on such evaluation, our management concluded that our disclosure controls and procedures were effective as of September 30, 2026.
Changes in Internal Control over Financial Reporting
There were no changes in our internal control over financial reporting identified in connection with the evaluation required by Rule 13a-15(d) and 15d-15(d) of the Exchange Act that occurred during the three months ended September 30, 2026 that have materially affected, or are reasonably likely to materially affect, our internal control over financial reporting.
49
Limitations on the Effectiveness of Controls and Procedures
Our management, including our Chief Executive Officer and Chief Financial Officer, does not expect that our disclosure controls and procedures or our internal controls over financial reporting will prevent all errors and all fraud. A control system, no matter how well designed and implemented, can provide only reasonable, not absolute, assurance that the objectives of the control system will be met. Further, the design of a control system must reflect the fact that there are resource constraints and the benefits of controls must be considered relative to their costs. Because of the inherent limitations in all control systems, no evaluation of controls can provide absolute assurance that all control issues within a company are detected. The inherent limitations include the realities that judgments in decision-making can be faulty and that breakdowns can occur because of simple errors or mistakes. Controls can also be circumvented by the individual acts of some persons, by collusion of two or more people, or by management override of the controls. Also, projections of any evaluation of effectiveness to future periods are subject to the risk that controls may become inadequate because of changes in conditions or that the degree of compliance with the policies or procedures may deteriorate. Because of the inherent limitations in a cost-effective control system, misstatements due to error or fraud may occur and may not be detected.
50
PART II - OTHER INFORMATION
Item 1. Legal Proceedings
From time to time, we may be and have been involved in legal proceedings, claims, and government investigations in the ordinary course of business. We have received, and may in the future continue to receive, inquiries from regulators regarding our compliance with law and regulations, including those related to data protection and consumer rights, and due to the nature of our business and the rapidly evolving landscape of laws relating to data privacy, cybersecurity, consumer protection, and data use, we expect to continue to be the subject of regulatory investigations and inquiries in the future. We have received, and may in the future continue to receive, claims from third parties relating to information or content that is published or made available on our platform, among other types of claims including those relating to, among other things, regulatory matters, commercial matters, intellectual property, competition, tax, employment, pricing, discrimination, and consumer rights. Future litigation may be necessary to defend ourselves, our partners, and our customers by determining the scope, enforceability, and validity of these claims. The results of any current or future regulatory inquiry or litigation cannot be predicted with certainty, and regardless of the outcome, such investigations and litigation can have an adverse impact on us because of defense and settlement costs, diversion of management resources, the potential for enforcement orders or settlements to impose operational restrictions or obligations on our business practices, and other factors.
The information set forth under Note 10, "Commitments and Contingencies" in the notes to the condensed consolidated financial statements under the caption “Litigation and Arbitration” is incorporated herein by reference.
Item 1A. Risk Factors
Except as set forth below, there have been no material changes to the risk factors set forth under the heading “Risk Factors” in Part I, Item 1A of our Annual Report on Form 10-K for the year ended December 31, 2025, and Part II, Item 1A of our Quarterly Report on Form 10-Q for the quarter ended June 30, 2026 (together, the “Prior Reports”). An investment in shares of our common stock involves a high degree of risk. You should carefully consider the risks and uncertainties described in the Prior Reports, together with the other information included in this Quarterly Report, including our unaudited condensed consolidated financial statements and related notes, and any other documents we file with the SEC before deciding to invest in our common stock. The occurrence of any of these risks could materially adversely affect our business, financial condition, results of operations, and future growth prospects, or cause our actual results to differ materially from those expressed or implied by forward-looking statements in this Quarterly Report or made from time to time. In such circumstances, the market price of our common stock could decline, and you could lose all or part of your investment. We cannot assure you that any of the risks described in the Prior Reports will not occur.
If our information technology systems or data, or those of third parties upon which we rely, are or were compromised, we could experience adverse consequences resulting from such compromise, including but not limited to regulatory investigations or actions; litigation (including class action or similar lawsuits); fines and penalties; disruptions of our business operations; reputational harm; loss of revenue or profits; and other adverse consequences
We and the third parties upon which we rely process proprietary, confidential, and sensitive data (such as precise geolocation data and information relating to children), and, as a result, we and the third parties upon which we rely face a variety of evolving threats, including but not limited to ransomware attacks, which could cause security incidents. Cyber-attacks, malicious internet-based activity, online and offline fraud, and other similar activities threaten the confidentiality, integrity, and availability of our sensitive data and information technology systems, and those of the third parties upon which we rely. Such threats are prevalent and continue to rise, are increasingly difficult to detect, and come from a variety of sources, including traditional computer “hackers,” threat actors, “hacktivists,” organized criminal threat actors, personnel (such as through theft or misuse), sophisticated nation states, and nation-state-supported actors.
Some actors now engage and are expected to continue to engage in cyber-attacks, including without limitation nation-state actors for geopolitical reasons and in conjunction with military conflicts and defense activities. During times of war and other major conflicts, we and the third parties upon which we rely may be vulnerable to a heightened risk of these attacks, including retaliatory cyber-attacks, that could materially disrupt our systems and operations, supply chain, and ability to produce, sell and distribute our services.
51
We and the third parties upon which we rely may be subject to and have previously responded to a variety of evolving threats, including but not limited to social-engineering attacks (including through phishing attacks and deep fakes, which may be increasingly more difficult to identify as fake), malicious code (such as viruses and worms), malware (including as a result of advanced persistent threat intrusions), bot-generated activity, denial-of-service attacks, credential stuffing attacks, credential harvesting, personnel misconduct or error, ransomware attacks, supply-chain attacks, software bugs, server malfunctions, software or hardware failures, loss of data or other information technology assets, adware, telecommunications failures, earthquakes, fires, floods, and other similar threats. Threat actors may continue to develop and use more sophisticated tools and techniques (including AI) that are specifically designed to circumvent security controls, evade detection, and obfuscate forensic evidence, which may make it more difficult for us to identify, investigate, respond to and recover from incidents.
In particular, severe ransomware attacks are becoming increasingly prevalent and can lead to significant interruptions in our operations, loss of sensitive data and income, reputational harm, and diversion of funds. Extortion payments may alleviate the negative impact of a ransomware attack, but we may be unwilling or unable to make such payments due to, for example, applicable laws or regulations prohibiting such payments. Additionally, to offer services to our customers and operate our business, we use a number of products and services, such as IT networks and systems, including those we own and operate as well as others provided by third-party providers. Our ability to provide our platform and services could be interrupted if these systems were impacted by a ransomware or other cyber-attack.
Our efforts to investigate, mitigate, contain, and remediate a security incident may not be successful. Actions taken by us or the third parties with whom we work to detect, investigate, mitigate, contain, and remediate a security incident could result in outages, data losses, and disruptions of our business. Threat actors may also gain access to other networks and systems after a compromise of our networks and systems.
Remote work has become more common and has increased risks to our information technology systems and data, as more of our personnel utilize network connections, computers, and devices outside our premises or network, including working at home, while in transit and in public locations. Additionally, future or past business transactions (such as acquisitions or integrations) could expose us to additional cybersecurity risks and vulnerabilities, as our systems could be negatively affected by vulnerabilities present in acquired or integrated entities’ systems and technologies.
In addition, our reliance on third-party service providers could introduce new cybersecurity risks and vulnerabilities, including supply-chain attacks, and other threats to our business operations. We may rely on third-party service providers and technologies to operate critical business systems to process sensitive data in a variety of contexts, including, without limitation, cloud-based infrastructure, data center facilities, encryption and authentication technology, employee email, content delivery to customers, and other functions. Our ability to monitor these third parties’ information security practices is limited, and these third parties may not have adequate information security measures in place. If our third-party service providers experience a security incident, coding issue, malfunction or other interruption, we could experience adverse consequences. In addition, supply-chain attacks have increased in frequency and severity, and we cannot guarantee that third parties’ infrastructure in our supply chain or our third-party partners’ supply chains have not been compromised.
With respect to data or information system vulnerabilities, we may be unable now or in the future to detect all vulnerabilities or other compromises in our data or information systems because such threats and techniques change frequently, are often sophisticated in nature, and may not be detected until after a security incident has occurred. While we take steps designed to mitigate the risks associated with such known vulnerabilities, there can be no assurance that these controls and measures will always be effective and thus there remains risks associated with both known and unknown vulnerabilities. Further, we may experience delays in developing and deploying remedial measures designed to address any such identified vulnerabilities.
Any of the previously identified or similar threats could cause a security incident or other interruption that could result in unauthorized, unlawful, or accidental acquisition, modification, destruction, loss, alteration, encryption, disclosure of, or access to our sensitive data (or sensitive data that our members, advertisers, and partners have shared with us) or our information technology systems, or those of the third parties upon whom we rely, or impact the calculation or measurement of our member metrics or other estimates, as disclosed above. A security incident or other interruption could disrupt our ability (and that of third parties upon whom we rely) to provide our services.
52
We may expend significant resources or modify our business activities to try to protect against security incidents. Additionally, certain data privacy and security obligations may require us to implement and maintain specific security measures or industry-standard or reasonable security measures to protect our information technology systems and sensitive data.
We and our third-party providers have been and may in the future be compromised by the aforementioned or similar threats, and result in unauthorized, unlawful, or accidental processing of our information, or vulnerabilities in the products or systems upon which we rely. For example, we have previously experienced credential stuffing attacks and other security incidents, including coding issues and instances of unauthorized access to certain member data. We determined that none of these incidents were material to us. We have encountered and may in the future encounter attempts to create false or other illegitimate member accounts or to take other unauthorized actions on or through our platform and services.
As we integrate Model Context Protocol ("MCP") and other agentic AI interfaces into our platform to enable third-party AI agents and large language models to access and act on member data and account functionality, we face additional data security and access-control risks. A flaw, misconfiguration, or vulnerability in the design, implementation, or permissioning of an MCP connection or similar agent-facing interface could result in data being inadvertently exposed to, or accessible by, another member, an unaffiliated third party, or an AI model or agent operator without authorization. Because MCP and similar protocols are relatively new, evolving, and not yet subject to mature security standards or extensive real-world testing, the tools, authentication methods, and monitoring practices available to detect and prevent such exposures may be less developed than those for more established integration methods. Any such incident, or the perception that one has occurred, could result in the unauthorized disclosure of sensitive member data (including precise location data), regulatory investigations or enforcement actions, litigation, loss of member trust, and reputational harm, any of which could adversely affect our business, financial condition, and results of operations.
Applicable data privacy and security obligations may require us, or we may choose, to notify relevant stakeholders, such as governmental authorities, partners, and affected individuals, of security incidents. Such disclosures may involve inconsistent requirements and are costly, and the disclosure or the failure to comply with applicable requirements could lead to adverse consequences. If we (or a third party upon whom we rely) experience a security incident or are perceived to have experienced a security incident, we may experience, and at times in the past have experienced, adverse consequences. These consequences may include: government enforcement actions (for example, investigations, fines, penalties, audits, and inspections); additional reporting requirements and/or oversight; restrictions on processing sensitive data (including personal data); litigation (including class claims and mass arbitration demands); indemnification obligations; negative publicity; reputational harm; monetary fund diversions; interruptions in our operations (including availability of data); direct and indirect financial loss (including due to potential loss of members, partners, or advertising revenue); and other similar harms. Security incidents and attendant consequences may cause customers to stop using our services, deter new customers from using our services, disrupt our ability to provide our products and services, and negatively impact our ability to grow and operate our business.
In addition to experiencing a security incident, third parties may gather, collect, or infer sensitive information about us from public sources, data brokers, or other means that reveals competitively sensitive details about our organization and could be used to undermine our competitive advantage or market position.
53
Our ability to offer integrations with third-party AI platforms depends on our continued access to those platforms’ MCP interfaces, and any restriction, change, or termination of our access could limit or eliminate those offerings and harm our business.
We intend to expand our MCP integrations to third-party AI platforms, assistants, and agents over time. These integrations may provide varying levels of access to member account data and platform functionality, ranging from read-only access (e.g., retrieving location or circle information) to write access (e.g., enabling an AI agent to modify settings, send communications, or take other actions on a member's behalf). As with our other third-party platform relationships, we generally do not have long-term contracts governing our ability to access or interoperate with these MCP interfaces, and the providers of these AI platforms retain broad discretion to change, restrict, condition, or discontinue our access at any time and with little or no notice. Because we do not control these third-party AI platforms or their underlying models, we cannot guarantee that they will continue to support our integration, that their policies and practices will remain compatible with our business or compliance obligations, or that they will maintain the security, reliability, or functionality necessary for members to trust agent-mediated access to their data. Expanding the scope of write access we grant to third-party AI agents increases the consequences of any error, malicious use, or model malfunction, as an agent acting with write permissions could take unintended or unauthorized actions on a member's account. If any provider of an AI platform with which we integrate restricts, conditions, or terminates our access, changes its MCP implementation in ways that are incompatible with our platform, or experiences its own security or reliability issues, our ability to offer agent-based features could be impaired, which could adversely affect member engagement, our reputation, and our business, financial condition, and results of operations.
The digital consumer subscription products market is competitive, with low switching costs and a consistent stream of new products, services, and entrants. We may not be able to compete successfully with current or future competitors, which may impact our business, financial condition, and results of operations.
The digital consumer subscription products market in general, and the markets for family safety, location sharing, location tracking and related offerings, are fast-paced and constantly changing, with frequent changes in technology, consumer expectations and requirements, industry standards and regulations and a consistent stream of new products, services, and entrants both in the U.S. and abroad. New technology developments, including the development and use of artificial intelligence ("AI"), autonomous AI agents, and other emerging technologies, are rapidly evolving and are changing the competitive dynamics of our industry. If our competitors gain an advantage by using such technologies—including by offering superior AI agent capabilities, integrating more deeply or earlier with third-party AI platforms, or enabling members to interact with their products through AI agents in ways we do not match—our ability to attract and retain members and advertisers, and to compete effectively, could be adversely impacted. In addition, as AI agents and agent-based interfaces become a more common way for consumers to discover, evaluate, and interact with digital products and services, members or prospective members may increasingly rely on AI agents (including those of third parties) to manage family safety, location sharing, or related functions, which could reduce engagement with our own branded app and interfaces, affect our ability to present advertising or upsell subscriptions directly to members, and create new and unpredictable competitive pressures, including pressure to adjust our pricing, product design, or distribution strategy to remain accessible through third-party agents. We face significant competition in every aspect of our business, and competitors include both large competitors with various product and service offerings and many smaller competitors.
Many of our current and potential competitors, both domestically and internationally, have or may have competitive advantages over us, including longer operating histories, significantly more resources (including larger marketing and operating budgets), greater brand recognition, access to more data and potential insights related to members, potential acquisition and other opportunities, higher amounts of available capital or access to such capital and in some cases, lower costs. Some of our competitors may enjoy better competitive positions in certain geographical regions, member demographics, or other key areas that we currently serve or may serve in the future. These advantages could enable these competitors to offer products that are more appealing to our existing and prospective members, to respond more quickly and/or cost-effectively than us to new or changing opportunities and regulations, new or emerging technologies or changes in customer requirements and preferences, or to offer lower prices or free products and services.
Potential competitors may also include operators of mobile operating systems and app stores. These mobile platform competitors could use strong or dominant positions in one or more markets, and access to existing large pools of potential members and personal information regarding those members, to gain competitive advantages over us. These competitors also control the app stores that are the principal means by which our members access our platform.
54
If we are not able to compete effectively against our current or future competitors and products or services that may emerge, the size and level of engagement of our member base may decrease, which could adversely affect our business, financial condition, and results of operations.
Changes to our existing brands, products, and services, or the introduction of new brands, products, or services, could fail to attract or retain members or generate revenue and profits.
Our ability to retain, increase, and engage our member base and to increase our revenue depends heavily on our ability to continue to evolve our existing brands, products, and services, as well as to acquire or create successful new ones, both independently and in conjunction with developers or other third parties. We may introduce significant changes to our existing brands, products, and services, or acquire new and unproven brands, products, services, and product and services extensions, including technologies with which we have little or no prior development or operating experience. We have also invested, and expect to continue to invest, significant resources in growing our subscription-based services to support increasing usage as well as new lines of business, products, services, product extensions, and other initiatives to generate revenue. Developing new products and services is expensive and can require substantial management and Company resources and attention and investing in the development and launch of new products and services can involve an extended period of time before a return on investment is achieved, if at all. An important element of our business strategy is to continue to make investments in innovation and related product and services opportunities to maintain our competitive position. Unanticipated problems in developing products and services could also divert substantial research and development resources, which may impair our ability to develop new products and services or enhance existing products and services, and substantially increase our costs. We may not receive revenues from these investments for several years and may not realize returns from such investments at all.
We intend to integrate our platform with third-party AI agents and platforms through MCP. We do not know whether, or to what extent, these integrations will increase member engagement or monthly active users, drive new or retained paid subscriptions, generate incremental advertising revenue, or have any positive effect on our business at all. It is possible that enabling third-party AI agents to access and act on our platform on a member's behalf could instead reduce direct engagement with our app and owned surfaces—where we generate advertising revenue and present subscription upsell opportunities—without a corresponding increase in subscription conversion or any other offsetting benefit. Because MCP-based integrations are a new and evolving area for us, we have limited historical data on member adoption, retention, or monetization impact, and we may invest significant engineering, product, and partnership resources in expanding MCP integrations without realizing any discernible increase in MAU, subscription revenue, or advertising revenue, which could adversely affect our business, financial condition, and results of operations.
The development of our products and services is complex and costly, and we typically have several products and services in development at the same time. Given the complexity, we occasionally have experienced, and could experience in the future, delays in the development and introduction of new and enhanced products and services. Problems in the design or quality of our products or services may also have an adverse effect on our brand, business, financial condition, or results of operations. Unanticipated problems in developing products and services could also divert substantial resources, including, but not limited to research and development, which may impair our ability to develop new products and services and enhancements of existing products and services, and could substantially increase our costs. For example, as we continue to expand our hardware offerings, including connected devices such as our recently launched Life360 Pet GPS tracker, we may be exposed to additional risks relating to product performance, quality, safety, or reliability. These devices may contain defects, experience performance issues, or fail to operate as intended. These may result from the design or manufacture of the product, or from the software or other components used in the product. Such issues could result in property damage, personal or pet injury, product returns, warranty claims, or product recalls. Any such issues, or the perception that our products are unsafe or unreliable, could damage our brand, lead to product liability claims or regulatory investigations, and require us to incur significant costs or expenses. Our insurance coverage may not fully protect us against all potential liabilities, and any resulting claims or adverse publicity could materially adversely affect our business, financial condition, and results of operations. If new or enhanced product and service introductions are delayed or not successful, we may not be able to achieve an acceptable return, if any, on our research and development efforts, and our business, financial condition, and results of operations may be adversely affected.
55
Our use of artificial intelligence, machine learning, and AI agent technologies, including through MCP integrations, may not be successful and may present additional business, compliance, security, and reputational risks.
We are incorporating AI and machine learning technologies into our platform, including by enabling third-party AI agents to access member data and platform functionality through MCP integrations. Our ability to realize the anticipated benefits of these investments is subject to significant uncertainty, including the risks described elsewhere in this section relating to data security and unauthorized data exposure in connection with MCP interfaces, our dependence on third-party AI platforms over which we have no long-term contractual rights of access, increased competitive pressure from AI agents offered by others, and uncertainty as to whether our AI and MCP investments will increase MAU, subscriptions, or advertising revenue. In addition, AI and machine learning technologies, including those we do not control (such as third-party models accessing our platform via MCP), may produce inaccurate, biased, or unintended outputs or actions, may be subject to evolving and inconsistent legal and regulatory frameworks across jurisdictions, and may expose us to new forms of liability, regulatory scrutiny, or reputational harm, particularly given the sensitivity of the location and family-safety data we process. There is no guarantee that our investments in AI and agent-based functionality will be successful, that we will realize any return on these investments, or that they will not instead adversely affect our business, financial condition, and results of operations.
Item 2. Unregistered Sales of Equity Securities and Use of Proceeds
Unregistered Sales of Equity Securities
On August 10, 2026, pursuant to the Asset Purchase Agreement with a private seller (the “Seller”), the Company acquired certain assets of the Seller for a total consideration of approximately $2.5 million, consisting of $1.9 million in cash and $0.6 million in common stock, and issued 9,495 shares of common stock (the “Shares”). The issuance of the Shares was not registered under the Securities Act of 1933, as amended (the “Securities Act”), because the Shares were offered and sold in a private placement not involving any public offering, in reliance on the exemption from registration provided by Section 4(a)(2) of the Securities Act and Rule 506(b) of Regulation D promulgated thereunder. The Seller, as recipient of the Shares, was an accredited investor, had access to information regarding the Company, and did not receive the Shares as a result of any general solicitation or advertising. No underwriters were involved in the issuance of the shares, and no underwriting discounts or commissions were paid in connection therewith.
Use of Proceeds
None.
Issuer Purchases of Equity Securities
In May 2026, the Company’s Board of Directors authorized a share repurchase program allowing the deployment of up to $225.0 million to repurchase the Company’s outstanding common stock (the “Repurchase Program”). The Repurchase Program has no expiration date, does not obligate the Company to acquire a specific number of shares, and may be modified, suspended, or discontinued at any time. Repurchases may be made from time to time in the open market, in privately-negotiated transactions, in block trades, and/or through Rule 10b5-1 trading plans and Rule 10b-18 transactions, depending on market conditions and applicable rules and regulations.
The following table shows the share repurchase activity for the three months ended September 30, 2026. The average price paid per share and the remaining authorization under the Company's share repurchase program exclude commissions and fees associated with the repurchases.
| Period | Total number of shares purchased | Average price paid per share | Total number of shares purchased as part of publicly announced plans or programs | Maximum dollar value of shares that may yet be purchased under the plans or programs (In thousands) | ||||||||||||||||||||||
| July 1, 2026 – July 31, 2026 | — | $ | — | — | $ | 211,781 | ||||||||||||||||||||
| August 1, 2026 – August 31, 2026 | 636,597 | $ | 47.12 | 636,597 | $ | 181,782 | ||||||||||||||||||||
| September 1, 2026 – September 30, 2026 | 29,739 | $ | 40.65 | 29,739 | $ | 180,573 | ||||||||||||||||||||
| Total | 666,336 | 666,336 | ||||||||||||||||||||||||
56
Item 3. Defaults Upon Senior Securities
None.
Item 4. Mine Safety Disclosures
Not Applicable.
Item 5. Other Information
(a) None.
(b) None.
(c) Rule 10b5-1 Trading Plans
Our directors and officers (as defined in Rule 16a-1(f) of the Exchange Act) (“Section 16 Officers”), may from time to time enter into plans for the purchase or sale of our common stock that are intended to satisfy the affirmative defense in Rule 10b5-1(c) of the Exchange Act.
During the three months ended September 30, 2026, the following Section 16 Officer adopted a “Rule 10b5-1 trading arrangement” as defined in Item 408 of Regulation S-K:
| Name | Title | Action | Adoption Date | Expiration Date | Total number of securities to be sold | |||||||||||||||||||||||||||
Up to | ||||||||||||||||||||||||||||||||
57
Item 6. Exhibits
| Incorporated by Reference | ||||||||||||||||||||||||||||||||||||||
Exhibit No. | Description | Filed Herewith | Form | File No. | Filing Date | Exhibit No. | ||||||||||||||||||||||||||||||||
3.1 | 8-K | 000-56424 | June 3, 2024 | 3.1 | ||||||||||||||||||||||||||||||||||
| 3.2 | 10-Q | 001-42120 | August 10, 2026 | 3.2 | ||||||||||||||||||||||||||||||||||
| 10.1 | X | |||||||||||||||||||||||||||||||||||||
| 31.1 | X | |||||||||||||||||||||||||||||||||||||
| 31.2 | X | |||||||||||||||||||||||||||||||||||||
| 32.1* | X | |||||||||||||||||||||||||||||||||||||
| 32.2* | X | |||||||||||||||||||||||||||||||||||||
| 101.INS | Inline XBRL Instance Document | X | ||||||||||||||||||||||||||||||||||||
| 101.SCH | Inline XBRL Taxonomy Extension Schema With Embedded Linkbase Documents | X | ||||||||||||||||||||||||||||||||||||
| 104 | Cover Page Interactive Data (formatted as Inline XBRL and contained in Exhibit 101) | X | ||||||||||||||||||||||||||||||||||||
_____________________
* This certification is being furnished solely to accompany this Quarterly Report on Form 10-Q pursuant to 18 U.S.C. Section 1350, and is not being filed for purposes of Section 18 of the Exchange Act or otherwise subject to the liability of that section, nor shall it be deemed incorporated by reference into any filing of the registrant under the Securities Act or the Exchange Act, whether made before or after the date hereof, regardless of any general incorporation language in such filing.
58
SIGNATURES
Pursuant to the requirements of Section 13 or 15(d) of the Securities Exchange Act of 1934, the registrant has duly caused this report to be signed on its behalf by the undersigned, thereunto duly authorized.
| LIFE360, INC. | |||||||||||
| Dated: | November 9, 2026 | By: | /s/ Lauren Antonoff | ||||||||
Lauren Antonoff | |||||||||||
Chief Executive Officer and Director | |||||||||||
| (Principal Executive Officer) | |||||||||||
| Dated: | November 9, 2026 | By: | /s/ Russell Burke | ||||||||
| Russell Burke | |||||||||||
| Chief Financial Officer | |||||||||||
(Principal Financial and Accounting Officer) | |||||||||||
59
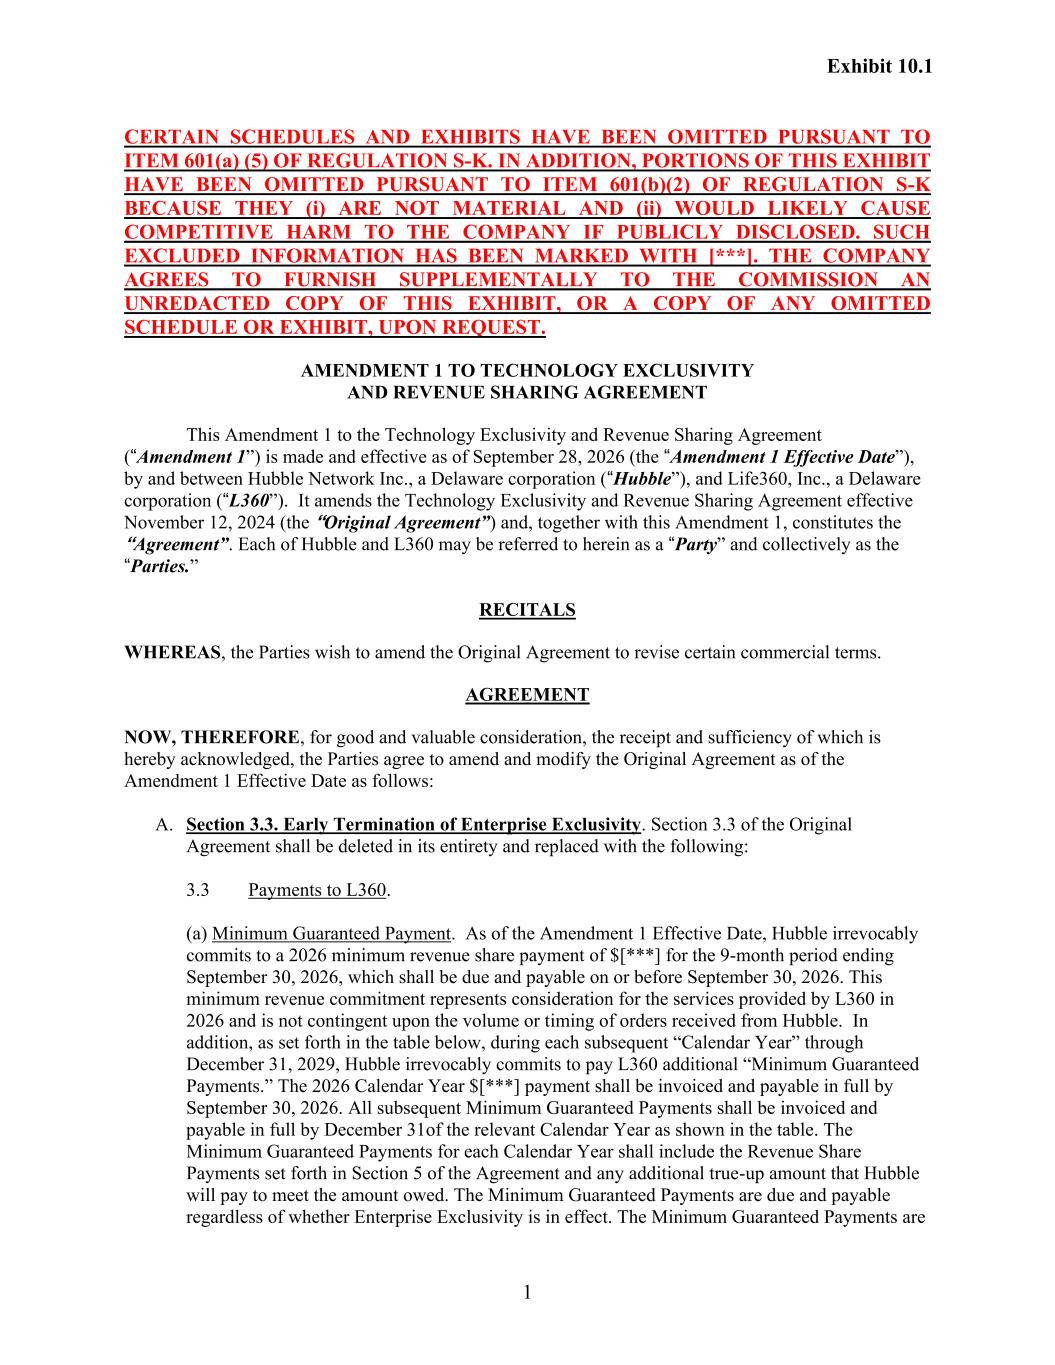
1 CERTAIN SCHEDULES AND EXHIBITS HAVE BEEN OMITTED PURSUANT TO ITEM 601(a) (5) OF REGULATION S-K. IN ADDITION, PORTIONS OF THIS EXHIBIT HAVE BEEN OMITTED PURSUANT TO ITEM 601(b)(2) OF REGULATION S-K BECAUSE THEY (i) ARE NOT MATERIAL AND (ii) WOULD LIKELY CAUSE COMPETITIVE HARM TO THE COMPANY IF PUBLICLY DISCLOSED. SUCH EXCLUDED INFORMATION HAS BEEN MARKED WITH [***]. THE COMPANY AGREES TO FURNISH SUPPLEMENTALLY TO THE COMMISSION AN UNREDACTED COPY OF THIS EXHIBIT, OR A COPY OF ANY OMITTED SCHEDULE OR EXHIBIT, UPON REQUEST. AMENDMENT 1 TO TECHNOLOGY EXCLUSIVITY AND REVENUE SHARING AGREEMENT This Amendment 1 to the Technology Exclusivity and Revenue Sharing Agreement (“Amendment 1”) is made and effective as of September 28, 2026 (the “Amendment 1 Effective Date”), by and between Hubble Network Inc., a Delaware corporation (“Hubble”), and Life360, Inc., a Delaware corporation (“L360”). It amends the Technology Exclusivity and Revenue Sharing Agreement effective November 12, 2024 (the “Original Agreement”) and, together with this Amendment 1, constitutes the “Agreement”. Each of Hubble and L360 may be referred to herein as a “Party” and collectively as the “Parties.” RECITALS WHEREAS, the Parties wish to amend the Original Agreement to revise certain commercial terms. AGREEMENT NOW, THEREFORE, for good and valuable consideration, the receipt and sufficiency of which is hereby acknowledged, the Parties agree to amend and modify the Original Agreement as of the Amendment 1 Effective Date as follows: A. Section 3.3. Early Termination of Enterprise Exclusivity. Section 3.3 of the Original Agreement shall be deleted in its entirety and replaced with the following: 3.3 Payments to L360. (a) Minimum Guaranteed Payment. As of the Amendment 1 Effective Date, Hubble irrevocably commits to a 2026 minimum revenue share payment of $[***] for the 9-month period ending September 30, 2026, which shall be due and payable on or before September 30, 2026. This minimum revenue commitment represents consideration for the services provided by L360 in 2026 and is not contingent upon the volume or timing of orders received from Hubble. In addition, as set forth in the table below, during each subsequent “Calendar Year” through December 31, 2029, Hubble irrevocably commits to pay L360 additional “Minimum Guaranteed Payments.” The 2026 Calendar Year $[***] payment shall be invoiced and payable in full by September 30, 2026. All subsequent Minimum Guaranteed Payments shall be invoiced and payable in full by December 31of the relevant Calendar Year as shown in the table. The Minimum Guaranteed Payments for each Calendar Year shall include the Revenue Share Payments set forth in Section 5 of the Agreement and any additional true-up amount that Hubble will pay to meet the amount owed. The Minimum Guaranteed Payments are due and payable regardless of whether Enterprise Exclusivity is in effect. The Minimum Guaranteed Payments are
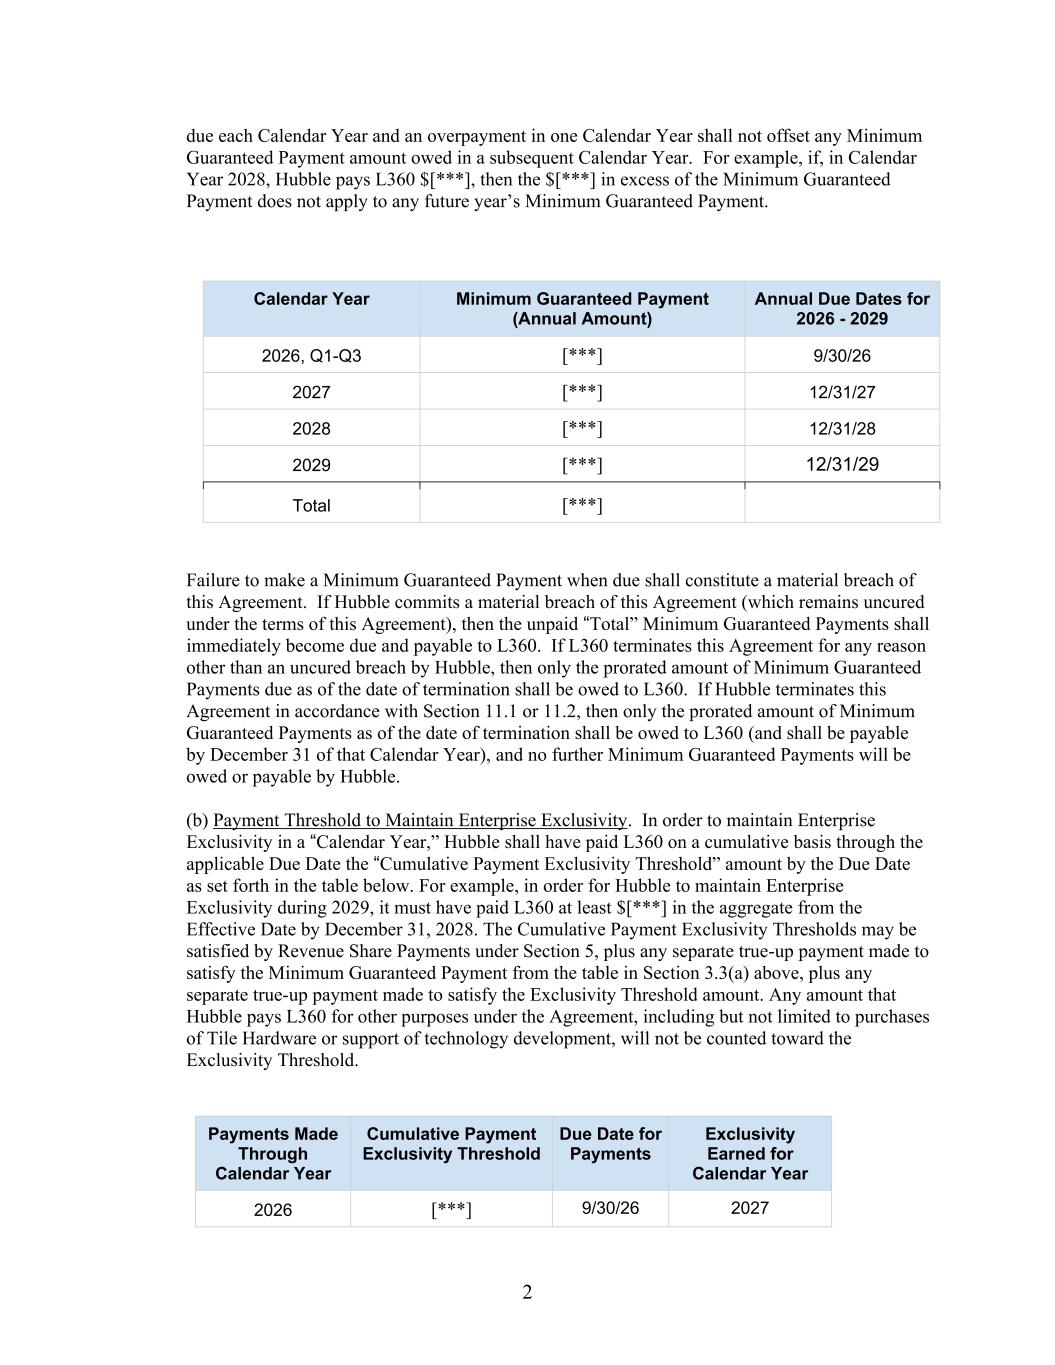
2 due each Calendar Year and an overpayment in one Calendar Year shall not offset any Minimum Guaranteed Payment amount owed in a subsequent Calendar Year. For example, if, in Calendar Year 2028, Hubble pays L360 $[***], then the $[***] in excess of the Minimum Guaranteed Payment does not apply to any future year’s Minimum Guaranteed Payment. Calendar Year Minimum Guaranteed Payment (Annual Amount) Annual Due Dates for 2026 - 2029 2026, Q1-Q3 [***] 9/30/26 2027 [***] 12/31/27 2028 [***] 12/31/28 2029 [***] 12/31/29 Total [***] Failure to make a Minimum Guaranteed Payment when due shall constitute a material breach of this Agreement. If Hubble commits a material breach of this Agreement (which remains uncured under the terms of this Agreement), then the unpaid “Total” Minimum Guaranteed Payments shall immediately become due and payable to L360. If L360 terminates this Agreement for any reason other than an uncured breach by Hubble, then only the prorated amount of Minimum Guaranteed Payments due as of the date of termination shall be owed to L360. If Hubble terminates this Agreement in accordance with Section 11.1 or 11.2, then only the prorated amount of Minimum Guaranteed Payments as of the date of termination shall be owed to L360 (and shall be payable by December 31 of that Calendar Year), and no further Minimum Guaranteed Payments will be owed or payable by Hubble. (b) Payment Threshold to Maintain Enterprise Exclusivity. In order to maintain Enterprise Exclusivity in a “Calendar Year,” Hubble shall have paid L360 on a cumulative basis through the applicable Due Date the “Cumulative Payment Exclusivity Threshold” amount by the Due Date as set forth in the table below. For example, in order for Hubble to maintain Enterprise Exclusivity during 2029, it must have paid L360 at least $[***] in the aggregate from the Effective Date by December 31, 2028. The Cumulative Payment Exclusivity Thresholds may be satisfied by Revenue Share Payments under Section 5, plus any separate true-up payment made to satisfy the Minimum Guaranteed Payment from the table in Section 3.3(a) above, plus any separate true-up payment made to satisfy the Exclusivity Threshold amount. Any amount that Hubble pays L360 for other purposes under the Agreement, including but not limited to purchases of Tile Hardware or support of technology development, will not be counted toward the Exclusivity Threshold. Payments Made Through Calendar Year Cumulative Payment Exclusivity Threshold Due Date for Payments Exclusivity Earned for Calendar Year 2026 [***] 9/30/26 2027
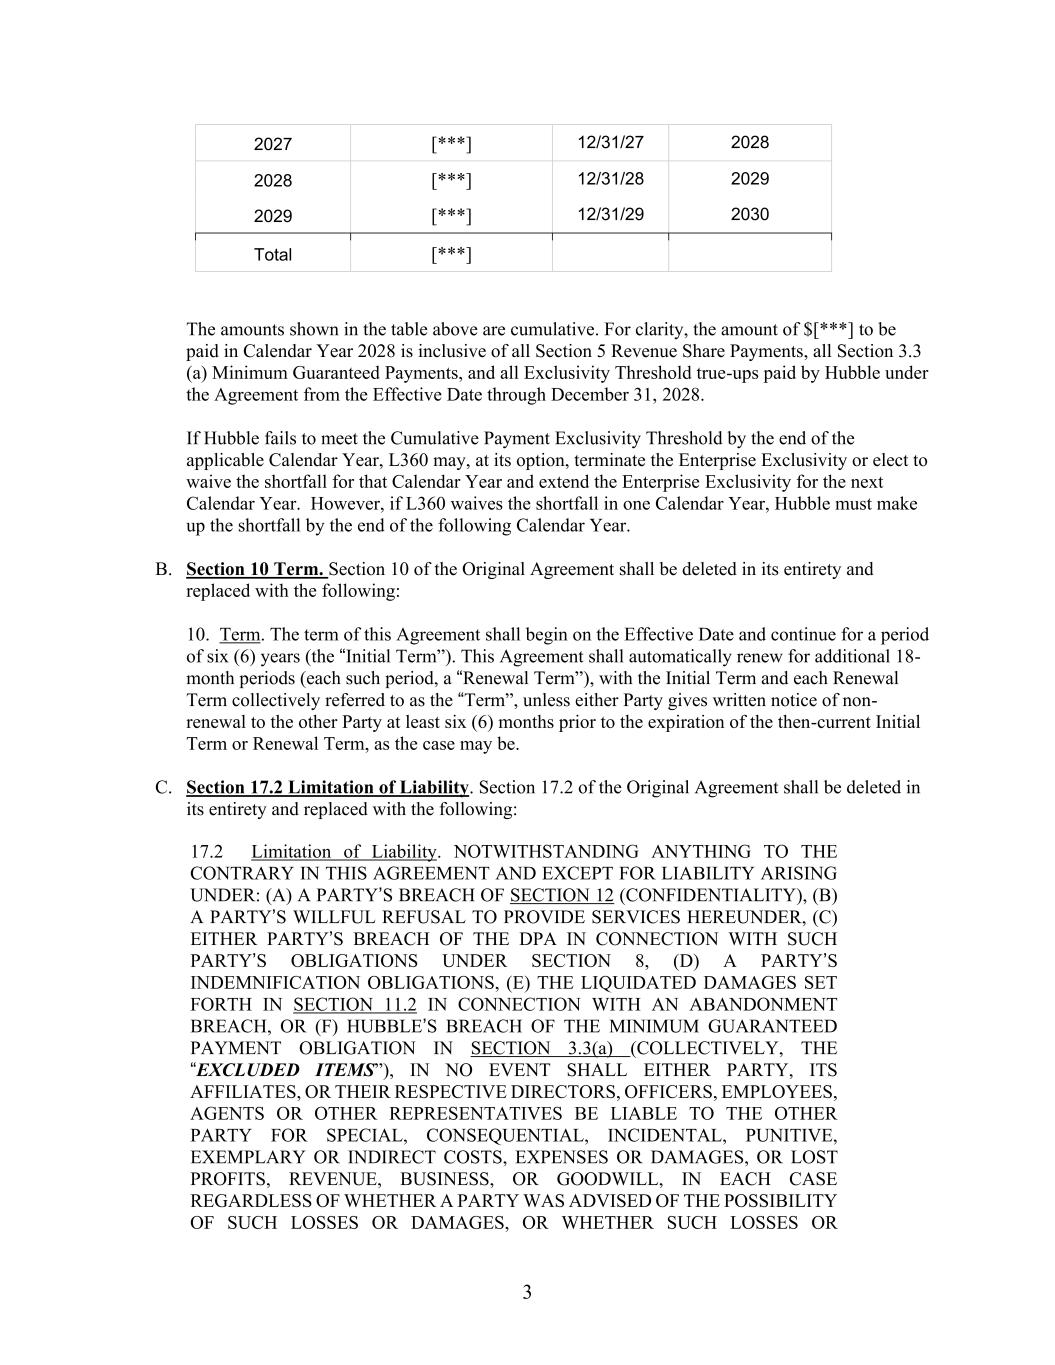
3 2027 [***] 12/31/27 2028 2028 [***] 12/31/28 2029 2029 [***] 12/31/29 2030 Total [***] The amounts shown in the table above are cumulative. For clarity, the amount of $[***] to be paid in Calendar Year 2028 is inclusive of all Section 5 Revenue Share Payments, all Section 3.3 (a) Minimum Guaranteed Payments, and all Exclusivity Threshold true-ups paid by Hubble under the Agreement from the Effective Date through December 31, 2028. If Hubble fails to meet the Cumulative Payment Exclusivity Threshold by the end of the applicable Calendar Year, L360 may, at its option, terminate the Enterprise Exclusivity or elect to waive the shortfall for that Calendar Year and extend the Enterprise Exclusivity for the next Calendar Year. However, if L360 waives the shortfall in one Calendar Year, Hubble must make up the shortfall by the end of the following Calendar Year. B. Section 10 Term. Section 10 of the Original Agreement shall be deleted in its entirety and replaced with the following: 10. Term. The term of this Agreement shall begin on the Effective Date and continue for a period of six (6) years (the “Initial Term”). This Agreement shall automatically renew for additional 18- month periods (each such period, a “Renewal Term”), with the Initial Term and each Renewal Term collectively referred to as the “Term”, unless either Party gives written notice of non- renewal to the other Party at least six (6) months prior to the expiration of the then-current Initial Term or Renewal Term, as the case may be. C. Section 17.2 Limitation of Liability. Section 17.2 of the Original Agreement shall be deleted in its entirety and replaced with the following: 17.2 Limitation of Liability. NOTWITHSTANDING ANYTHING TO THE CONTRARY IN THIS AGREEMENT AND EXCEPT FOR LIABILITY ARISING UNDER: (A) A PARTY’S BREACH OF SECTION 12 (CONFIDENTIALITY), (B) A PARTY’S WILLFUL REFUSAL TO PROVIDE SERVICES HEREUNDER, (C) EITHER PARTY’S BREACH OF THE DPA IN CONNECTION WITH SUCH PARTY’S OBLIGATIONS UNDER SECTION 8, (D) A PARTY’S INDEMNIFICATION OBLIGATIONS, (E) THE LIQUIDATED DAMAGES SET FORTH IN SECTION 11.2 IN CONNECTION WITH AN ABANDONMENT BREACH, OR (F) HUBBLE’S BREACH OF THE MINIMUM GUARANTEED PAYMENT OBLIGATION IN SECTION 3.3(a) (COLLECTIVELY, THE “EXCLUDED ITEMS”), IN NO EVENT SHALL EITHER PARTY, ITS AFFILIATES, OR THEIR RESPECTIVE DIRECTORS, OFFICERS, EMPLOYEES, AGENTS OR OTHER REPRESENTATIVES BE LIABLE TO THE OTHER PARTY FOR SPECIAL, CONSEQUENTIAL, INCIDENTAL, PUNITIVE, EXEMPLARY OR INDIRECT COSTS, EXPENSES OR DAMAGES, OR LOST PROFITS, REVENUE, BUSINESS, OR GOODWILL, IN EACH CASE REGARDLESS OF WHETHER A PARTY WAS ADVISED OF THE POSSIBILITY OF SUCH LOSSES OR DAMAGES, OR WHETHER SUCH LOSSES OR
4 DAMAGES WERE OTHERWISE FORESEEABLE. EXCEPT FOR LIABILITY ARISING UNDER THE EXCLUDED ITEMS OR A PARTY’S INDEMNIFICATION OBLIGATIONS SET FORTH IN SECTION 16, IN NO EVENT WILL THE AGGREGATE LIABILITY OF A PARTY ARISING OUT OF OR RELATED TO THIS AGREEMENT, WHETHER ARISING UNDER OR RELATED TO BREACH OF CONTRACT, TORT (INCLUDING NEGLIGENCE), STRICT LIABILITY OR ANY OTHER LEGAL OR EQUITABLE THEORY, EXCEED THE REVENUE SHARE PAYMENTS PAID BY HUBBLE UNDER THIS AGREEMENT DURING THE TWELVE (12) MONTH PERIOD PRIOR TO THE DATE THE CAUSE OF ACTION GIVING RISE TO LIABILITY AROSE; PROVIDED THAT THE ABANDONMENT DAMAGES SET FORTH IN SECTION 11.2 SHALL NOT BE LIMITED BY THE FOREGOING LIMITATION OF LIABILITY. THE FOREGOING LIMITATION OF LIABILITY IS CUMULATIVE WITH ALL PAYMENTS FOR CLAIMS IN CONNECTION WITH THIS AGREEMENT BEING AGGREGATED TO DETERMINE SATISFACTION OF THE LIMIT. D. Miscellaneous. Unless otherwise defined herein, any capitalized term shall have its respective definition as set forth in the Agreement. Except as expressly modified by this Amendment 1, all terms and conditions of the Agreement shall remain in full force and effect. In the event of any conflict between the terms of this Amendment 1 and the Agreement, this Amendment 1 shall control. This Amendment 1, together with the Agreement, constitutes the entire agreement between the Parties with respect to the subject matter hereof and supersedes all prior and contemporaneous understandings, agreements, representations, and warranties, both written and oral, with respect to such subject matter. This Amendment 1 may be executed in one or more counterparts, each of which when executed shall be deemed to be an original but all of which when taken together shall constitute one and the same agreement. [The remainder of this page is intentionally left blank]
5 IN WITNESS WHEREOF, the Parties hereto have duly executed this Amendment 1 to the Technology Exclusivity and Revenue Sharing Agreement as of the Amendment 1 Effective Date. HUBBLE: HUBBLE NETWORK, INC. By: /s/ Alex Haro Name: Alex Haro Its: Chief Executive Officer L360: LIFE360, INC. By: /s/ Lauren Antonoff Name: Lauren Antonoff Its: Chief Executive Officer
Exhibit 31.1
CERTIFICATION OF CHIEF EXECUTIVE OFFICER
PURSUANT TO EXCHANGE ACT RULE 13a-14(a)/15d-14(a)
AS ADOPTED PURSUANT TO SECTION 302
OF THE SARBANES-OXLEY ACT OF 2002
I, Lauren Antonoff, certify that:
1. I have reviewed this Quarterly Report on Form 10-Q of Life360, Inc. (the “registrant”);
2. Based on my knowledge, this report does not contain any untrue statement of a material fact or omit to state a material fact necessary to make the statements made, in light of the circumstances under which such statements were made, not misleading with respect to the period covered by this report;
3. Based on my knowledge, the financial statements, and other financial information included in this report, fairly present in all material respects the financial condition, results of operations and cash flows of the registrant as of, and for, the periods presented in this report;
4. The registrant's other certifying officer and I are responsible for establishing and maintaining disclosure controls and procedures (as defined in Exchange Act Rules 13a-15(e) and 15d-15(e)) and internal control over financial reporting (as defined in Exchange Act Rules 13a-15(f) and 15d-15(f)) for the registrant and have:
a) Designed such disclosure controls and procedures, or caused such disclosure controls and procedures to be designed under our supervision, to ensure that material information relating to the registrant, including its consolidated subsidiaries, is made known to us by others within those entities, particularly during the period in which this report is being prepared;
b) Designed such internal control over financial reporting, or caused such internal control over financial reporting to be designed under our supervision, to provide reasonable assurance regarding the reliability of financial reporting and the preparation of financial statements for external purposes in accordance with generally accepted accounting principles;
c) Evaluated the effectiveness of the registrant's disclosure controls and procedures and presented in this report our conclusions about the effectiveness of the disclosure controls and procedures, as of the end of the period covered by this report based on such evaluation; and
d) Disclosed in this report any change in the registrant’s internal control over financial reporting that occurred during the registrant’s most recent fiscal quarter (the registrant’s fourth fiscal quarter in the case of an annual report) that has materially affected, or is reasonably likely to materially affect, the registrant’s internal control over financial reporting; and
5. The registrant's other certifying officer and I have disclosed, based on our most recent evaluation of internal control over financial reporting, to the registrant's auditors and the audit committee of the registrant's board of directors (or persons performing the equivalent functions):
a) All significant deficiencies and material weaknesses in the design or operation of internal control over financial reporting which are reasonably likely to adversely affect the registrant's ability to record, process, summarize and report financial information; and
b) Any fraud, whether or not material, that involves management or other employees who have a significant role in the registrant's internal control over financial reporting.
Dated: | November 9, 2026 | /s/ | Lauren Antonoff | |||||||||||
| Lauren Antonoff | ||||||||||||||
| Chief Executive Officer and Director | ||||||||||||||
Exhibit 31.2
CERTIFICATION OF CHIEF FINANCIAL OFFICER
PURSUANT TO EXCHANGE ACT RULE 13a-14(a)/15d-14(a)
AS ADOPTED PURSUANT TO SECTION 302
OF THE SARBANES-OXLEY ACT OF 2002
I, Russell Burke, certify that:
1. I have reviewed this Quarterly Report on Form 10-Q of Life360, Inc. (the “registrant”);
2. Based on my knowledge, this report does not contain any untrue statement of a material fact or omit to state a material fact necessary to make the statements made, in light of the circumstances under which such statements were made, not misleading with respect to the period covered by this report;
3. Based on my knowledge, the financial statements, and other financial information included in this report, fairly present in all material respects the financial condition, results of operations and cash flows of the registrant as of, and for, the periods presented in this report;
4. The registrant's other certifying officer and I are responsible for establishing and maintaining disclosure controls and procedures (as defined in Exchange Act Rules 13a-15(e) and 15d-15(e)) and internal control over financial reporting (as defined in Exchange Act Rules 13a-15(f) and 15d-15(f)) for the registrant and have:
a) Designed such disclosure controls and procedures, or caused such disclosure controls and procedures to be designed under our supervision, to ensure that material information relating to the registrant, including its consolidated subsidiaries, is made known to us by others within those entities, particularly during the period in which this report is being prepared;
b) Designed such internal control over financial reporting, or caused such internal control over financial reporting to be designed under our supervision, to provide reasonable assurance regarding the reliability of financial reporting and the preparation of financial statements for external purposes in accordance with generally accepted accounting principles;
c) Evaluated the effectiveness of the registrant's disclosure controls and procedures and presented in this report our conclusions about the effectiveness of the disclosure controls and procedures, as of the end of the period covered by this report based on such evaluation; and
d) Disclosed in this report any change in the registrant’s internal control over financial reporting that occurred during the registrant’s most recent fiscal quarter (the registrant’s fourth fiscal quarter in the case of an annual report) that has materially affected, or is reasonably likely to materially affect, the registrant’s internal control over financial reporting; and
5. The registrant's other certifying officer and I have disclosed, based on our most recent evaluation of internal control over financial reporting, to the registrant's auditors and the audit committee of the registrant's board of directors (or persons performing the equivalent functions):
a) All significant deficiencies and material weaknesses in the design or operation of internal control over financial reporting which are reasonably likely to adversely affect the registrant's ability to record, process, summarize and report financial information; and
b) Any fraud, whether or not material, that involves management or other employees who have a significant role in the registrant's internal control over financial reporting.
Dated: | November 9, 2026 | /s/ | Russell Burke | |||||||||||
| Russell Burke | ||||||||||||||
| Chief Financial Officer | ||||||||||||||
Exhibit 32.1
CERTIFICATION
PURSUANT TO 18 U.S.C. SECTION 1350
AS ADOPTED PURSUANT TO
SECTION 906 OF THE SARBANES-OXLEY ACT OF 2002
In connection with the accompanying Quarterly Report of Life360, Inc. (the “Company”), on Form 10-Q for the quarter ended September 30, 2026 (the “Report”), I, Lauren Antonoff, Chief Executive Officer of the Company, hereby certify pursuant to 18 U.S.C. § 1350, as adopted pursuant to § 906 of the Sarbanes-Oxley Act of 2002 that, to my knowledge:
(1)the Report fully complies with the requirements of section 13(a) or 15(d) of the Securities Exchange Act of 1934; and
(2)the information contained in the Report fairly presents, in all material respects, the financial condition and results of operations of the Company.
Dated: | November 9, 2026 | /s/ | Lauren Antonoff | |||||||||||
| Lauren Antonoff | ||||||||||||||
| Chief Executive Officer and Director | ||||||||||||||
Exhibit 32.2
CERTIFICATION
PURSUANT TO 18 U.S.C. SECTION 1350
AS ADOPTED PURSUANT TO
SECTION 906 OF THE SARBANES-OXLEY ACT OF 2002
In connection with the accompanying Quarterly Report of Life360, Inc. (the “Company”), on Form 10-Q for the quarter ended September 30, 2026 (the “Report”), I, Russell Burke, Chief Financial Officer of the Company, hereby certify pursuant to 18 U.S.C. § 1350, as adopted pursuant to § 906 of the Sarbanes-Oxley Act of 2002 that, to my knowledge:
(1)the Report fully complies with the requirements of section 13(a) or 15(d) of the Securities Exchange Act of 1934; and
(2)the information contained in the Report fairly presents, in all material respects, the financial condition and results of operations of the Company.
Dated: | November 9, 2026 | /s/ | Russell Burke | |||||||||||
| Russell Burke | ||||||||||||||
| Chief Financial Officer | ||||||||||||||